Trade ideas

EOS/USD ANALYSprice is in bullish channel which now we are in bottom. i think at first we can have rich the demand area which i point in diagram and than after rest we can break it out for reaching the top of channel.
what do you think? i will be happy to know your opinion. BITFINEX:EOSUSD

EOSUSD D1: BEST Level to SHORT IT 20/40% gains(SL/TP)(NEW)Why get subbed to me on Tradingview?
-TOP author on TradingView
-15+ years experience in markets
-Professional chart break downs
-Supply/Demand Zones
-TD9 counts / combo review
-Key S/R levels
-No junk on my charts
-Frequent updates
-Covering FX/crypto/US stocks
-24/7 uptime so constant updates
EOSUSD D1: BEST Level to SHORT IT 20/40% gains(SL/TP)(NEW)
IMPORTANT NOTE: speculative setup. do your own
due dill. use STOP LOSS. don't overleverage.
Tagged as SHORT as I expect more losses
short and mid term.
🔸 Summary and potential trade setup
::: EOSUSD daily chart review
::: heavy rejection on daily timefram
::: BEAR flagging on daily chart
::: expecting 20%/40% correction
::: shorting from KEY S/R level is good
::: BEARS will target recent cycle lows
::: TP Bears is +20%/40% gains
::: targets based on swing extensions
::: get ready to short from highs
::: and get paid bears
::: recommended strategy: SHORT IT TP 2.40 USD
::: short near market / short rallies/rips
::: SWING TRADE: SHORT/HOLD IT
::: correction not over yet
::: good luck traders!
::: SHORT and get paid. period.
🔸 Supply/Demand Zones
::: N/A
::: N/A
🔸 Other noteworthy technicals/fundies
::: TD9 /Combo update: N/A
::: Sentiment mid-term: BEARS
::: Sentiment outlook short-term: BEARS
RISK DISCLAIMER:
Trading Futures , Forex, CFDs and Stocks involves a risk of loss.
Please consider carefully if such trading is appropriate for you.
Past performance is not indicative of future results.
Always limit your leverage and use tight stop loss.

Ready for EOS ?Higher lows then the Downtrend(pink Line) is broken, re-test has done of this line, now the channel target is about 96$, these are my opinions and its not an advice just for education to myself :) Lets see if it works ;)

EOS - Elliot Wave MapI'm speculating based on Elliot Wave Strategy.
Disclaimer
All investment strategies and investments involve risk of loss. Nothing here should be construed as investment advice. Any reference to an investment's past or potential performance is not, and should not be construed as, a recommendation or as a guarantee of any specific outcome or profit.

EOS vs ETH & BTCI'm speculating based on the last BTC Bull Run, EOS appears to still yet make its move. I used the 6 day average "since there is no Weekly average" for EOS and compared current runs while reflecting on the past bull run.
Disclaimer
All investment strategies and investments involve risk of loss. Nothing here should be construed as investment advice. Any reference to an investment's past or potential performance is not, and should not be construed as, a recommendation or as a guarantee of any specific outcome or profit.

eos ideaafter that crazy dip , looks like this coin is back to channel. accumulation looking solid buying a small position 200 coins. this is not a recomendation

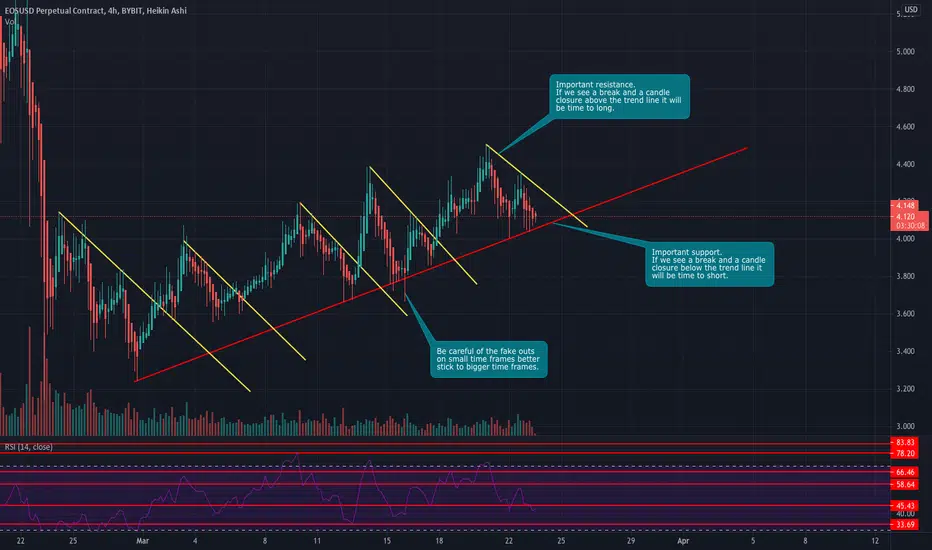
EOSUSD Easy Money Making StrategyHello everyone, if you like the idea, do not forget to support with a like and follow.
Simple plan by just waiting a break of either trend lines (red or yellow).
You can see that we are on this type of looping a long time now a break of the trend line that is holding us down (yellow) and then we make a new high.
If we see a break of the the important trend line (red) that is holding the uptrend it will be a good short to enter, be careful of the fake outs wait for full candle closure and retest of the line before entering the short.
Thank you for reading my post, have a great day, wish you all the best !
Information provided is only educational and should not be used to take action in the market.
Feel free to ask anything in the comments :)
EOSUSD: A True or False Breakout?Finally the dynamic resistance is broken out. FYI, that is the 12th one. I await a true trend reversal here. I hope. ;-)


EOS, long the pullback.This entry would be wonderful...
I don't think weekly resistance (purple line) will hold another test. It might just pump from here actually but I don't recommend buying resistance. But in either case the next weekly resistance would be the target.

Eos (EOS) - March 29Hello?
Dear traders, nice to meet you.
By "following" you can always get new information quickly.
Please also click "Like".
Have a nice day.
-------------------------------------------------- -----
We have to see if we can get support and ascend at the 4.0849 point.
If it falls, we need to make sure it is supported at 3.8859.
If it falls at the 3.6722 point, a Stop Loss is needed to preserve the profit and loss.
-------------------------------------
(EOSBTC 1D chart)
We have to see if we can ascend above the 748 Satoshi point.
-------------------------------------------------- -------------------------------------------
** All indicators are lagging indicators.
So, it's important to be aware that the indicator moves accordingly with the movement of price and volume.
Just for convenience, we are talking upside down for interpretation of the indicators.
** The wRSI_SR indicator is an indicator created by adding settings and options from the existing Stochastic RSI indicator.
Hence, the interpretation is the same as the traditional Stochastic RSI indicator. (K, D line -> R, S line)
** The OBV indicator was re-created by applying a formula to the DepthHouse Trading indicator, an indicator that oh92 disclosed. (Thank you for this.)
** Check support, resistance, and abbreviation points.
** Support or resistance is based on the closing price of the 1D chart.
** All explanations are for reference only and do not guarantee profit or loss on investment.
Explanation of abbreviations displayed on the chart
R: A point or section of resistance that requires a response to preserve profits
S-L: Stop Loss point or section
S: A point or segment that can be bought for profit generation as a support point or segment
(Short-term Stop Loss can be said to be a point where profits and losses can be preserved or additionally entered through installment transactions. It is a short-term investment perspective.)
GAP refers to the difference in prices that occurred when the stock market, CME, and BAKKT exchanges were closed because they do not trade 24 hours a day.
G1: Closing price when closed
G2: Cigar at the time of opening
(Example) Gap (G1-G2)

EOS may resume it's uptrend to a previous $5.50 highEOS had a virtually uninterrupted rally from $2.50 on January 28th to the high of $5.50 on February 13th. After dropping to a low of $3.17 on February 23rd, EOS made four attempts to rally, achieving 4 sucessive higher highs on March 3, 9, 13, and 20th. Unusually strong up days on March 1, 9, 13, 16, and 26th potentially reveal accumulation patterns by institutional accounts. It pays to follow the money, in my opinion. I don't currently have a position in EOS, but this may change in the future.

EOS possible LONG-watch short term to confirm trend before entry4hr broke below trend when BTC fell to 50K. If EOS/BTC bottom holds, this could be a great long with huge upside potential.

EOSUSD: Wake up monster! Time to strike the iron!RSI (14): where it is here now lays strong support.
Also, RSI (14) is representing a double bottom .
Price Movements: it has been channelized with a steady & positive steep since 23 Feb 20.
MAs: If you remember my last analysis based on Daily MAs of 50, 100 & 200, price has touched the Daily MA of 100.
Now average price for a period of last 100 days is 3.44. Right? Have a look o the following then:
Important S&Rs: Static-Dynamic Support & Resistances are: 3.44 down & 4.45 up there.
EOS needs volume to be able to make it out of the cage.
RSI (2): since 26 Feb to 24 Mar (26 days) a cycle has been started & finished. For more time zone assessment please check another analysis in which Fib. Time zones are represented as well:
TP1: 5.5
TP2: 6.5
TP3: 8.5
SL: -5% from your purchased price.
Not a financial advice.

EOS ready for a new bull run The weekly chart of EOS highlights a bearish momentum.On coming to the daily time frame EOS price is below 50 and above 100 Moving Average.The 50 MA (Red) line is at $4.11 making it temporary resistance for the coin. Resistance of the coin on going upside can be seen at $ 4.5 and on the downside bounceback can be seen from $3.5.An Accumulation zone is being formed in the Monero on the shorter time frame of 4-hour chart.If the price goes above $4.2 then a huge buying rush can be seen in the coin.EOS/USD pair can see a bullish move in the upcoming days.EOS/BTC pair can also see an uptrend in upcoming days.
Kindly comment your thoughts below

EOSUSD Is going to be one of the biggest hitters this year! 1HRBeen following EOS for some time since it came out.
I have a projection of 25+ by July easily.
Short term $5 is inbound in for sure!
Anything dealing with Ethereum has my attention.
Ethereum will be over 30k by 2022-23.. :)
Lets get it baby! Super excited

EOS target 6 USDEOS / BTC is in a steady uptrend despite of the decline of BTC vs the dollar! This is one of the best signs an altcoin can have. When EOS breaks 4.5 it will fly to 5.5, if it breaks 5.5 it can actually fly straight to 8 usd.

EOSUSD: What MA's are implicating?When MAs cross like that a truly bullish rally can be just a start. Then, holding this new stable coin seems inevitable.

EOS Testing Major ResistanceTesting this resistance again - the more we test the more likely it will break. Hoping to break over and get a nice resistance support flip before tracking up to the recent high before the end of the month.
-dependant on how BTC performs
-have not surpassed this resistance since the initial February drop
-not much resistance until the recent high after this resistance
-upwards trend this month

Eos (EOS) - March 23Hello?
Dear traders, nice to meet you.
By "following" you can always get new information quickly.
Please also click "Like".
Have a good day.
-------------------------------------------------- -----
We need to see if we can get support at the 4.0849 point and climb along the uptrend line.
If it falls, we need to make sure we get support at 3.7849.
In particular, it remains to be seen if it can rise along the uptrend line (2).
If you fall from the 3.7849 point, you can touch the 2.8250 point, so you need a Stop Loss to preserve profit or loss.
If it is supported in the important section of 3.7849-4.1343, it is expected to rise.
-------------------------------------------
(EOSBTC 1D chart)
We must see if we can get support from 748 Satoshi and rise above 784 Satoshi.
In particular, we have to see if we can cross the 759 Satoshi-972 Satoshi section.
-------------------------------------------------- -------------------------------------------
** All indicators are lagging indicators.
So, it's important to be aware that the indicator moves accordingly with the movement of price and volume.
Just for the sake of convenience, we are talking upside down for interpretation of the indicators.
** The wRSI_SR indicator is an indicator created by adding settings and options from the existing Stochastic RSI indicator.
Therefore, the interpretation is the same as the conventional stochastic RSI indicator. (K, D line -> R, S line)
** The OBV indicator was re-created by applying a formula to the DepthHouse Trading indicator, an indicator that oh92 disclosed. (Thank you for this.)
** Check support, resistance, and abbreviation points.
** Support or resistance is based on the closing price of the 1D chart.
** All explanations are for reference only and do not guarantee profit or loss on investment.
Explanation of abbreviations displayed on the chart
R: A point or section of resistance that requires a response to preserve profits
S-L: Stop Loss point or section
S: A point or segment that can be bought for profit generation as a support point or segment
(Short-term Stop Loss can be said to be a point where profits and losses can be preserved or additionally entered through installment transactions. It is a short-term investment perspective.
GAP refers to the difference in prices that occurred when the stock market, CME, and BAKKT exchanges were closed because they do not trade 24 hours a day.
G1: Closing price when closed
G2: Cigar at the time of opening
(Example) Gap (G1-G2)

