Concept of GON...Overview
Concept of GON - Get Out Now!!!
Thanks to spending most of my time on the wrong side of the markets, the GON (Get Out Now!!!) found me.
GON aids in telling me when the markets are about to gain momentum and start to move strongly against a wrong position, the realisation check to save oneself...
Understanding the trading journey; SPOT trading turned into glorified DCA (dollar cost average) trading, resulting in greed wanting to make more and then fighting this cumbersome world of liquidations, sizing, leveraging continually beaten by the markets.
Clarity on Abbreviations (how would one word it)
F8 = Fibonacci tool in short, makes it easier to withstand typos.
print ('F'+len('ibonacci'))
Last leg - The last leg is calculated from the start/beginning of the trend till the last highest high (HH) or lowest low (LL) position - dependant on direction of the trend. This last stretch/movement whereby the F8 tool is pulled/drawn from the top and bottom, in this article be referred to as the last leg.
External leg - This is the bigger move before the last leg.
Golden Pocket - between 0.618 (or 61.8%) and 0.65 (or 65%) of the last leg
Inverse Pocket - taking the opposite position of the golden pocket, calculating 100 - 61.8 (38.2) and 100 - 65 (35)
Momentum - it would be the force used to keep the price moving in one direction with little or no retracements.
Retracement value - The % mapped to the K8 tool position, this position would be compared against either the last leg or external leg.
Mixing F8 and Momentum
The F8 is useful in many ways, for me it would be to identify points of interest (POI), also putting a name to the reaction %.
During the course of learning the markets, what made sense to me about this Great F8 tool and how I could make use of it.
When drawing it, there is a starting point/value of 0 and ending point/value of 1. Depending which direction, the 0 and 1 could be swapped around and in this chart the 1 position would be at bottom and 0 at top. Knowing the potential retracement % level would be useful to calculate DCA probabilities. This is by bringing factors such as the direction, size and likelihood into equation.
The last leg helps to paint the picture of what the market is doing now. The most recent market conditions formed by the latest active key players. By observing their game and looking at it from this perspective helped me to determine the trends.
By observing the retraced % value against the last leg, a few hypothesis could be made.
1. If the F8 reaction % value increases/decreases, the force behind price is strengthening and the chart gaining momentum in a given direction, (aka: lower highs | higher lows).
2. Strength of market, as price is held to the upper bracket forcing the price higher, would indicate strong buyers. If the price is held at the lower bracket forcing price lower.
3. The opportunity to DCA decreases and later in the chart nearly impossible - depending on account balance.
4. The retraced position forms the MSS (market structure shift), or BOS (break of structure). BOS confirms strength in the current trend, while MSS warns of a possible reversal and new trend forming.
More-on F8
Reaction %, vs normal Trend Statistic Analysis, vs key entries
0% = Double tops or bottoms. Meaning, price bounced at an exact location at 0%. For beginners the Key Entry to enter the trade.
30% < or < 70% < Premium/Discount zones, momentum starts to build confirming the movement and also safe to enter the markets with SL just below the 0%.
40%/60% = Golden Pocket depending on sell/buy, or how you draw'em. You comfortable with the risk, know that these give greater results.
50% = You now need to know what you are doing...
The nice thing about momentum would be that the more people notice the new trend forming, the more likely they would jump in trying to try and catch the current move of the market and this would ultimately push the price further in any given direction.
Now unto the chart.
So, to define the early beginnings of momentum, we start observing the change in trend. The trend always starts with the lowest low (LL), or HH (highest high) depending which side the new leg is forming (opposite of the external leg). From this point we observe the next price reaction during the retrace and bounce against the last leg. We expect an increased new value, thus comparing the F8 position of the lowest low (LL) and higher low (HL) for LONG/BUY, or HH (highest high) to LH (lower high) for SHORT/SELL. Whenever a higher low (HL) or lower high (LH) is formed, we draw a new leg but interestingly the retrace % value increases as the markets keep pushing higher with force and momentum is gained.
In this chart the F8 .1 is drawn at the bottom, and .0 is positioned at the location of the last leg up, highlighting the retrace % value during a retracement.
So you want to get the maximum profit from any given trade, but that would mean that your profit margin would continue to increase. Logically, who would take 10% if they could make initially 25%? There would be a buffer, like a trailing SL but calculated differently as price increases. If the markets do hold and continue, who would rejoin and re-entering the markets again pushing the price even further.
In the world of DCA, you should have high volatility, but with leverage and sizing it becomes tricky and you perhaps "have one shot" . The outcome of this COIN reached just over 70% before retracing, and when it did retrace returned to +-2% of the original position around 25 days.
This technique may be tedious to continually draw the K8 on the last leg, especially as new higher highs or lower lows are formed, whereby one need to look at the new retrace % value and calculate if it would exceed that of the previous retrace value. Think this is where MSS and BOS would help, as it would be the same position.
If you are following the trend, you have a position working for you, then following with a SL (stop-loss) at the last formed MSS or BOS would be safe for greater profits.
If the trend isn't your friend, notice the trends shifting with momentum and be GON!!!
This isn't f inancial or trading advice, rather an interesting phenomenal aspect which helped me understand the usefulness of the F8 tool during any trade. Also do not promote any DCA strategies.
Hope that you had fun reading this article.
Wasn't myself in this particular trade, just taking a previous lesson learned from this COIN and seeing the relevance all around in the markets.
Welcome for correction, proper acronyms/abbreviations and any comments.
EPICUSDT.P trade ideas

EPIC/USDT — Post-Breakout Distribution & Key Decision Levels!
🔎 Chart Summary
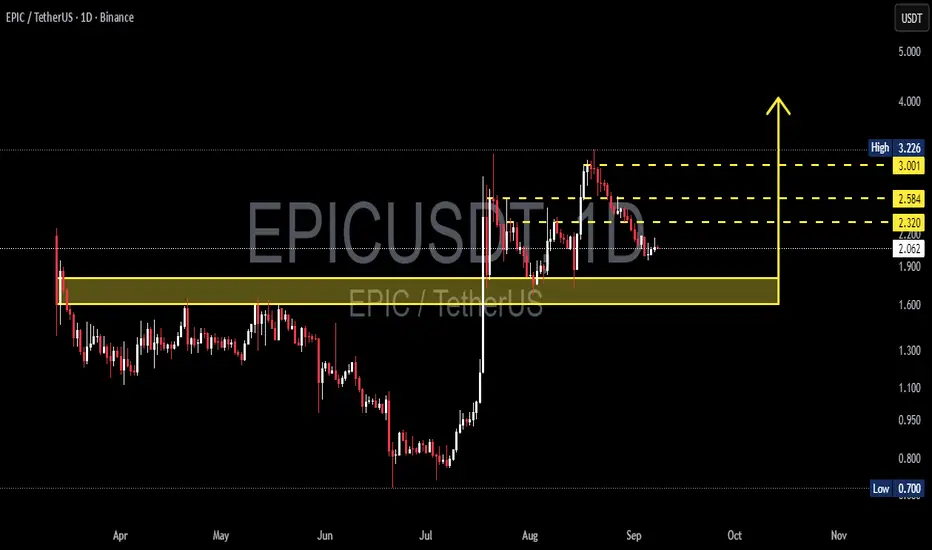
EPIC/USDT is currently in a distribution phase after a strong parabolic rally during mid-July – August. After hitting a local high of 3.22, price started forming lower highs, showing gradual selling pressure, and is now trading around 2.06.
The key battleground lies in the 1.55–1.75 demand zone (yellow box) — this zone will decide whether price consolidates for another leg up, or breaks down for a deeper correction.
---
🔑 Key Technical Levels
Current Price: 2.065
Immediate Resistances: 2.320 → 2.584 → 3.001 → 3.226 (High)
Major Support (Demand Zone): 1.55 – 1.75
Extreme Long-Term Support: 0.700 (historical low)
---
📌 Pattern & Market Structure
Pre-rally phase: Sideways accumulation (March – June) around 1.0–1.7.
July → August: Parabolic breakout with massive impulse.
After the pump: Market entered distribution/sideways range between ~1.9–3.2, with multiple rejections near 3.0+.
Current daily candles show lower highs, indicating weakening bullish momentum.
Overall, the setup resembles a distribution range rather than a clean bullish continuation, leaving the market in a neutral-to-bearish bias unless confirmed otherwise.
---
🟢 Bullish Scenario
Confirmation: Daily close above 2.32 + successful retest as support.
Targets:
TP1: 2.58
TP2: 3.00
TP3: 3.22 (previous high)
Invalidation: Daily close back below 1.95 or breakdown under 1.75.
Reasoning: Breakout above 2.32 signals buyers regaining control, opening room to retest major resistance zones.
---
🔴 Bearish Scenario
Confirmation: Daily close below 1.90, followed by a breakdown of the 1.55–1.75 demand zone.
Targets:
TP1: 1.20–1.10
TP2: 0.70 (in case of a full capitulation)
Invalidation: Price regains 2.32 with strong volume confirmation.
Reasoning: Failure to hold the demand zone confirms distribution phase is over, leading into a markdown phase.
---
📈 Strategy & Risk Management
Use 2.32 (resistance) and 1.75 (demand zone) as decision points.
Wait for confirmed breakout/retest before entering — avoid chasing price.
Risk only 1–2% per trade and size positions accordingly.
Use partial take-profit strategy: lock gains at 2.58, let runners ride to 3.0+.
Always track volume: weak breakouts without volume = high risk of false moves.
---
🧩 Conclusion
EPIC/USDT is at a critical crossroads:
Holding above 1.75 and breaking 2.32 would trigger a bullish continuation towards 2.58–3.00.
Losing the 1.55–1.75 demand zone could drag the market back to 1.20 or even 0.70.
This is a decisive moment for swing traders and mid-term investors to watch closely.
---
#EPIC #EPICUSDT #CryptoAnalysis #Altcoin #SwingTrading #TechnicalAnalysis #CryptoBreakout #PriceAction #SupportResistance
Potential BuyThe closing of the current candle which is similar to an inverted hammer candle is only going to be more powerful if it closes with that structure.
The expected take profit(TP) or safest being 3.171 and the ultimate (TP) 3.728 .

EPIC .. come onOnce resistance is broken, it will be beautiful... $4+
You don't have to believe it...
It has been rising nicely since the beginning of this month, now it is consolidating and one more candle

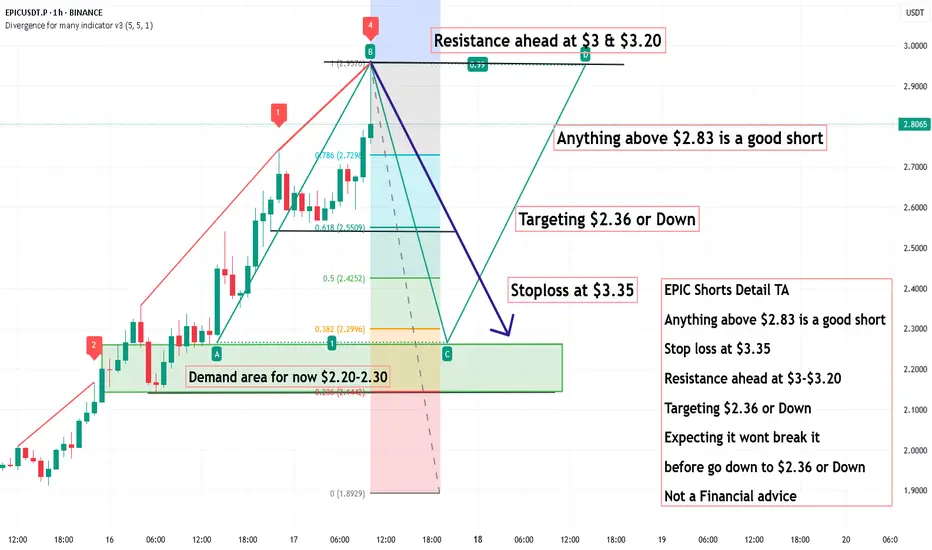
EPIC Shorts Detail TA, Anything above $2.83 is a good short EPIC Shorts Detail TA
Anything above $2.83 is a good short
Stop loss at $3.35
Resistance ahead at $3-$3.20
Targeting $2.36 or Down
Expecting it wont break it
before go down to $2.36 or Down
Not a Financial advice
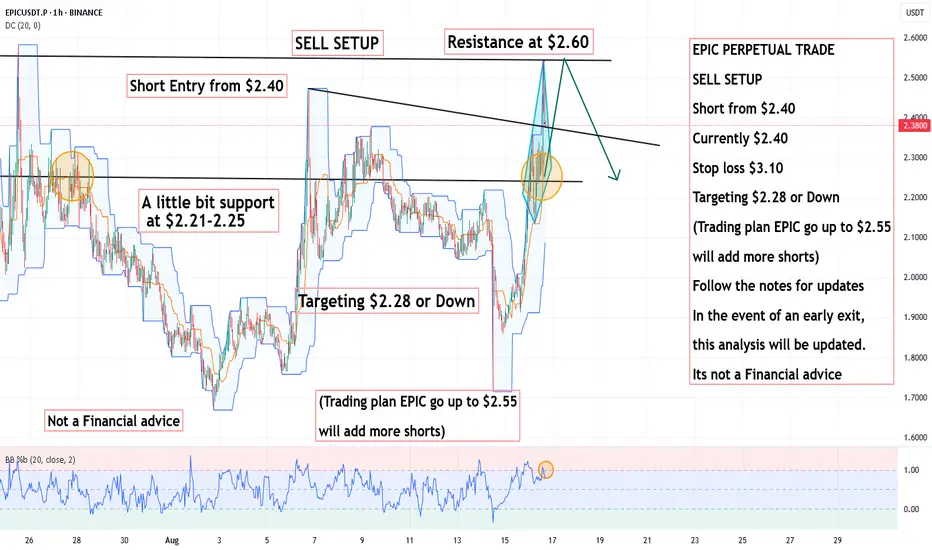
EPIC PERPETUAL TRADE ,Short from $2.40EPIC PERPETUAL TRADE
SELL SETUP
Short from $2.40
Currently $2.40
Stop loss $3.10
Targeting $2.28 or Down
(Trading plan EPIC go up to $2.55
will add more shorts)
Follow the notes for updates
In the event of an early exit,
this analysis will be updated.
Its not a Financial advice
EPICUSDT Forming Bullish PennantEPICUSDT is currently displaying a well-defined bullish pennant pattern, which typically signals the continuation of a strong upward trend following a consolidation phase. The price action has tightened within converging trendlines after a sharp upward movement, suggesting that the market is gathering strength for the next breakout. This pattern, combined with consistent volume, indicates growing interest and positioning by market participants who are anticipating a fresh rally.
The volume profile remains supportive, with healthy activity during the consolidation zone. This is often a sign of accumulation by informed investors. A breakout above the pennant resistance could confirm a bullish continuation, targeting a potential gain of 30% to 40% from current levels. The current structure also aligns with broader bullish sentiment across the altcoin sector, adding confidence to the upside potential of EPICUSDT.
Furthermore, the EPIC project is gradually attracting attention within the crypto space, with investors showing increasing interest in its long-term prospects. As momentum builds, technical traders are closely watching this setup for a breakout opportunity. The convergence of strong technicals and community sentiment makes this pair worth monitoring in the coming sessions.
✅ Show your support by hitting the like button and
✅ Leaving a comment below! (What is You opinion about this Coin)
Your feedback and engagement keep me inspired to share more insightful market analysis with you!

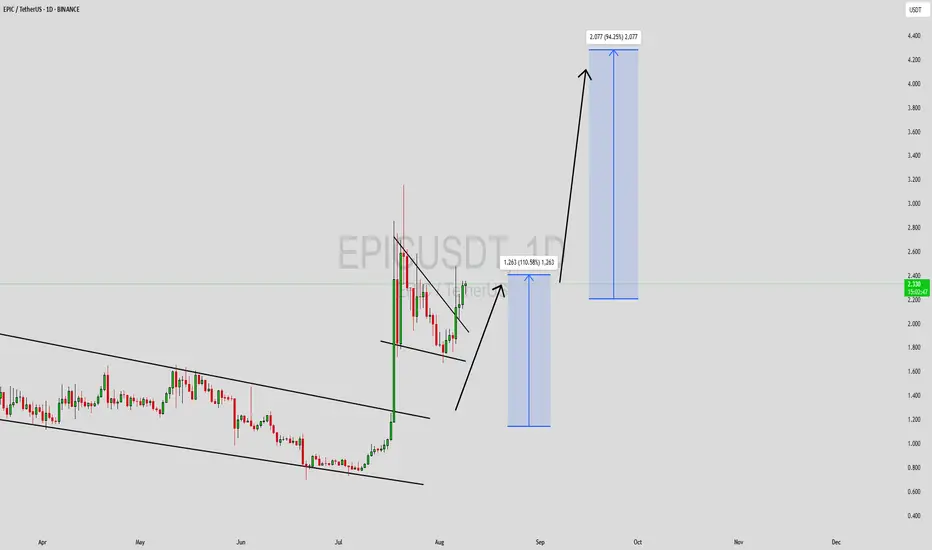
EPICUSDT Forming Bullish PennantEPICUSDT is currently forming a bullish pennant pattern, a strong technical signal that often precedes major upward breakouts. This structure typically emerges after a sharp price rally, followed by a period of consolidation, and is considered a continuation pattern. The tight price action within the pennant and the controlled pullbacks suggest that bulls are maintaining momentum while sellers are losing strength. As volume remains consistent, this setup points to a possible explosive move to the upside once a breakout occurs.
The projected move for EPICUSDT is particularly promising, with expectations of a 90% to 100% gain based on the current technical framework. A breakout from the upper trendline of the pennant could serve as a key entry trigger for both short-term traders and long-term investors. With price action coiling tighter and showing bullish bias, the breakout may come sooner rather than later. A move past resistance zones could quickly accelerate due to reduced overhead supply.
Investor interest in EPIC is steadily growing, as seen in recent on-chain activity and community engagement. The project has captured attention for its fundamentals, use-case potential, and increasing visibility in the crypto market. This makes EPICUSDT not only a technical trade opportunity but also a fundamentally supported play, aligning with both chart-based and narrative-driven strategies.
✅ Show your support by hitting the like button and
✅ Leaving a comment below! (What is You opinion about this Coin)
Your feedback and engagement keep me inspired to share more insightful market analysis with you!

EPICUSDT.P LONGThe price broke down the symmetrical triangle but we will not plan for short as we are already long biased so we will only look a good place to buy. Until the price retest the triangle bottom with a bearish candle and strong volume.
Why I planned this trade? As we all know we are already in a kind of bull run and this is most probably a fakeout and i think price will bounce back from our entry point.
Lets wait and watch only trade when see any bullish candle and bullish momentum at our entry level.
Follow me and support me please.

EPIC WAITING FOR BIG MOVEThe EPIC cryptocurrency is awaiting a pivotal moment for a breakout. A range-bound and volatile pattern has formed, and we wait till to know what the outcome will be.
Important levels are shown on the chart."

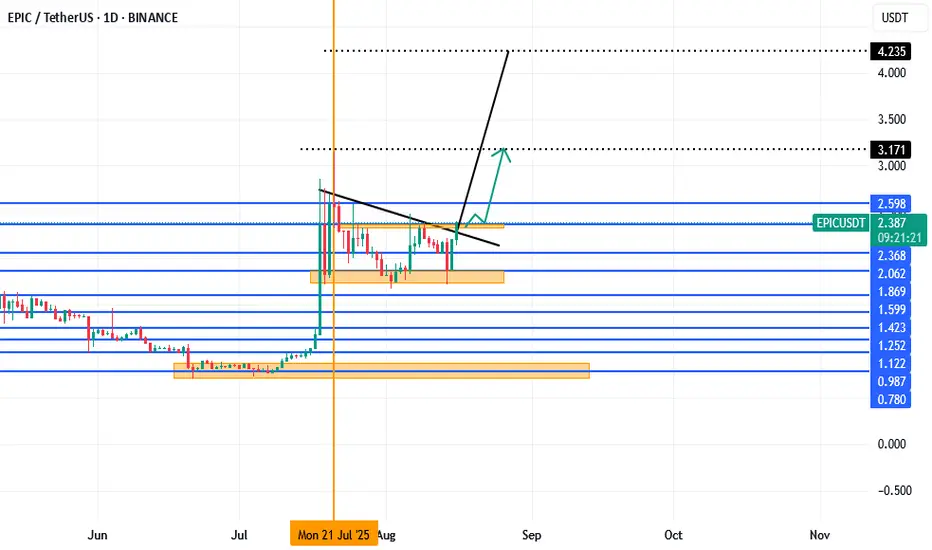
Epic Dual BUY ApproachEpic has two buy perspectives that one can choose which specific one they are more comfortable with.
The first :
- W formation that starts from the orange vertical line and the ideal point on entry would be at 2.368 once price retest for the cautious trader or once price breaks through that support level.And the take profit at 3.171.
The second :
- Bullish Wedge that is clearly visible and the ideal entry point was the candle that retested the diagonal resistance trendline but one can take a BUY now and your take profit will be at 4.235.
EPICUSDT Forming Bullish PennantEPICUSDT is showing an exciting setup with the emergence of a bullish pennant pattern, which typically signals a strong continuation move to the upside. After a solid upward leg, the price has been consolidating within a narrowing range — a classic sign of bulls gathering momentum for the next breakout. This pattern, when supported by volume and market structure, often leads to sharp gains, and EPICUSDT looks poised for such a scenario.
Volume remains consistently good, further validating the strength behind this pattern. Sustained buying interest indicates that larger market participants are actively positioning themselves ahead of a potential breakout. If EPICUSDT breaks out from this consolidation zone, we could see a rapid price movement, with expectations targeting an 80% to 90%+ gain in the near to mid-term.
Investor sentiment is also turning increasingly bullish, with more traders beginning to recognize EPICUSDT’s potential. The asset is gaining traction as a speculative yet technically sound opportunity. If broader market conditions stay favorable, this bullish pennant could be the launchpad for a substantial upward rally.
✅ Show your support by hitting the like button and
✅ Leaving a comment below! (What is You opinion about this Coin)
Your feedback and engagement keep me inspired to share more insightful market analysis with you!

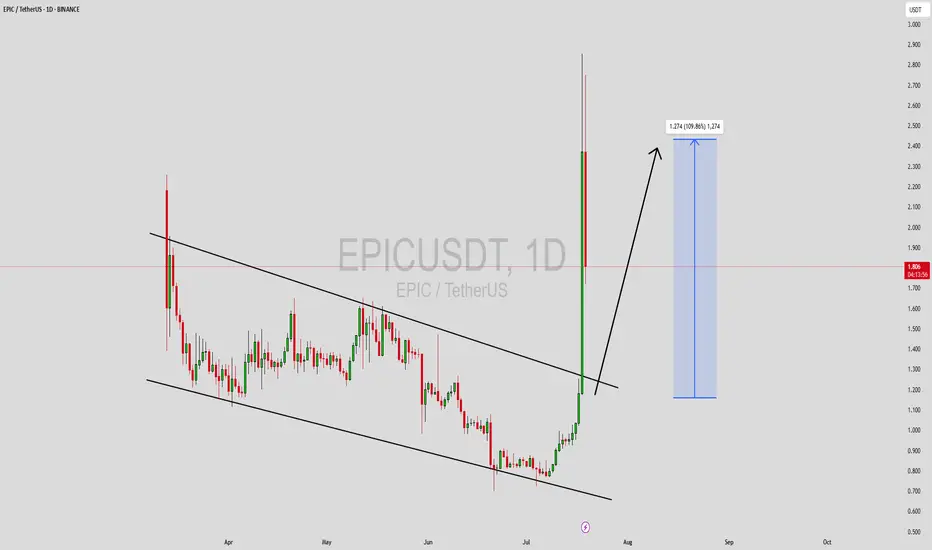
EPICUSDT Forming Falling WedgeEPICUSDT is carving out a textbook falling wedge pattern, a highly reliable bullish reversal setup that often signals a sharp breakout once selling pressure subsides. As price action contracts within converging trendlines, it reflects diminishing bearish momentum and growing interest from buyers. With volume remaining healthy throughout this phase, the conditions are aligning for a breakout that could lead to an impressive 80% to 90%+ gain.
This pattern gains credibility from its formation at the lower end of a broader downtrend, suggesting that early accumulation may already be underway. Traders familiar with wedge breakouts will note that confirmation from a strong bullish candle breaking above the upper trendline would be a powerful entry signal. If followed by continued volume engagement, this move could gain rapid traction.
Investor sentiment toward this project is also strengthening, adding a layer of narrative support to the technical setup. Rising engagement from both retail and larger market participants points toward renewed confidence in the project’s fundamentals. A successful breakout could therefore become a magnet for additional inflows, potentially amplifying the upside move.
For breakout-focused traders and technical enthusiasts, EPICUSDT presents a compelling risk-reward opportunity. Watch closely for a confirmed breakout above the wedge boundary—if it materializes, it may mark the beginning of a significant mid-term rally.
✅ Show your support by hitting the like button and
✅ Leaving a comment below! (What is You opinion about this Coin)
Your feedback and engagement keep me inspired to share more insightful market analysis with you!
EPIC : Risky signal...Hello friends🙌
🔊Due to the good price growth, we have found important support points for you.
Now, due to the price correction, we have found buy points for you and you can buy with risk and capital management and move with it until the goals we have set for you.
🔥Follow us for more signals🔥
*Trade safely with us*

EPIC Battles Key Trendline After Dual Structure Shift⏱️ On the 2H chart, CSE:EPIC recently broke out of a descending channel ✅—a bullish signal in the short term.
However, momentum stalled right at the lower boundary of a larger symmetrical triangle ❌, where price is now facing rejection.
This zone is pivotal — reclaiming the triangle could spark another leg up, while continued rejection might drag price lower once again.
👀 A tight setup with conflicting signals — watching this one closely.
Will the bulls regain control or does downside pressure take over?
Not financial advice. BINANCE:EPICUSDT

EPIC/USDT 1H Setup – Bearish Flag Breakdown Incoming? We’re currently observing EPIC/USDT on the 1-hour chart, and the price action is following a classic bearish structure.
🔹 The trend remains strongly bearish overall.
🔹 The market is currently in a retracement phase, forming a new Lower High (LH).
🔹 A clear bearish flag pattern has formed, typically signaling continuation to the downside.
🔹 Once price breaks the Lower Low (LL) support, we expect bearish momentum to resume.
📌 Trade Setup Breakdown:
Pair: EPIC/USDT
Timeframe: 1H
Trend: Bearish
Divergence: None
Pattern: Bearish Flag
Bias: Bearish
Strategy: Sell Stop at LL Breakout
🔻 Entry Price (EP): 1.662
🔴 Stop Loss (SL): 1.938
🟢 Take Profit (TP1): 1.386
⚖️ Risk:Reward Ratio: 1:1
💼 Why This Setup Works:
✅ Clear bearish flag within a downtrend
✅ Retracement forming Lower Highs — classic continuation structure
✅ Breakout of LL confirms bearish momentum
✅ Clean risk-to-reward structure with tight SL and precise TP
💬 What’s your take on EPIC/USDT?
Do you see the same continuation forming? Share your thoughts below 👇
🔔 Don’t forget to follow me for more clean, high-probability trade setups, patterns, and price action plays. Let’s trade smart together! 💹
#EPICUSDT #CryptoTrading #BearishFlag #PriceActionSetup #CryptoAnalysis #1HChart #TrendContinuation #TechnicalSetup #TradeSmart #CryptoSignals #BearishStructure #SellSetup #RiskReward #TradingStrategy #ChartPatterns #BreakoutTrade #CryptoBearish #TradingViewIdeas #CryptoTraders #TradeWhatYouSee #SmartEntry #SwingTradeCrypto #CryptoCommunity #AltcoinAnalysis

Epic Chain to $19.00Epic Chain rallied two weeks ago, surpassing all resistances. We may see sideways movement and another pump to the previous high of $19.00

EPICUSDT Forming Descending ChannelEPICUSDT is currently trading within a well-defined descending channel pattern, which typically represents a period of consolidation before a breakout to the upside. This pattern is characterized by lower highs and lower lows, often indicating a temporary pullback in a larger bullish structure. As the price nears the bottom of the channel and begins to show signs of strength, many technical traders view this as a prime area for accumulation. With rising volume and renewed interest, EPIC may soon break above the channel resistance, initiating a strong bullish reversal.
Historically, descending channels have preceded major rallies when supported by increasing volume and bullish sentiment. The recent price action in EPICUSDT shows early signs of such a reversal. The asset has tested key support levels multiple times without breaking lower, which strengthens the argument for a bottom being formed. If the breakout confirms, the technical projection suggests a potential gain of 90% to 100%—a target that aligns with prior resistance levels and Fibonacci retracement zones.
EPIC is gradually gaining attention from the crypto community and investors alike, particularly due to its unique positioning in the altcoin space. As fresh capital flows into high-potential small caps, coins like EPIC can experience exponential growth. With DeFi, privacy, or utility-based narratives driving demand, EPIC could benefit from a wave of interest as market momentum shifts back in favor of altcoins.
✅ Show your support by hitting the like button and
✅ Leaving a comment below! (What is You opinion about this Coin)
Your feedback and engagement keep me inspired to share more insightful market analysis with you!
Epic to the moonEpic just reach fibo 1.618 and tested fibo 1 just now..
Time to heading to fibo 2.
Next tp is 3.16

Epic Chain 212% Move Mapped —The 2025 Altcoins Bull MarketThe altcoins market bull market is fully confirmed and this confirmation comes as soon as Bitcoin hit a new all-time high. When Bitcoin is strong, bullish yet sideways, the altcoins market tend to grow. The altcoins are growing now, some pairs growing three digits within hours and that's because Bitcoin continues to consolidate near resistance. This same dynamic will only strengthen and is set to continue for months.
Epic Chain (EPICUSDT) already hit bottom and is ready to grow. Here we have a very easy 125% target, a fast, strong and easy bullish wave. It is likely to go way beyond this target but this is based on the short-term. It will go beyond because the altcoins are producing over 50% in their first hour or two of the initial bullish breakout. More than 100% within days and the potential for the entire bull market will be 20-30X on average.
You've been warned. This is a friendly reminder.
Prepare and maximize profits. Do whatever it is necessary to make the most of this opportunity, it only happens once every four years. This is the 2025 bull market bullish momentum building up. Just as promised. You will be happy with the results.
Namaste.

Epic scalp short to $1.4778 areaJust now opened a scalp short position on epic. Targeting $1.4778 area for a 2RR approximately.
My stop is $1.5548

Epic pump to $1.58 today!Gm
Just went long on Epic/usdt.
Anticipating an epic pump to $1.58 area
Roughly 4RR
1.4299 stop or lower

EPIC New Update (8H)EPIC appears ready for a rejection to the downside and a drop.
Maintaining the supply zone, it could drop further.
The marked demand zone could potentially reject the price back upward again.
Do not enter the position without capital management and stop setting
Comment if you have any questions
thank you
