US 100 Index – NVIDIA Earnings and September Payrolls To Keep TrNovember has been a choppy and volatile period for the US 100 index. After opening the month with a push to a high of 26154 on November 1st concerns about lofty valuations of AI companies, more hawkish than expected Federal Reserve speakers and a US government shutdown have all combined to weaken prices which has seen the index twice dip and recover from support at 24608 (more on this in technical update below).
Now looking forward, sentiment towards technology stocks is going to face potentially its toughest test so far with the release of AI bellwether NVIDIA’s earnings after the close on Wednesday, which is closely followed by the delayed September US Non-farm Payrolls report on Thursday.
Expectations for NVIDIA’s results are high, with Reuters reporting analysts on average expecting the company to post a 54% year-on-year rise in Q3 earnings per share, with optimism for future revenue being driven higher by recent chip supply deals the company has announced with a string of companies such as Samsung. NVIDIA carries a huge 10% weighing in the US 100 index so these results could have a big impact on the direction of prices into the weekend, perhaps even further.
The reopening of the US federal government last Thursday has restarted the release of key economic data updates on the labour market and inflation. The Bureau of Labor Statistics (BLS) has confirmed the September Non-farm payrolls report, originally due in early October, will now be released on Thursday November 20th at 1330 GMT. This update could be important for traders as they try and work out whether the US labour market has weakened enough for Federal Reserve policymakers to be swayed to cut interest rates by 25bps (0.25%) again at their final meeting of the year on December 10th. Recent commentary from Fed speakers has been more hawkish than expected by markets only a month ago, so there may be an extra level of US 100 price sensitivity to the outcome of this release on Thursday.
US 100 Index Technical Update: 24608 Support Holds Again
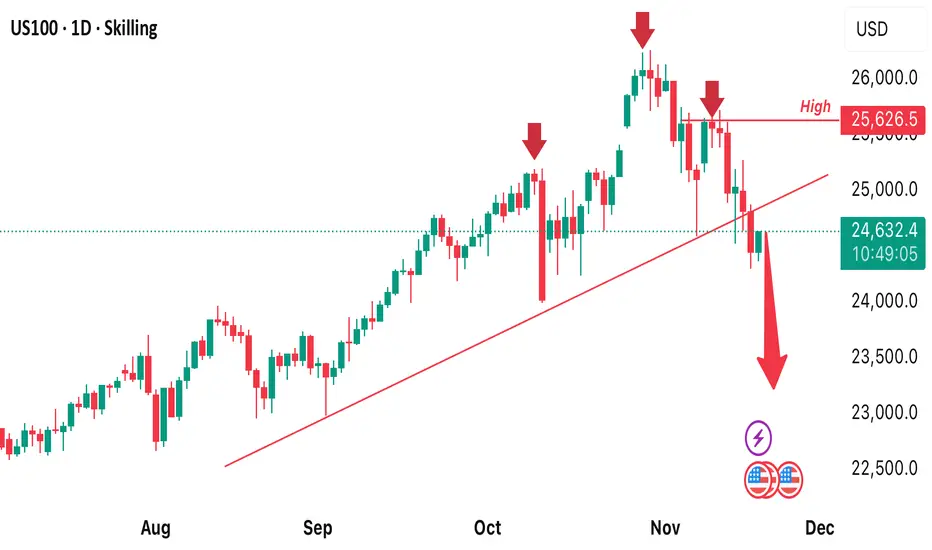
Last week’s US 100 activity began with price strength on Monday, but this quickly reversed, seeing a retreat of nearly 5% into Friday’s low at (24542, November 14th). Importantly, that decline tested support at 24608, which is the 50% Fibonacci retracement of the August to October advance. This level holding last week maintains potential for prices to stabilise to begin the new week.
Interestingly, a similar rally emerged the previous Friday (November 7th) following tests of the same 24608 retracement support, reinforcing the possibility that buyers are currently still active around this area. While not a guarantee of future price strength, with this level now limiting selling pressure on 2 occasions, this may be viewed as the first important support level for traders to focus on this week.
Potential Support Levels:
With 24608 established as a potential support, closing breaks below this level might be needed to suggest renewed downside pressure, leading to a further phase of price weakness.
A close below 24608 if seen, could then turn the focus toward 24221, which is the deeper 61.8% Fibonacci retracement, with the possibility for extension of price declines to 24004, which is the October 10th session low, increasing if this 24221 support level were to give way.
Potential Resistance Levels:
If 24608 continues to hold selling pressure, fresh attempts at price strength might result. However, it could prove to be the still rising Bollinger mid‑average at 25490 that marks an initial resistance level, with a close above this level needed to suggest risks for the possibility of fresh upside momentum.
If the 25490 mid‑average does give way to the upside on a closing basis, renewed price strength could be the result. Such moves may then open scope for tests of 25742, the November 12th session high, and possibly toward 26277, the October 30th all‑time high.
The material provided here has not been prepared accordance with legal requirements designed to promote the independence of investment research and as such is considered to be a marketing communication. Whilst it is not subject to any prohibition on dealing ahead of the dissemination of investment research, we will not seek to take any advantage before providing it to our clients.
Pepperstone doesn’t represent that the material provided here is accurate, current or complete, and therefore shouldn’t be relied upon as such. The information, whether from a third party or not, isn’t to be considered as a recommendation; or an offer to buy or sell; or the solicitation of an offer to buy or sell any security, financial product or instrument; or to participate in any particular trading strategy. It does not take into account readers’ financial situation or investment objectives. We advise any readers of this content to seek their own advice. Without the approval of Pepperstone, reproduction or redistribution of this information isn’t permitted.
Trade ideas

NASDAQDO YOU KNOW WHATS BEHIND THIS OR OTHER IDEAS?? in bio..
Preferably suitable for scalping and accurate as long as you watch carefully the price action with the drawn areas.
With your likes and comments, you give me enough energy to provide the best analysis on an ongoing basis.
And if you needed any analysis that was not on the page, you can ask me with a comment or a personal message.
Enjoy Trading ;)

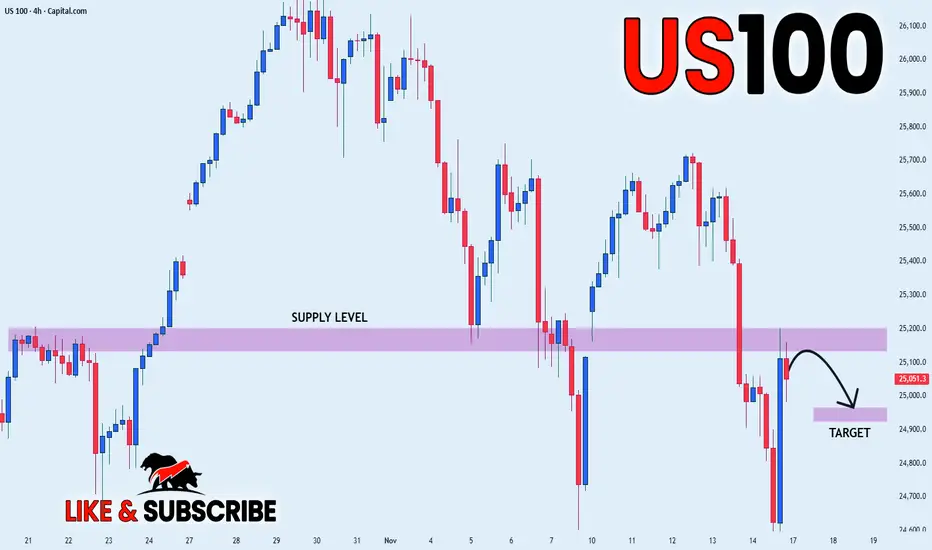
US100 LOCAL SHORT|
✅US100 price rejects the supply block and forms a clean displacement lower, hinting at a draw on liquidity toward the inefficiency below. A corrective retrace before targeting the marked zone is likely. Time Frame 4H.
SHORT🔥
✅Like and subscribe to never miss a new idea!✅
NDX today is the day.🚀 Today is the day that marks a before and after. ⚡️🔥
We haven’t even tasted true tech-sector FOMO yet — not even close.
Right now we’re sitting in the same extreme fear zone we saw back in early April…
and you know exactly what happened next. 😉
Google is leading the charge, showing the path the entire index is meant to follow.
And tonight, NVIDIA provides the fuel ⛽🔥
The rest of the market will move to its rhythm — like an orchestra waiting for the conductor.
Make no mistake:
🎄🚀 A massive Christmas rally is coming.
The kind that leaves you speechless.
The kind people remember for years.
The kind that turns disbelief into FOMO… and FOMO into vertical candles.
Buckle up.
The real move is just beginning. 😉
🔥🚀📈
#TechRally #NVIDIA #GoogleLeading #FearToFOMO #SantaRally #MarketShift #NextLegUp

NAS100 8H - real correction or just another dramatic rehearsal?NAS100 held the 24850–25000 demand zone with precision, forming a classic false break followed by a sharp recovery back into the rising channel. Volume expansion on the reversal, strong lower wicks, and sustained support at the dynamic trendline all signal that the medium-term bullish structure remains intact. The path toward 26300 inside the channel stays open, and a breakout above this level unlocks the next target at 27300 - the upper boundary of the current impulse.
The NAS100 index represents the core of the US tech sector, reflecting demand for IT, cloud infrastructure, AI technologies, communication platforms, and high-growth digital companies.
Fundamentally , the backdrop on November 15 strengthens the bullish case: the market continues to price in a softer Fed stance, bond yields are easing, major tech companies are raising guidance, and demand for AI-driven solutions remains stable. With inflation trending into a manageable range and expectations for improved credit conditions rising, liquidity is rotating into high-beta assets, providing structural support and limiting corrective depth. Strong margins, solid earnings and resilient tech demand continue to anchor the broader uptrend.
As long as price holds above 24850–25000, the bullish scenario remains active. A confirmed breakout above 26300 opens the way toward 27300. Any controlled pullback into 24850–25000 remains a buy zone within the prevailing trend.
NASDAQ likes to overact, but more often than not it’s simply warming up before the next performance.

NAS100 Trade Set Up Nov 18 2025Price is still showing bearish pressure making LL/LH in the 1h and 15m but first id like to see BSL swept followed by IFVG/CISD on the 1m-5m before looking for sells back down to lower SSL levels

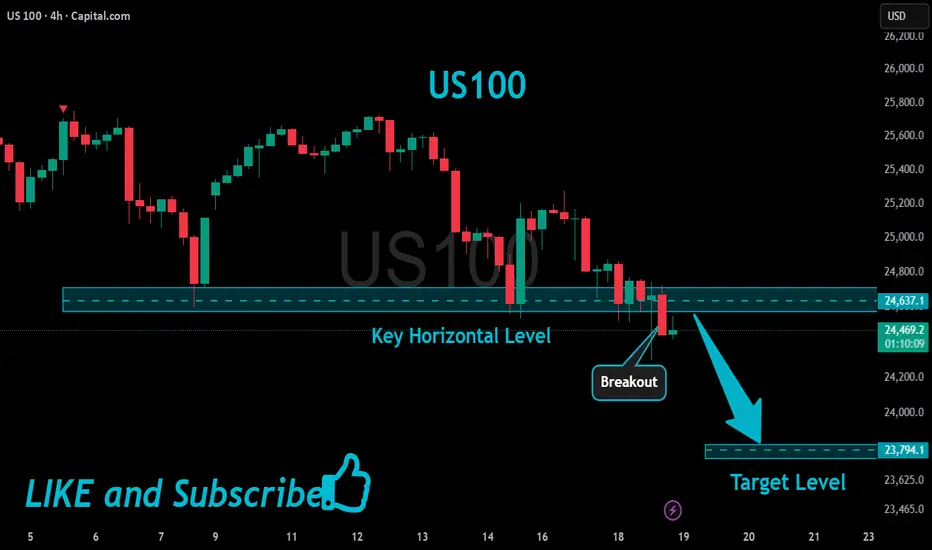
US100 Will Keep Falling!
HI,Traders !
#US100 keeps falling down
And made a strong
Bearish breakout of the key
Horizontal key level of 24637.1
And the breakout is confirmed
So we are bearish biased and
We will be expecting a further
Bearish move down !
Comment and subscribe to help us grow !
NAS100 Trade Set Up Nov 19 2025Price is still overall bearish on the 4h and daily but price just broke structure on the 1h so i would want to see a sweep of SSL, close above and internal IFVG/CISD to target PDH/BSL

SIGNS OF WEAKNESS ON NASNAS100 1H - This pair is showing signs of weakness, it looks as though price is respecting these areas of Supply and is continuing to trade us lower. We have also been delivered with a higher timeframe break to the downside.
This is indicating further bearishness in this market, I would personally be looking for short temporarily with this pair, as you can see price is approaching an area of Supply now, this could act as an entry point.
We need to wait for price to trade in, clear this area and give us some kind of entry confirmation before getting involved. We would need to see price break structure to the downside before taking us lower.
I have set an alert and will keep you all updated on whether or not I vet a valid short entry for this pair moving forward, its important we treat this pair with caution.

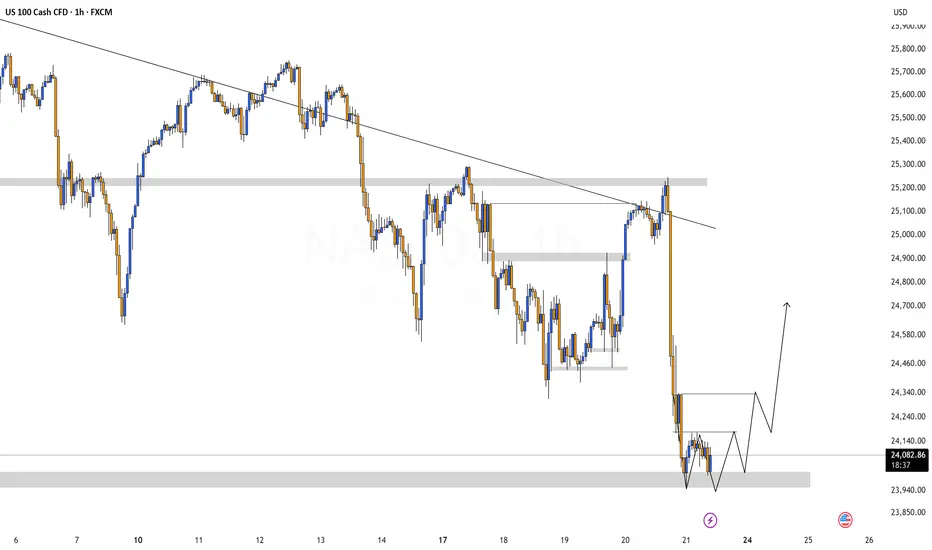
Long Opportunity on NAS100Any thought on this NAS100 setup? The double bottom was formed on 1hr timeframe and broke the neckline. Looking for the long opportunity after any confirmation of this retest at the neckline

US100 DAILY CHARTNASDAQ100 has a tendency to make a new low. We can see how price has been bearish for couple of days now. I expect price to drop lower therefore, a sell opportunity is envisaged
NASDAQDO YOU KNOW WHATS BEHIND THIS OR OTHER IDEAS?? in bio..
Preferably suitable for scalping and accurate as long as you watch carefully the price action with the drawn areas.
With your likes and comments, you give me enough energy to provide the best analysis on an ongoing basis.
And if you needed any analysis that was not on the page, you can ask me with a comment or a personal message.
Enjoy Trading ;)

Nasdaq Slips as Traders Brace for Nvidia EarningsUSNAS100 | Overview
Traders remain firmly in risk-off mode as concerns grow over stretched AI and tech valuations ahead of Nvidia’s earnings, set for release after tomorrow’s market close.
Nvidia shares are already down about 1% in premarket trading, reflecting cautious sentiment across the tech sector.
At the same time, investors are watching for the resumption of key U.S. economic data, including the jobs report due Thursday, after recent shutdown-related delays.
There is growing worry that incoming data may discourage the Fed from delivering further rate cuts, adding pressure to equity markets.
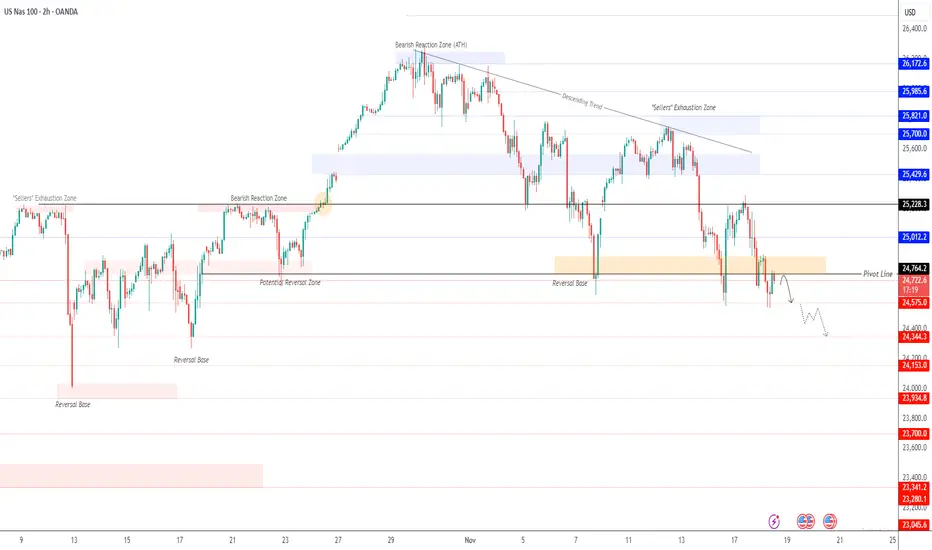
Technically:
USNAS100 continues to trade under bearish pressure, and as long as the price remains below 24760, the downtrend is expected to continue toward 24575.
A break below 24575 would open the next bearish targets at 24340 and 24150.
To shift into bullish movement, the index must close a 1H candle above 24880, which would signal a rebound toward 25010 and 25230.
Key Levels
Pivot Line: 24760
Support: 24575 · 24340 · 24150
Resistance: 24880 · 25010 · 25230

NASDAQ 100 Buy Bias 18/11/2025.
Price is currently trading on the Previous Week Lows, 240 TF low, and Daily Low.
With rejection on the hourly timeframe, break of structure on the 15M and equal lows we can anticipate for a buy.

NASDAQ NASDAQ can start a bullish move from the price zones of 24,767 or 24,682 toward 25,200. However, the 24,530 level is highly critical. NASDAQ:NDX

NASDAQ Analysis – Recovery Expected After an Overextended DropYesterday’s sharp Nasdaq drop was surprising, especially considering Nvidia’s exceptional earnings, renewed confidence that we’re not in a bubble, and the strong labor data from NFP. Under normal conditions, the market would likely have reacted with a 2%+ rally.
However, investors are now pricing in the idea that the Fed will not cut rates in December, which created fear-driven selling and an exaggerated move to the downside.
Today, I would like to see a relief recovery, as the index has started to form a double-bottom pattern, a typical structure before liquidity grabs to the upside. If confirmed, price could push back up to take out recent highs.
Historically, after large impulsive drops, the stock market tends to open in green, as investors take advantage of discounted prices. If momentum shifts, the Nasdaq could quickly reclaim lost ground.
Nasdaq 100 drops to a new low on the weekWhat a sell-off! The Nasdaq 100 (-2%) has now dropped almost 1,000 points from earlier high, to relinquish its entire gains related to Nvidia (-1.6%) and some to hit a new low on the week. How much more selling in there to come? Judging by price action in the crypto space, I would say a fair bit more.
By Fawad Razaqzada, market analyst with FOREX.com

NAS100 1:1.5 RRThis is a trade idea, posting for future reference
not to be taken as financial advice

Bullish signalsThe price is bouncing from 100-day EMA and VWAP from late June low on US100 chart (not on NDX though). WXY correction structure looks complete. It can still go lower to test 0.618 fib from August 1 low to top or August 13 peak. RSI shows 2h bullish divergence on all Nasdaq and S&P500 charts. A reversal to new ATH is highly probable from this area (or atleast a high bounce to draw another right shoulder).

november 17th trade breakdownhey guys in this video i broke down the strategy i use to trade the markets i hope it brings value to your journey . i also broke down the trade i saw this morning in new York session. keep in a look out for videos this week

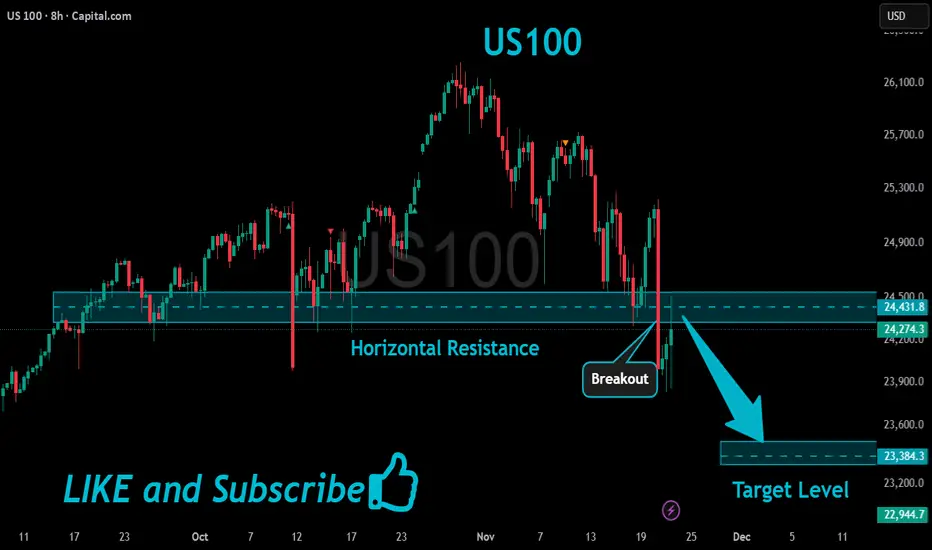
US100 Potential Short!
HI,Traders !
#US100 is making a rebound
But we are bearish biased
And after hits the
Horizontal resistance of 24431.8
We will be expecting a
Local bearish correction !
Comment and subscribe to help us grow !