US30 - DOW Hits Major Supply Reversal coming on Dow as it hits a major supply zone. This is part of a bigger cross-asset move that I am anticipating across global equities. I see a synchronised sell off in global equities coming this month.
Trade ideas

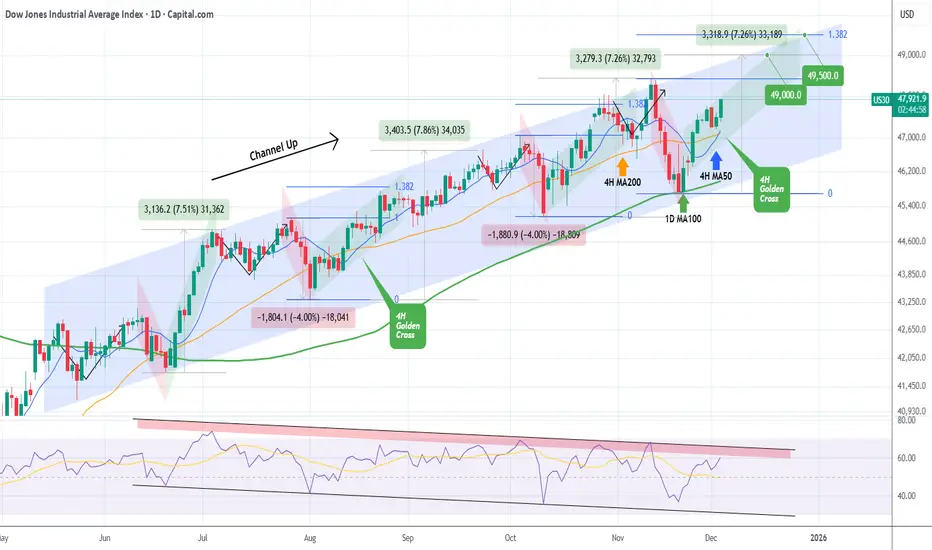
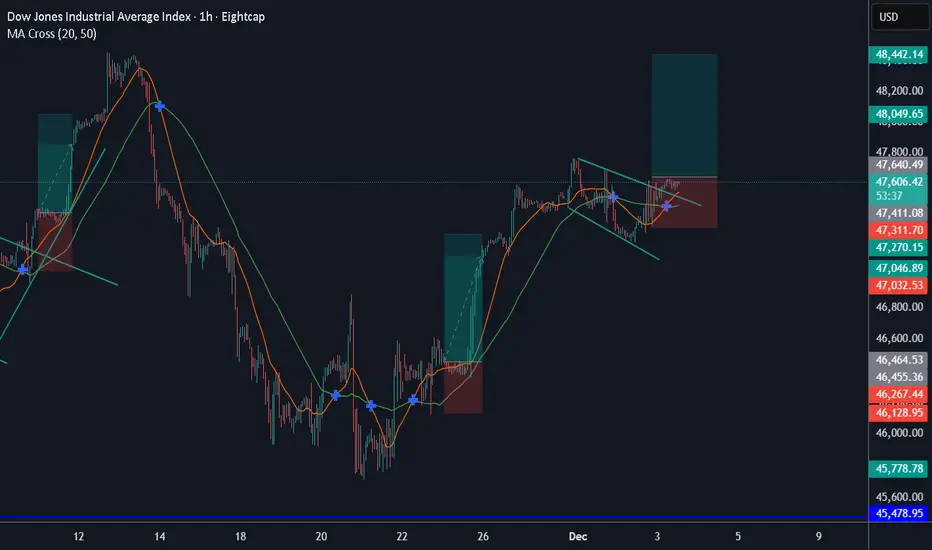
DOW JONES formed its first 4H Golden Cross since August. BullishDow Jones (DJI) has been trading within a 6-month Channel Up and today it formed its first 4H Golden Cross since August 15. Coming off a Higher Low bottom 2 weeks ago on the 1D MA100 (green trend-line), we are currently on the new Bullish Leg of the pattern.
The last one rose by +7.26%, roughly the % amount of the previous two as well, so our immediate Target remains 49000 as we've shown on last weeks analysis.
This time we also see an over-extended Target if the end-of-year rally lasts a bit longer, on the 1.382 Fibonacci extension at 49500, as this level has been hit on every Bullish Leg of this pattern.
If the 1D RSI though hits its Lower Highs Zone (red) earlier, it might be a good idea technically to book profits before those Targets are reached.
---
** Please LIKE 👍, FOLLOW ✅, SHARE 🙌 and COMMENT ✍ if you enjoy this idea! Also share your ideas and charts in the comments section below! This is best way to keep it relevant, support us, keep the content here free and allow the idea to reach as many people as possible. **
---
💸💸💸💸💸💸
👇 👇 👇 👇 👇 👇
DJI: Dow jones industrial index bear trend in makingDue to divergence on RSI and MCAD, the price will have a pull back as showed. its simple but i think it will follow my idea

Long on Dow, expecting new highs-Dow formed bellow an inverse head and shoulders pattern, after a deep correction waiting for new highs on It

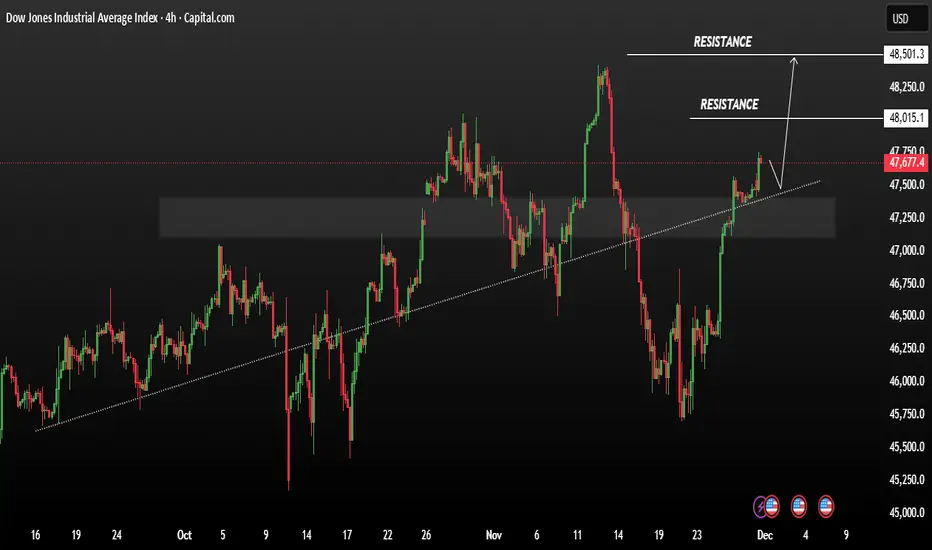
DowJones Bullish above support at 47530 Key Support and Resistance Levels
Resistance Level 1: 48132
Resistance Level 2: 48276
Resistance Level 3: 48420
Support Level 1: 47530
Support Level 2: 47366
Support Level 3: 47185
This communication is for informational purposes only and should not be viewed as any form of recommendation as to a particular course of action or as investment advice. It is not intended as an offer or solicitation for the purchase or sale of any financial instrument or as an official confirmation of any transaction. Opinions, estimates and assumptions expressed herein are made as of the date of this communication and are subject to change without notice. This communication has been prepared based upon information, including market prices, data and other information, believed to be reliable; however, Trade Nation does not warrant its completeness or accuracy. All market prices and market data contained in or attached to this communication are indicative and subject to change without notice.

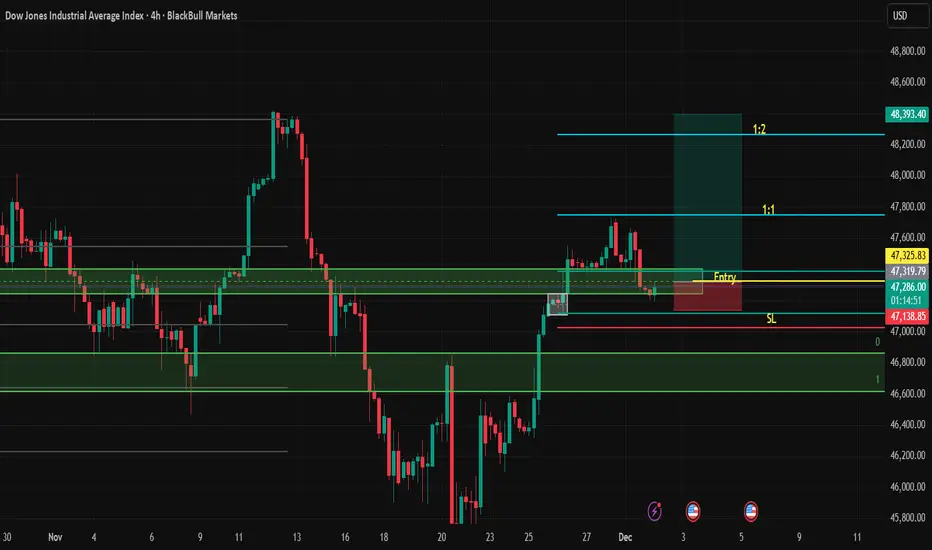
US30 Bullish Plan! Layered Entries + Clean Targets Mapped🔥 DOW JONES (US30) BULLISH PULLBACK - THIEF STRATEGY LAYER ENTRY! 🔥
📈 Asset: CAPITALCOM:US30 (Dow Jones Industrial Average CFD)
🎯 Bias: BULLISH - Strong Uptrend, MA Pullback Play
⏰ Timeframe: Day Trade / Swing
🛡️ Strategy: "THIEF LAYERING" - Multi-Level Limit Order Entry for Optimal Risk/Entry
📋 TRADE PLAN: THIEF'S LAYERED BULLISH PULLBACK
✅ CONDITION:
Bullish structure intact ✅
Price pulling back towards key Moving Average support ✅
This is a "Buy the Dip" setup for continuation.
🎯 ENTRY STRATEGY (THIEF LAYER METHOD):
Use MULTIPLE BUY LIMIT ORDERS to scale into the trade.
Suggested Layers (Adjust based on your capital):
➡️ Layer 1: 47,300
➡️ Layer 2: 47,400
➡️ Layer 3: 47,500
You can increase or decrease layers based on your own analysis.
⛔ STOP LOSS (THIEF OG's NOTE):
Initial SL: 47,200 (below key structure)
⚠️ IMPORTANT: Adjust your SL based on YOUR OWN RISK & STRATEGY. I am not responsible for your SL. Trade at your own risk.
🎯 TAKE PROFIT (ESCAPE THE POLICE BARRICADE!):
Primary Target: 48,100
This zone acts as strong resistance + overbought + potential trap.
Escape with profits before the "police" (sellers) arrive!
⚠️ NOTE: You can take partial profits earlier. This is YOUR choice - manage your own trade!
📊 RELATED PAIRS TO WATCH:
TVC:DXY (US Dollar Index): ⚠️ INVERSE CORRELATION
Strong TVC:DXY = Pressure on CAPITALCOM:US30 (typically).
Watch for DXY weakness to confirm bullish CAPITALCOM:US30 momentum.
SP:SPX (S&P 500) / NASDAQ:NDX (Nasdaq 100): ✅ POSITIVE CORRELATION
If SPX/NDX are strong, likely supports CAPITALCOM:US30 rally.
Weakness here may limit CAPITALCOM:US30 upside.
TVC:VIX (Volatility Index): ⚠️ FEAR GAUGE
Rising TVC:VIX = Risk-off mood, may cap equity gains.
Stable/Low TVC:VIX supports bullish move.
EUR/USD & GBP/USD: ⚠️ DOLLAR SENSITIVITY
USD pairs can signal broad USD strength/weakness, impacting PURPLETRADING:US30.
📌 KEY NOTES FOR THIEF OG's:
This is a LAYERED ENTRY strategy - patience is key.
Adjust ALL levels based on your account size & risk tolerance.
Watch related markets for confirmation or warning signs.
YOU are responsible for your trades - manage them actively!
👍 LIKE & FOLLOW if you find this useful!
🔔 TURN ON NOTIFICATIONS for more THIEF STRATEGY setups!
💬 COMMENT below with your adjustments or questions!
#TradingView #US30 #DowJones #TradingStrategy #DayTrade #Bullish #Pullback #StockMarket #TradingIdeas #CFD #IndexTrading #ThiefStrategy #LayerTrading
Dow Jones (US30) a break of 47,759 will confirm downside momentu
The rally was sold in the dip was bought, resulting in a doji-style candle being posted at the high. This highlights investor indecision at current levels.
Big Picture analysis suggests we are currently trading within the BC leg of a Butterfly formation. This pattern will be invalidated on a move through the previous swing high of 48,460. Formation will be completed on a move to 43,946.
The trend of higher highs and the previous change of structure is located at 47,759.
It should be noted that the US2000 has just hit a 261.8% extension level
Conclusion: the value trade is to the downside. A break of 47,759 will confirm downside momentum. (edited)Friday, 5 December 2025 06:45

us30 buy ideaWe are looking at the US30 chart on the H4 timeframe for a buy setup. The current area where the market is trading (47270.1 – 47118.2), as soon as this zone breaks to the downside, there is a demand flip zone below (46586.5 – 46328.4). When the market comes down to this zone, we will move to the M15 timeframe and look for a buy signal from the refined zone on the M15 timeframe, and then we will take a buy trade.

US30 Trade Set Up Dec 5 2025Price has shifted to bearish structure failing to close higher and now making LL/LH with SSL and Daily FVGs below to target so first i want to see internal 5m-15m bearish structure to continue lower

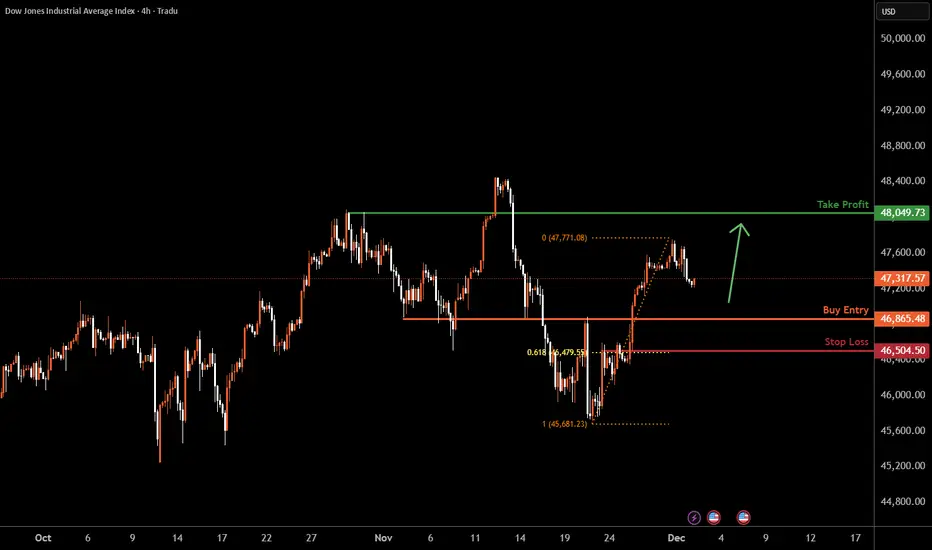
US30 H4 | Falling Towards Key SupportMomentum: Bullish
Price is pulling back toward our buy entry, which has been identified as an overlap support zone.
Buy Entry: 46,865.48
Strong overlap support
Stop Loss: 46,504.50
Pullback support
61.8% Fibonacci retracement
Take Profit: 48,049.73
Pullback resistance
High Risk Investment Warning
Stratos Markets Limited (tradu.com ), Stratos Europe Ltd (tradu.com ):
CFDs are complex instruments and come with a high risk of losing money rapidly due to leverage. 70% of retail investor accounts lose money when trading CFDs with this provider. You should consider whether you understand how CFDs work and whether you can afford to take the high risk of losing your money.
Stratos Global LLC (tradu.com ): Losses can exceed deposits.
Please be advised that the information presented on TradingView is provided to Tradu (‘Company’, ‘we’) by a third-party provider (‘TFA Global Pte Ltd’). Please be reminded that you are solely responsible for the trading decisions on your account. Any information and/or content is intended entirely for research, educational and informational purposes only and does not constitute investment or consultation advice or investment strategy. The information is not tailored to the investment needs of any specific person and therefore does not involve a consideration of any of the investment objectives, financial situation or needs of any viewer that may receive it. Past performance is not a reliable indicator of future results. Actual results may differ materially from those anticipated in forward-looking or past performance statements. We assume no liability as to the accuracy or completeness of any of the information and/or content provided herein and the Company cannot be held responsible for any omission, mistake nor for any loss or damage including without limitation to any loss of profit which may arise from reliance on any information supplied by TFA Global Pte Ltd.
US30 Trade ideaUS30 at daily demand zone. BUllish momentum forming HH and HL ,targeted all time high,
US30 We see price rejecting and at the sametime confirming continuation to the bullish side to being bullish after the newly formed demand zone price failed to break below it. Which indicate the is is a strong demand zone.

Falling wedgeThe price has made a falling wedge pattern followed by a breakout and retest, now the price looks to make a higher high and continue long
WE ONLY TRADE PULLBACKS
Comment your thoughts

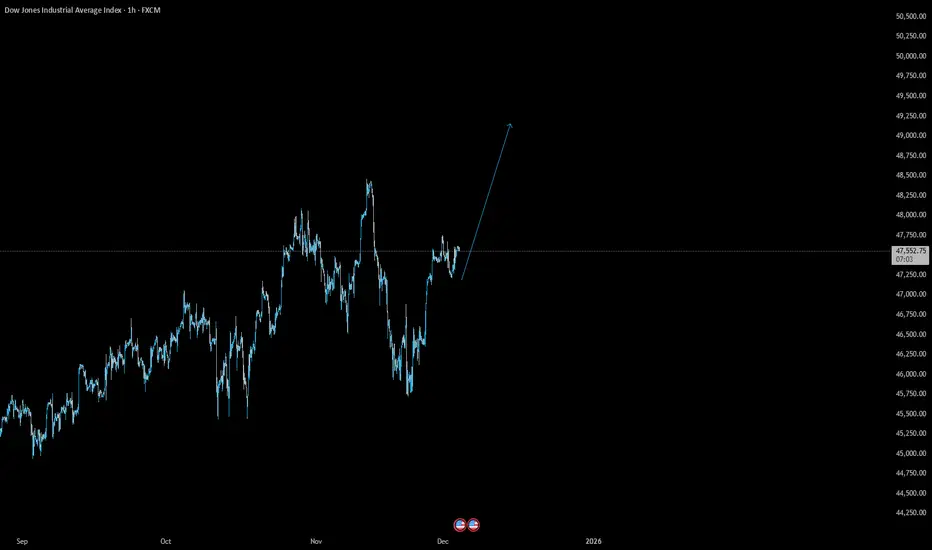
US30 about to make a new all time highWith FED officially ending the QT, US30 about to make a new all time high
US30 Price consolidation bullish sequenceUS30 Price consolidation bullish sequence price action is shaping a potential continuation phase Price is currently testing a resistance zone,
Technically a rising trendline is supporting the price a well-defined ascending trendline has been respected multiple times price recently bounced from it and is still trading above it — indicating upward structure remains intact.
However if the maintain bullish structure we could expect price continuation to upwards side a major resistance will be 48,015 to 48,500 to find in upside.
You may find more details in the chart.
Trade wisely best of luck buddies.\
Ps; Support with like and comments for better analysis thanks for supporting.
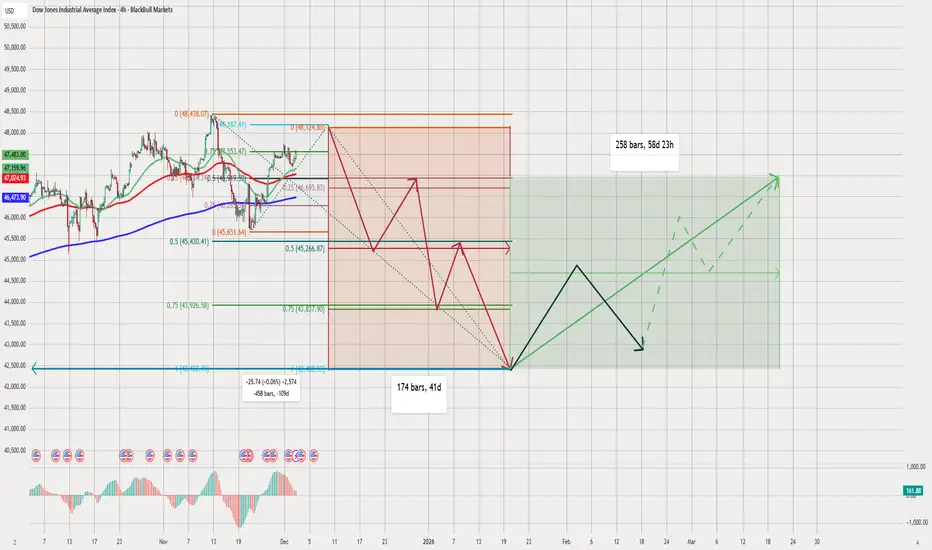
US30 SELL 4HUS30 (Dow Jones) Technical Analysis – 4H Chart
chart shows a well-structured bearish scenario, followed by a medium-term bullish reversal setup. combining Fibonacci retracement levels, time cycles, moving averages, and projected wave paths to map the market direction.
Below is a detailed breakdown:
1️⃣ Current Market Structure
Price recently reached a local top near 48,127.
After this, the chart suggests expect a significant downward correction.
Price is fluctuating above the:
Green MA (short-term)
Red MA (medium-term)
Blue 200 MA (long-term)
projected path shows a breakdown below these moving averages soon.
2️⃣ Fibonacci Levels (Important Zones)
From the recent high, your Fibonacci retracement levels are:
0.25 → 46,699
0.5 → 45,274
0.75 → 43,950
These levels align with your expected downward waves.
Major Support Zone
Large green zone near 41,700 – 42,200
This is where your final bearish wave ends
It also overlaps with a long-term Fibonacci cluster
This suggests it is the target bottom of the correction.
3️⃣ Bearish Projection (Red Wave Path)
chart shows multiple downward swings:
Initial drop from 48,127 → 45,274
Bounce to retest resistance
Deeper decline toward 44,000 – 43,500
Another bounce
Final capitulation to 41,700
🟥 Final Bearish Target:
~41,700
This matches the blue horizontal support line.
🔹 Duration of Bearish Cycle
174 bars (~41 days)
This suggests the decline completes around late January 2026.
4️⃣ Bullish Reversal Phase (Green + Black Path)
After reaching the bottom around 41,700, your chart shows two phases:
Phase 1 – Strong Rebound (Black Path)
A sharp rally into early February:
First rally to around 44,500 – 45,000
Short-term pullback
Then continuation higher
Phase 2 – Trend Recovery (Green Path)
Long-term green path shows:
A steady upward channel
Price aiming toward 48,000 – 49,000 again
The green dotted lines show alternative bullish scenarios
🔹 Total Recovery Time
258 bars (~58 days)
Targeting mid-March 2026 for a full recovery.
5️⃣ Interpretation of Moving Averages
Price will break below the moving averages during the correction.
Long-term recovery will push back above the:
50 MA (green)
100 MA (red)
200 MA (blue)
This confirms a trend reversal after the bottom is hit.
6️⃣ Summary of Your Outlook
📉 Short-Term Bias: Bearish
Price expected to drop from the top
Multiple lower highs / lower lows
Target bottom: 41,700
📉 Medium-Term Bias: Consolidation & Reversal
Strong bounce after the bottom
Wave structure suggests accumulation
📈 Long-Term Bias: Bullish
Recovery back toward all-time highs
Market structure returns to an uptrend by March 2026
✔️ Final Conclusion
chart suggests a full cycle:
Top formation near 48,127
Multi-wave decline (target 41,700)
41-day bearish cycle
Strong bullish reversal
Full recovery within ~58 days
This is a very clean Elliott-wave-style projection supported by Fibonacci and time cycles.
DowJones key support at 47530Key Support and Resistance Levels
Resistance Level 1: 48132
Resistance Level 2: 48276
Resistance Level 3: 48420
Support Level 1: 47530
Support Level 2: 47366
Support Level 3: 47185
This communication is for informational purposes only and should not be viewed as any form of recommendation as to a particular course of action or as investment advice. It is not intended as an offer or solicitation for the purchase or sale of any financial instrument or as an official confirmation of any transaction. Opinions, estimates and assumptions expressed herein are made as of the date of this communication and are subject to change without notice. This communication has been prepared based upon information, including market prices, data and other information, believed to be reliable; however, Trade Nation does not warrant its completeness or accuracy. All market prices and market data contained in or attached to this communication are indicative and subject to change without notice.

DowJones resistance retest at 47548Key Support and Resistance Levels
Resistance Level 1: 47648
Resistance Level 2: 47830
Resistance Level 3: 48000
Support Level 1: 47130
Support Level 2: 47000
Support Level 3: 46867
This communication is for informational purposes only and should not be viewed as any form of recommendation as to a particular course of action or as investment advice. It is not intended as an offer or solicitation for the purchase or sale of any financial instrument or as an official confirmation of any transaction. Opinions, estimates and assumptions expressed herein are made as of the date of this communication and are subject to change without notice. This communication has been prepared based upon information, including market prices, data and other information, believed to be reliable; however, Trade Nation does not warrant its completeness or accuracy. All market prices and market data contained in or attached to this communication are indicative and subject to change without notice.

US30 Trade Set Up Dec 3 2025Price failed to make a HH on the 1h, swept PDH and has reversed so i will look for internal 5m-15m bearish structure to target PDL

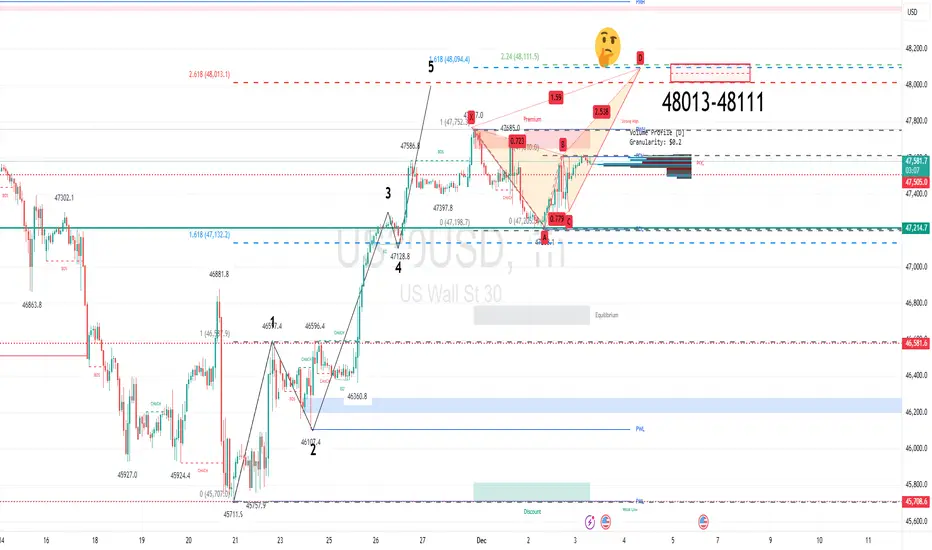
Dow Jones (US30) grinds higher within the choppy 5th wave
We have seen mixed price action for the last four days, with rallies finding sellers and dips finding buyers
The intraday chart highlights a 261.8% extension level at 48,013. A move to this zone would be analysed as the completion of a bullish 5 Wave count (Elliott Wave).
The current mixed daily results look to be forming a Crab pattern. That will be completed on a move to 48,111.
Conclusion: the medium-term bias is bearish. The preferred stance would be to sell into rallies within the 48,013-48,111 zone.
DowJones resisrtance retest at 47648Key Support and Resistance Levels
Resistance Level 1: 47648
Resistance Level 2: 47830
Resistance Level 3: 48000
Support Level 1: 47130
Support Level 2: 47000
Support Level 3: 46867
This communication is for informational purposes only and should not be viewed as any form of recommendation as to a particular course of action or as investment advice. It is not intended as an offer or solicitation for the purchase or sale of any financial instrument or as an official confirmation of any transaction. Opinions, estimates and assumptions expressed herein are made as of the date of this communication and are subject to change without notice. This communication has been prepared based upon information, including market prices, data and other information, believed to be reliable; however, Trade Nation does not warrant its completeness or accuracy. All market prices and market data contained in or attached to this communication are indicative and subject to change without notice.

DJIA - Bullish Breakout - 2 Ways To Get InvolvedMy number four top trading idea of the week comes from the Dow Jones. Renewed optimism in the markets—partly fueled by the fading AI-panic narrative—has driven nearly six consecutive bullish sessions. The one day that didn’t close bullish actually left behind a beautiful structure shelf, giving traders a logical level to protect stops if looking for a bullish continuation.
In this video, we’ll break down two ways to get involved—either through a breakout or a pullback—and discuss the pros and cons that come with each approach so you can choose the tactic that best fits your trading style.
Please leave any questions, comments, or trading ideas below!
Be on the lookout for Top Trading Idea #3 heading your way soon!
Akil
