
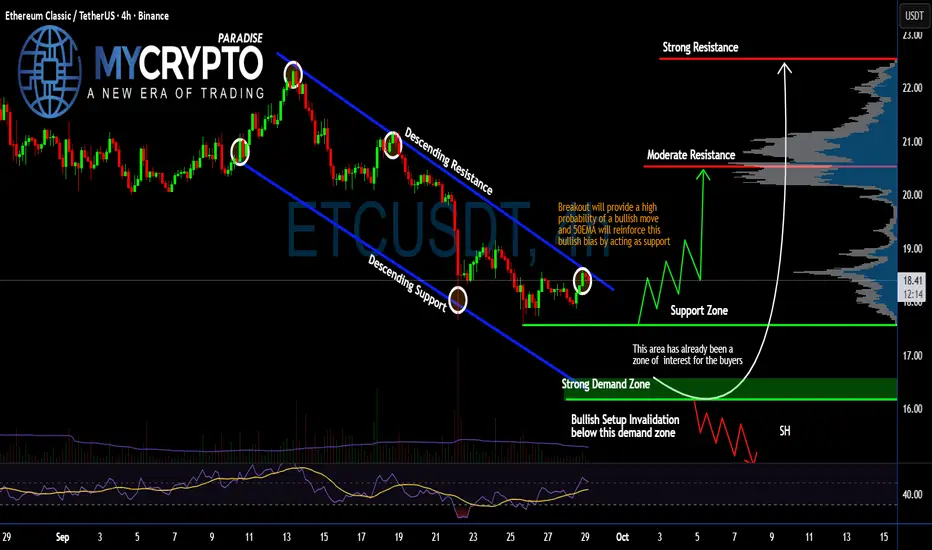
#ETC Bulls Ready For a Pullback or Not? Watch Closely for Trap Yello Paradisers! Are we about to witness #EthereumClassic finally escape this downtrend channel, or another trap lies ahead? Let's break down the #ETC setup before the trap springs:
💎#ETCUSDT has been grinding inside a clear descending channel in the 4-hour timeframe and bouncing consistently betw
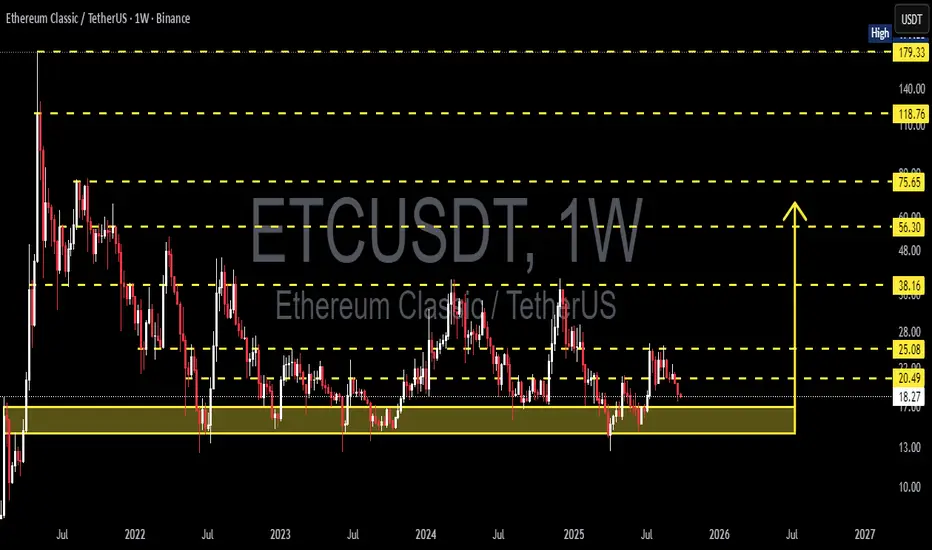
ETC/USDT — Major Support Retest, Breakout or Breakdown?🔎 Current Market Outlook
Current price: ~20.49 USDT
Price is approaching the critical support zone at 17–14 USDT (highlighted yellow).
This area has acted as a multi-year demand zone since 2021, where buyers repeatedly defended the level and triggered rebounds.
However, ETC has consistently fail
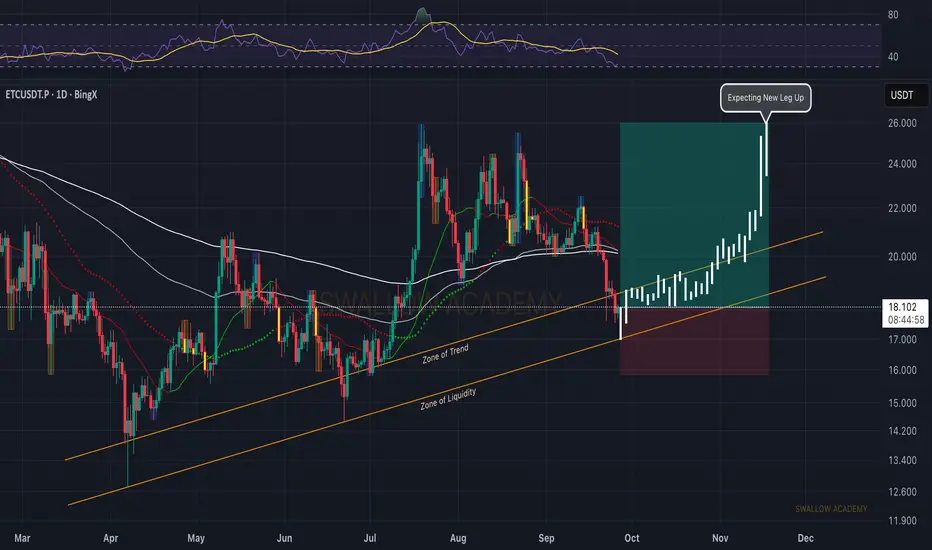
Ethereum Classic (ETC): Expecting Another Bounce From Trend ZoneETC keeps grinding higher inside the bullish trend channel. After reclaiming the liquidity zone around $18, buyers have been holding dominance, pushing the price with strong momentum.
As long as the channel holds, we expect continuation and a new leg up targeting the $26 area.
Swallow Academy
ETC is forming a potential double bottom pattern📊 BME:ETC Market Update
BME:ETC is forming a potential double bottom pattern 🔄. If it breaks out of the red resistance zone 🔴, the first target will be the 🔵 blue line level 🎯.

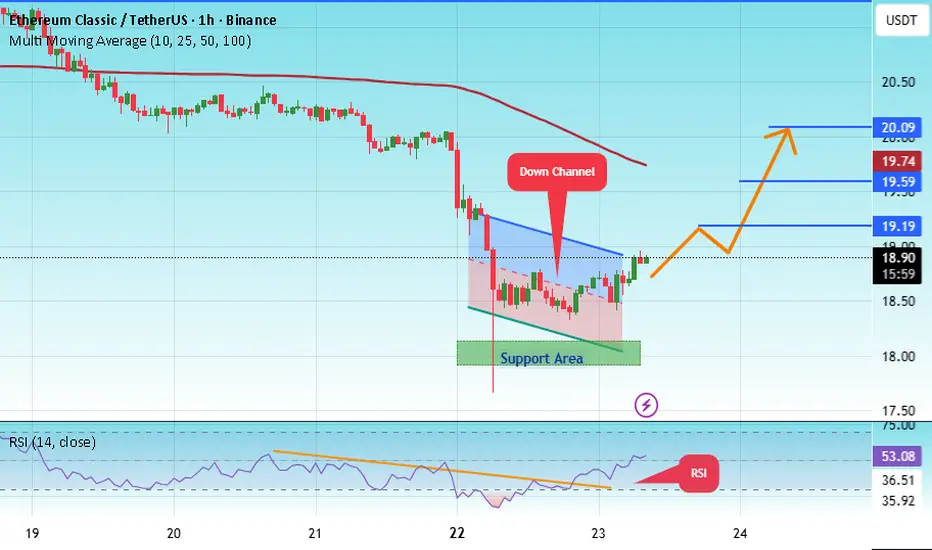
#ETC/USDT Might Be Good Zone to Bounce From#ETC
The price is moving within a descending channel on the 1-hour frame, adhering well to it, and is heading for a strong breakout and retest.
We have a bearish trend on the RSI indicator that is about to be broken and retested, which supports the upward breakout.
There is a major support area i
Ethereum Classic (ETC): Good Risk:Reward Trading SetupETC is hovering near the local bottom area, which usually is the beginning phase before the bullish movement of more than 2x on the coin.
We are looking for a proper bounce from this region; although it might take some time, the R:R on this position is still very good to risk it and wait patiently

ETCUSDT 1D chart reviewTrend and structure
• The price is currently in the 20.40 USDT area.
• You can see the downward trend line (orange), from which the price was rejected several times.
• The next support:
• 20.40 USDT (local, just tested)
• 19.01 USDT (stronger support from earlier holes).
• The nearest re

Ethereum Classic (ETC): Expecting 22% Bounce From Here | BullishETC has a really good chance for a potential bounce, which can give us a 22% trade right here!
More in-depth info is in the video—enjoy!
Swallow Academy

$ETC SET:ETC
# 📊 Setup ETC/USDT (TF 15m)
1. **Demand Zone (Red Box Below)**
👉 Price is bouncing from the demand area (around **20.17 – 20.29**).
👉 This is a strong buyer zone, potential base for an upward move.
2. **Stochastic Oversold (Yellow Circle)**
👉 The stochastic indicator is already

See all ideas
Summarizing what the indicators are suggesting.
Oscillators
Neutral
SellBuy
Strong sellStrong buy
Strong sellSellNeutralBuyStrong buy
Oscillators
Neutral
SellBuy
Strong sellStrong buy
Strong sellSellNeutralBuyStrong buy
Summary
Neutral
SellBuy
Strong sellStrong buy
Strong sellSellNeutralBuyStrong buy
Summary
Neutral
SellBuy
Strong sellStrong buy
Strong sellSellNeutralBuyStrong buy
Summary
Neutral
SellBuy
Strong sellStrong buy
Strong sellSellNeutralBuyStrong buy
Moving Averages
Neutral
SellBuy
Strong sellStrong buy
Strong sellSellNeutralBuyStrong buy
Moving Averages
Neutral
SellBuy
Strong sellStrong buy
Strong sellSellNeutralBuyStrong buy
Displays a symbol's price movements over previous years to identify recurring trends.