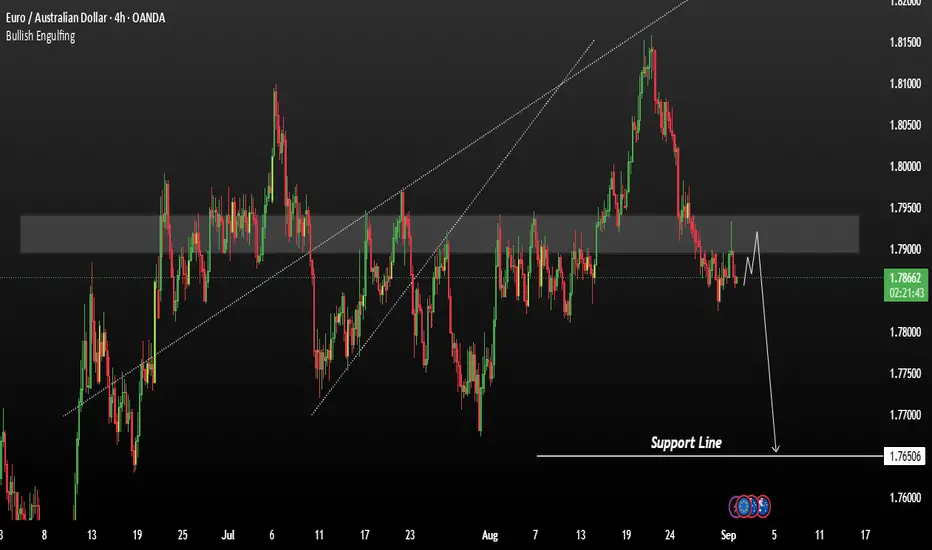
EURAUD Is Going Down! Short!
Take a look at our analysis for EURAUD.
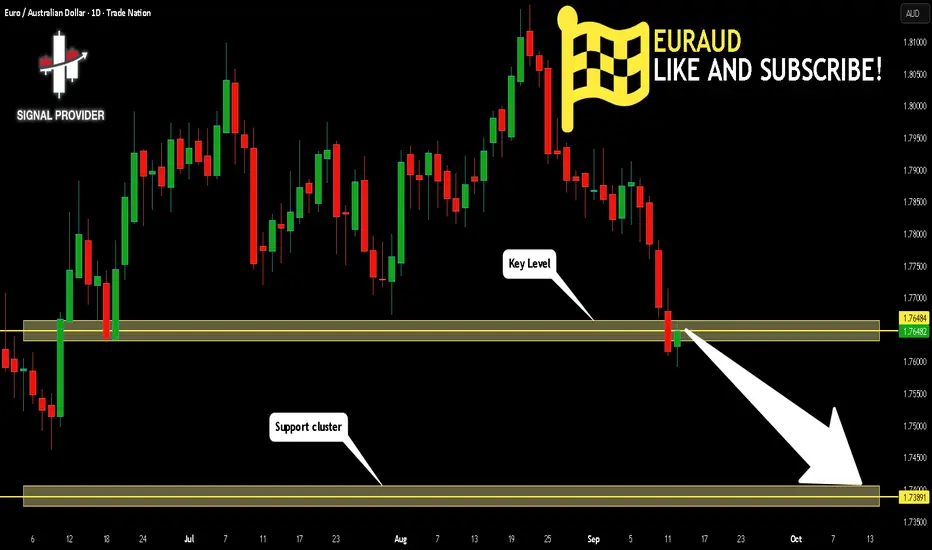
Time Frame: 1D
Current Trend: Bearish
Sentiment: Overbought (based on 7-period RSI)
Forecast: Bearish
The market is approaching a key horizontal level 1.764.
Considering the today's price action, probabilities will be high to see a movement to 1.738.
P.S
The term oversold refers to a condition where an asset has traded lower in price and has the potential for a price bounce.
Overbought refers to market scenarios where the instrument is traded considerably higher than its fair value. Overvaluation is caused by market sentiments when there is positive news.
Disclosure: I am part of Trade Nation's Influencer program and receive a monthly fee for using their TradingView charts in my analysis.
Like and subscribe and comment my ideas if you enjoy them!
Trade ideas
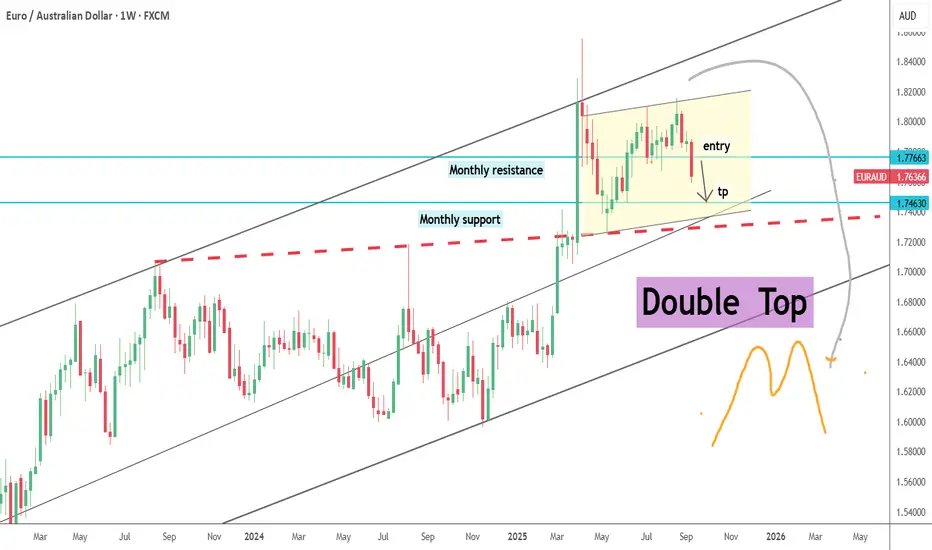
EURAUD--SHORT--Double top
--tp and entry levels are as shown on chart
--Also check my weekly chart below

EURAUD--Double Top--One more bearish week after last week
--monthly bearish
--weekly bearish
--daily bearish
--tp and entry levels are as shown on chart
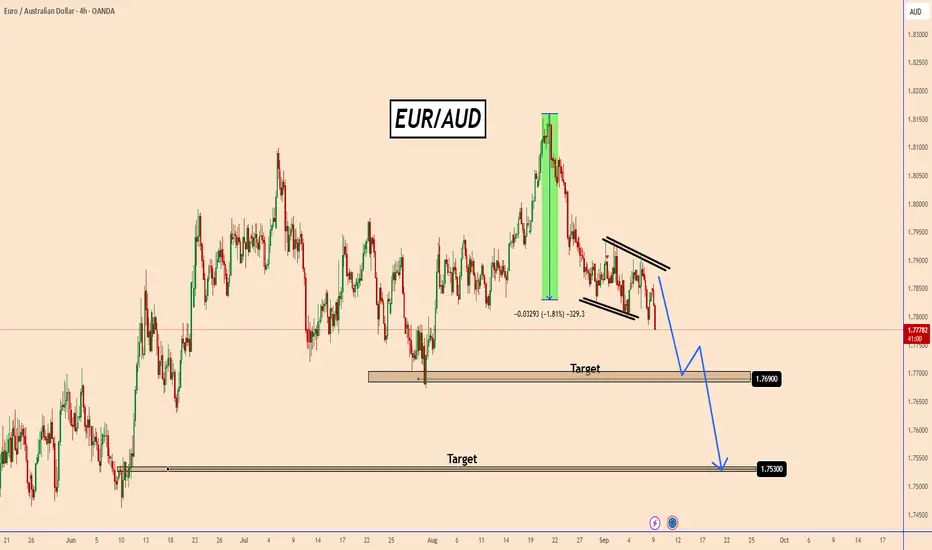
EUR/AUD Daily AnalysisIn a previous analysis, we were watching EUR/AUD for a possible trend continuation setup off the trendline, but with price breaking lower, the market sentiment may now have switched to sells.
With the moving averages now in a bearish order and with price below the trendline, there may be a possible shorting opportunity if price pulls back and corrects the current bearish impulse.
Look for a setup that meets your rules.

EUR/AUD – 4H Technical Outlook
The pair has recently bounced off the key support level at 1.7600, aligning perfectly with the lower boundary of the descending price channel 📉—a classic technical reaction.
📊 Current price action reflects a 61% Fibonacci retracement of the previous bullish leg on the broader timeframe, with clear signs of a potential reversal emerging 🔄.
✨ Bullish momentum is expected to continue, targeting:
• 🎯 1.7777 – initial resistance
• 🎯 1.8011 – extended bullish objective
🛡 As long as price action holds above the 1.7444 support, the bullish bias remains intact.
---

EurAud short term longsPrice came into the discount of a weekly range then proceeded to the daily chart. On the daily, the low of Thursday’s bearish candle is taken out(turtle soup)
Then price proceeds to give a market structure shift to the up side.
Entry is an 1h order block and target is the median of a 30m fair value gap

Institutional Demand: EUR/AUD longsHey,
This chart is looking good for a pullback play, the zone is broken but the 4-hour closed within our extended zone criteria, which makes the trade valid and the breakout fake.
Let's see how this plays out!
Kind regards,
Max Nieveld
@ mnieveld dm for questions.


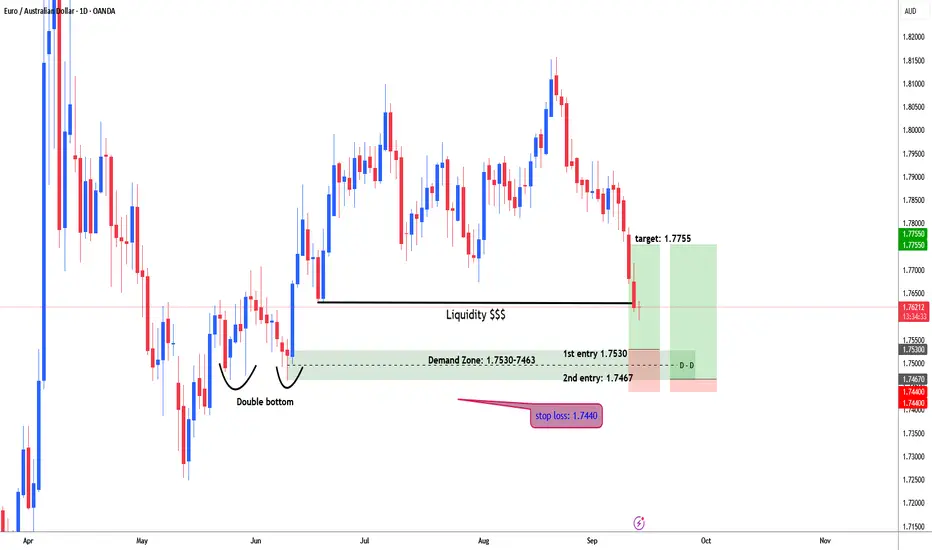
EURAUD possible tripple bottom and bullish for 1.7755#EURAUD broker previous two trendline support levels i.e. 1.7674 & 1.7635. Price may test previous demand zone level i.e. 1.7530-7467. split your risk into two trading position as 0.5% risk from the top of the demand zone 17530, use remaining 0.5% risk from the bottom of the demand zone 1.7467. stop loss below the daily demand level i.e. 1.7440, target: 1.7755.
EURAUD EURAUD has more bearish days ahead ,if we see another buy look for sell into the daily demand structure.
#euraud

EURAUD COMING days we will see the fall of EURAUD if sellers could try to close below the demand floor ,
on retest sell till the structure of the ascending trendline is achieved.
the buy entry POE will be watched based on price movement.
#euraud

EURAUD: Is Getting Ready To Start a DowntrendEURAUD: Is Getting Ready To Start a Downtrend
From our previous analysis, it seems that EURAUD is about to complete the expected correction. It is not a clear correction, but it is still a correction.
The AUD reported good GDP data last week, showing that the economy is back on track. On the other hand, the Eurozone is also facing some problems with its second largest economy.
🟢France's parliament brought down the government on Monday over its plans to tame the ballooning national debt, deepening a political crisis that is weakening the euro zone's second-largest economy - Reuters
If EURAUD breaks below the current pattern, the likelihood of a deeper decline increases.
Key support zones to watch are:
1.7690
1.7530
You may find more details in the chart!
Thank you and Good Luck!
❤️PS: Please support with a like or comment if you find this analysis useful for your trading day❤️
OVERBOUGHT or OVERSOLD = NO VALUE = NO TRADEAll the information you need to find a high probability trade are in front of you on the charts so build your trading decisions on 'the facts' of the chart NOT what you think or what you want to happen or even what you heard will happen. If you have enough facts telling you to trade in a certain direction and therefore enough confluence to take a trade, then this is how you will gain consistency in you trading and build confidence. Check out my trade idea!!
www.tradingview.com

EURAUD WEEKLYWAIT FOR the floor on the given zone and if price comes it a buy position.
structure doesn't lie.
#euraud

Bearish continuation in play?EUR/AUD has reacted off the pivot and could potentially drop to the 1st support.
Pivot: 1.76716
1st Support: 1.74789
1st Resistance: 1.78121
Disclaimer:
The above opinions given constitute general market commentary, and do not constitute the opinion or advice of IC Markets or any form of personal or investment advice.
Any opinions, news, research, analyses, prices, other information, or links to third-party sites contained on this website are provided on an "as-is" basis, are intended only to be informative, is not an advice nor a recommendation, nor research, or a record of our trading prices, or an offer of, or solicitation for a transaction in any financial instrument and thus should not be treated as such. The information provided does not involve any specific investment objectives, financial situation and needs of any specific person who may receive it. Please be aware, that past performance is not a reliable indicator of future performance and/or results. Past Performance or Forward-looking scenarios based upon the reasonable beliefs of the third-party provider are not a guarantee of future performance. Actual results may differ materially from those anticipated in forward-looking or past performance statements. IC Markets makes no representation or warranty and assumes no liability as to the accuracy or completeness of the information provided, nor any loss arising from any investment based on a recommendation, forecast or any information supplied by any third-party.

EUR/AUD: Price Sitting on Support – Next Stop 1.8050?Price is sitting right on the trendline support - exactly where buyers have stepped in before. As expected, it’s showing signs of holding and could push back up toward the 1.8050 resistance.
Key watch:
Holding the trendline = bullish momentum intact.
A clean break below = shift in structure, sellers take over.
For now, bias stays up as long as this support holds.3

WE MIGHT HAVE A BULLISH TRENDHello Traders, please check this pair coz is on our strong support zone which was a prev.. HL(D1) so we can expect a rejection, you can see that the price has been doing HHs & HLs so we are on bullish trend, check your H4 & H1 we have a bullish engulfing and on 15 min we have inv. H&Ss rev. pattern.
GOOD LUCK
NB:NO REVERSAL PATTERNS NO ENTRY.


EurAud Continuation Trade SetupPrimary Count
Price is advancing in a small wave 4 recovery with the ideal resistance at the 38.2% retracement of wave 3 near 1.7719–1.7722, which often caps fourth waves in fast trends.
A subsequent break lower would complete wave 5 with equality to wave 1 at or around 1.7622 - 1.7600
Why this count
The decline into the labeled wave 3 shows impulsive characteristics, while the current bounce is overlapping and contained—typical wave 4 behavior into Fibonacci resistance.
The projection cluster at 1.7622 (5 vs 1 equality) provides a textbook objective for terminating moves when wave 3 has carried the bulk of the trend.
Trade plan
Entry: Monitor for reversal signals in the 1.7715–1.7725 sell zone; consider scaling on a lower-timeframe break of the bounce channel.
Stop: Above 1.7750 to allow noise beyond the 38.2% level while preserving the wave 4 thesis.
Targets: Take profits at 1.7622- 1.7600.
What to watch
Confirmation comes from an impulsive turn down from the 38.2% zone followed by a break of bounce lows, indicating wave 5 has engaged.
Invalidation is a sustained push and hold above 1.7750 that compromises the wave 4 cap and suggests a deeper correction toward higher retracements.
Structure comes before prediction—let the reaction at 1.7720 reveal whether the fifth wave is ready to break lower or if the correction needs more time to mature

BUYING OPPORTUNITYeuraud
buying setup reasons 1.uptrend in high timeframe 2.price form new higher high in daily timeframe 3.price is at support level

EURAUD made a significant move to the downsideEURAUD has made a significant move to the downside, which is particularly noteworthy given the lack of impactful economic data during this period. This indicates that the decline is likely driven by momentum and market sentiment, rather than by fundamental catalysts.
Technical Outlook:
The trend remains bearish, with no major support zones being respected on the way down. Momentum appears strong, but given the extent of the move, a short-term correction or pause is likely before further downside continuation 1.78600 – 1.79200 This zone could act as a short-term resistance, where price may pull back before continuing lower. I'm watching this area closely for signs of bearish rejection,
You may find more details in the chart.
Trade wisely best of luck buddies.
Ps; Support with like and comments for better analysis.
EUR_AUD SUPPORT BELOW|LONG|
✅EUR_AUD is going down now
But a strong support level is ahead at 1.7650
Thus I am expecting a rebound
And a move up towards the target of 1.7709
LONG🚀
✅Like and subscribe to never miss a new idea!✅
