Euro / Canadian Dollar
No trades
Trade ideas

EURCAD 1:2.5 RRThis is a trade idea, posting for future reference
not to be taken as financial advice

EUR/CAD BEST PLACE TO SELL FROM|SHORT
Hello, Friends!
We are now examining the EUR/CAD pair and we can see that the pair is going up locally while also being in a uptrend on the 1W TF. But there is also a powerful signal from the BB upper band being nearby, indicating that the pair is overbought so we can go short from the resistance line above and a target at 1.612 level.
Disclosure: I am part of Trade Nation's Influencer program and receive a monthly fee for using their TradingView charts in my analysis.
✅LIKE AND COMMENT MY IDEAS✅


Bullish bounce off pullback support?EUR/CAD is falling towards the pivot, which acts as a pullback support that lines up with the 50% Fibonacci retracement and could bounce to the 1st resistance.
Pivot: 1.62239
1st Support: 1.61817
1st Resistance: 1.62991
Disclaimer:
The opinions given above constitute general market commentary and do not constitute the opinion or advice of IC Markets or any form of personal or investment advice.
Any opinions, news, research, analyses, prices, other information, or links to third-party sites contained on this website are provided on an "as-is" basis, are intended to be informative only, and are not advice, a recommendation, research, a record of our trading prices, an offer of, or solicitation for, a transaction in any financial instrument and thus should not be treated as such. The information provided does not involve any specific investment objectives, financial situation, or needs of any specific person who may receive it. Please be aware that past performance is not a reliable indicator of future performance and/or results. Past performance or forward-looking scenarios based upon the reasonable beliefs of the third-party provider are not a guarantee of future performance. Actual results may differ materially from those anticipated in forward-looking or past performance statements. IC Markets makes no representation or warranty and assumes no liability as to the accuracy or completeness of the information provided, nor any loss arising from any investment based on a recommendation, forecast, or any information supplied by any third party.

Buy EUR/CAD at bottom of channelEUR/CAD has been correcting for a month now and is now approaching the bottom of a channel around 1.6120. This area also has good previous support which pushed the price up several times before. Is this a good time to buy?
Buy Limit : 1.6120 bottom of channel
Stop : 1.6027 under good support
Profit : 1.6400 previous resistance
Risk 1 : 3 / Stop is 93 pips

EURCAD - Bearish ContinuationPrice rejected hard from the top of the broken ascending channel + 50% Fib + 200 SMA cluster.
Clear bearish pinbar → strong close below the 200 SMA → sellers fully in control.
Confirmations everywhere:
RSI under 50 with bearish divergence
MACD below signal, histogram expanding red
Volume jumping on the down candles
Short bias.
Entry on a bounce back to the broken channel / 200 SMA or fresh breakdown.
Targets: next support zone first, then lower psychological level.
Stop above the recent swing high → clean 1:3+ RR.
ECB still dovish, BOC holding steady → macro supports the downside.
Who’s riding this one lower? 👇

EUR/CAD - Bearish Flag (20.11.2025)🧠 Setup Overview TICKMILL:EURCAD
EUR/CAD is forming a clean Bearish Flag Pattern after a strong impulsive drop.
Price is trading below the EMA, inside a rising corrective channel — a classic continuation structure. With cloud resistance above and repeated rejections from the upper flag boundary, bearish momentum is building. A confirmed breakdown below the lower trendline could trigger the next bearish leg.
📊 Trading Plan🔻 Sell Bias (Primary Scenario)
Watch for a candle break & retest below the flag
Enter short after confirmation
🎯 Targets:
1st Support: 1.6137
2nd Support: 1.6109
❌ Invalidation:
A strong candle close above 1.6230 cancels the bearish view
⚡ Fundamental Outlook – Today (20 Nov 2025)
CAD Fundamentals
1️⃣ Canadian Dollar strengthened as crude oil prices saw a mild rebound, supporting CAD (commodity-linked currency).
2️⃣ Bank of Canada remains cautious, but no new signs of easing have emerged — giving CAD some underlying firmness.
EUR Fundamentals
3️⃣ Euro under pressure due to rate-cut expectations in early 2026 as European economic data remains soft, especially in manufacturing.
4️⃣ Risk-off sentiment pushes flows toward safer currencies, indirectly affecting EUR negatively.
➡️ Fundamentals support a continuation move lower for EUR/CAD.
#EURCAD #Forex #BearishFlag #PriceAction #TechnicalAnalysis #EUR #CAD #ForexTrader #TradingSetup #KABHI_TA_TRADING #ChartsDontLieTradersDontQuit #TradingViewCommunity #SupportAndResistance #BreakoutStrategy
⚠️ Disclaimer
This analysis is for educational purposes only.
Not financial advice — always use proper risk management.
💬 Support My Work ❤️
If this setup helps you:👍 LIKE the post💬 COMMENT your view🔔 FOLLOW for daily setups
Your support motivates me to keep posting high-quality analysis!

EURCAD Trade ideaEURCAD 20/11/25 10am NY: This refers to a potential trade on the EURCAD pair with a time frame of November 25, 2020, at 10am New York time. It could be relevant for intraday trading or just analyzing that specific time and price action.
Clean H4 Head and Shoulders: This suggests that you're observing a head and shoulders pattern on the 4-hour chart (H4). Head and Shoulders is a reversal pattern, where the price moves higher to form the left shoulder, then forms a higher peak (head), and then drops down and rises again to form the right shoulder. If confirmed, it could signal a reversal from an uptrend to a downtrend.
Fib 78.6: The 78.6% Fibonacci retracement level is often used to identify key levels of potential support or resistance. If price retraced from a recent move and found support/resistance at this level, it might indicate a strong area for potential reversal or continuation.
Candlestick Clean Doji: A doji candlestick often signals indecision in the market, where buyers and sellers are in equilibrium. If you're seeing a clean doji at this level, it might indicate that the market is unsure and could be preparing for a reversal or a continuation depending on subsequent price action.
Potential Trade Idea:
Given the head and shoulders pattern, the 78.6% Fibonacci retracement level, and the doji candlestick, you might be watching for a potential short trade after the right shoulder completes, especially if the price starts to break below the neckline. If the market closes below the neckline and confirms the reversal, the price could move down to the next support level.

EURCAD – Watching Support for Possible ReactioEURCAD has dropped back into a key support zone around 1.6180 – 1.6170, a level that has held multiple times in the past. Price also broke below the short-term ascending trendline, showing fading bullish momentum.
If buyers manage to defend this support again, we could see a corrective bounce toward 1.6250 – 1.6310.
But a clean break below 1.6170 would likely open further downside continuation.

EURCAD - Login Time Sell mode 2/3 years Almost Looks EURCAD top of the down trend - it's going long time sell mode after few month latter.

EURCAD testing weekly SMA on 1H oversold RSIAs per subject, standard simple setup, EURCAD testing the weekly 20SMA on an oversold RSI on hourly. Also hitting the top of FVG created on Sept 5th. Nothing is certain. Tight SL.

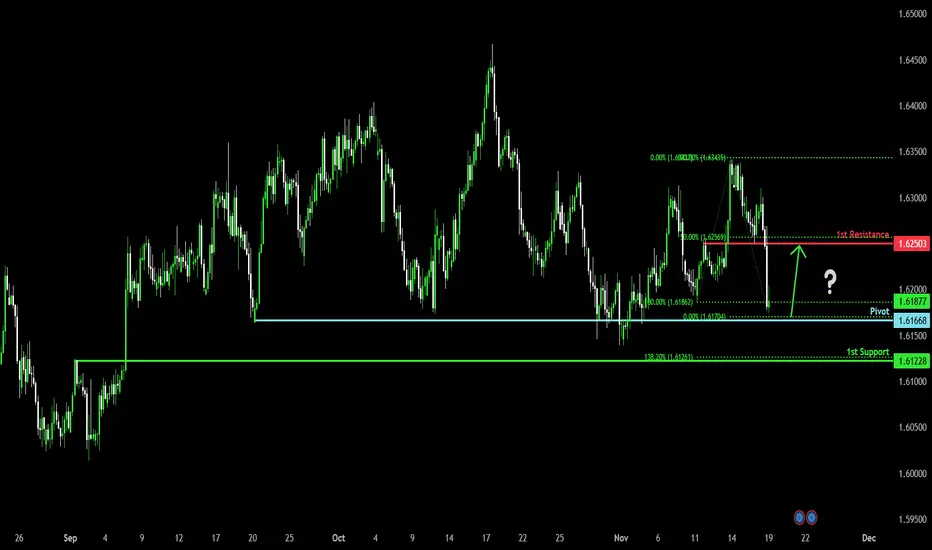
Bullish reversal setup?EUR/CAD is currently reacting off the pivot and could reverse to the 1st resistance.
Pivot: 1.61786
1st Support: 1.61228
1st Resistance: 1.62503
Disclaimer:
The opinions given above constitute general market commentary and do not constitute the opinion or advice of IC Markets or any form of personal or investment advice.
Any opinions, news, research, analyses, prices, other information, or links to third-party sites contained on this website are provided on an "as-is" basis, are intended to be informative only, and are not advice, a recommendation, research, a record of our trading prices, an offer of, or solicitation for, a transaction in any financial instrument and thus should not be treated as such. The information provided does not involve any specific investment objectives, financial situation, or needs of any specific person who may receive it. Please be aware that past performance is not a reliable indicator of future performance and/or results. Past performance or forward-looking scenarios based upon the reasonable beliefs of the third-party provider are not a guarantee of future performance. Actual results may differ materially from those anticipated in forward-looking or past performance statements. IC Markets makes no representation or warranty and assumes no liability as to the accuracy or completeness of the information provided, nor any loss arising from any investment based on a recommendation, forecast, or any information supplied by any third party.

EURCAD maintain further decline towardEUR/CAD is moving within an ascending channel but is showing signs of weakening momentum near the upper boundary. A potential double or triple top pattern is forming, suggesting bearish pressure.
From a technical perspective, the structure appears weak. Additionally, if Canadian employment data continues to soften, CAD demand may decline, which could reinforce price rejection and add further bearish pressure currently pulling back from resistance with expectations of a possible drop toward mid-channel support (1.6240), and if broken, a further decline toward 1.6200 could follow.
You may find more details in the chart,
Trade wisely bets of Luck Buddies.
Ps; Support with like and comments for better analysis Thanks for Supporting.

EURCAD BUY PROJECTION!There’s a potential BUY OPPORTUNITY in EURCAD at the moment as buyers just regained momentum in the market. I’m gaining my entry from the current market price. Technically, we can see how price rebounded around 1.62917 and stated to build a bullish momentum. A buy opportunity is envisaged.

EURCAD : 30TF BUY SL : 1.6280Goal : 70% Wining Rate
EURCAD : BUY in 30 TF
SL : 1.6280
TP : 1.63365
Good Luck

EURCAD long movePrice is to drop towards our demand zone and if there should be any bullish reaction at that level, we could then see a bullish movement.

Bullish bounce off?EUR/CAD has bounced off the pivot whic acts as an overlap support and could rise to the 1st resistance.
Pivot: 1.62489
1st Support: 1.62177
1st Resistance: 1.63341
Disclaimer:
The opinions given above constitute general market commentary and do not constitute the opinion or advice of IC Markets or any form of personal or investment advice.
Any opinions, news, research, analyses, prices, other information, or links to third-party sites contained on this website are provided on an "as-is" basis, are intended to be informative only, and are not advice, a recommendation, research, a record of our trading prices, an offer of, or solicitation for, a transaction in any financial instrument and thus should not be treated as such. The information provided does not involve any specific investment objectives, financial situation, or needs of any specific person who may receive it. Please be aware that past performance is not a reliable indicator of future performance and/or results. Past performance or forward-looking scenarios based upon the reasonable beliefs of the third-party provider are not a guarantee of future performance. Actual results may differ materially from those anticipated in forward-looking or past performance statements. IC Markets makes no representation or warranty and assumes no liability as to the accuracy or completeness of the information provided, nor any loss arising from any investment based on a recommendation, forecast, or any information supplied by any third party.


EUR/CAD BUYAfter a BOS on 4 h create a new LL
we wait for BOS on 30 mn create a HH
After take a BUY trade on DEMAND create on 30 mn

Eurocad outlook Let's envisage a move to the top once price gets to the Basement level ... Take advantage of it

EURCAD Will Go Up! Buy!
Here is our detailed technical review for EURCAD.
Time Frame: 9h
Current Trend: Bullish
Sentiment: Oversold (based on 7-period RSI)
Forecast: Bullish
The market is testing a major horizontal structure 1.628.
Taking into consideration the structure & trend analysis, I believe that the market will reach 1.639 level soon.
P.S
Please, note that an oversold/overbought condition can last for a long time, and therefore being oversold/overbought doesn't mean a price rally will come soon, or at all.
Like and subscribe and comment my ideas if you enjoy them!
