Euro Stoxx 50 Breaks Its All-Time HighEuro Stoxx 50 surpasses its historical record: a technical signal supported by attractive valuations for European equities.
The Euro Stoxx 50 is the benchmark index for major companies in the Eurozone. Created in 1998, it comprises the 50 largest market capitalizations in the region, including LVMH, TotalEnergies, Siemens, SAP, Allianz, and ASML. It therefore reflects the stock market performance of the largest European companies by market cap across all sectors, and the Euro Stoxx 50 futures contract is the most traded by European institutional managers.
For over twenty years, the index remained in a broad consolidation phase. After reaching a historical peak in March 2000, around 5,525 points during the dot-com bubble, it never exceeded this level. This price zone represented an important technical resistance, marking the upper limit of a long stagnation cycle.
In October 2025, the Euro Stoxx 50 surpassed this historical threshold, rising above 5,600 points. Technically, this breakout validates the exit from a long-term lateral structure. In chart analysis, breaking above such an old resistance is often interpreted as a bullish signal, suggesting a sustainable improvement in investor sentiment towards European markets.
This development occurs in a context of still moderate valuations for European equities. The CAPE ratio (Shiller P/E), which compares stock prices to the ten-year average of earnings, shows a marked gap with the United States. Europe’s CAPE is currently around 23, while the US CAPE is around 40, near its all-time high.
In other words, European equities trade at lower earnings multiples than US equities. This reflects more cautious valuation in Europe, despite a gradual improvement in margins and profitability of Eurozone companies.
The chart below is sourced from Barclays:
Investors therefore pay much less for each euro of earnings in Europe than for each dollar of earnings in the US. This undervaluation provides a catch-up potential: if confidence returns, international investment flows could redirect towards the Old Continent, supporting European market gains.
Thus, the break of the Euro Stoxx 50 all-time high occurs in an environment where fundamentals remain relatively balanced. This technical signal does not guarantee a sustained bullish trend, but it confirms renewed interest in European markets, supported by still reasonable valuations relative to US standards.
DISCLAIMER:
This content is intended for individuals who are familiar with financial markets and instruments and is for information purposes only. The presented idea (including market commentary, market data and observations) is not a work product of any research department of Swissquote or its affiliates. This material is intended to highlight market action and does not constitute investment, legal or tax advice. If you are a retail investor or lack experience in trading complex financial products, it is advisable to seek professional advice from licensed advisor before making any financial decisions.
This content is not intended to manipulate the market or encourage any specific financial behavior.
Swissquote makes no representation or warranty as to the quality, completeness, accuracy, comprehensiveness or non-infringement of such content. The views expressed are those of the consultant and are provided for educational purposes only. Any information provided relating to a product or market should not be construed as recommending an investment strategy or transaction. Past performance is not a guarantee of future results.
Swissquote and its employees and representatives shall in no event be held liable for any damages or losses arising directly or indirectly from decisions made on the basis of this content.
The use of any third-party brands or trademarks is for information only and does not imply endorsement by Swissquote, or that the trademark owner has authorised Swissquote to promote its products or services.
Swissquote is the marketing brand for the activities of Swissquote Bank Ltd (Switzerland) regulated by FINMA, Swissquote Capital Markets Limited regulated by CySEC (Cyprus), Swissquote Bank Europe SA (Luxembourg) regulated by the CSSF, Swissquote Ltd (UK) regulated by the FCA, Swissquote Financial Services (Malta) Ltd regulated by the Malta Financial Services Authority, Swissquote MEA Ltd. (UAE) regulated by the Dubai Financial Services Authority, Swissquote Pte Ltd (Singapore) regulated by the Monetary Authority of Singapore, Swissquote Asia Limited (Hong Kong) licensed by the Hong Kong Securities and Futures Commission (SFC) and Swissquote South Africa (Pty) Ltd supervised by the FSCA.
Products and services of Swissquote are only intended for those permitted to receive them under local law.
All investments carry a degree of risk. The risk of loss in trading or holding financial instruments can be substantial. The value of financial instruments, including but not limited to stocks, bonds, cryptocurrencies, and other assets, can fluctuate both upwards and downwards. There is a significant risk of financial loss when buying, selling, holding, staking, or investing in these instruments. SQBE makes no recommendations regarding any specific investment, transaction, or the use of any particular investment strategy.
CFDs are complex instruments and come with a high risk of losing money rapidly due to leverage. The vast majority of retail client accounts suffer capital losses when trading in CFDs. You should consider whether you understand how CFDs work and whether you can afford to take the high risk of losing your money.
Digital Assets are unregulated in most countries and consumer protection rules may not apply. As highly volatile speculative investments, Digital Assets are not suitable for investors without a high-risk tolerance. Make sure you understand each Digital Asset before you trade.
Cryptocurrencies are not considered legal tender in some jurisdictions and are subject to regulatory uncertainties.
The use of Internet-based systems can involve high risks, including, but not limited to, fraud, cyber-attacks, network and communication failures, as well as identity theft and phishing attacks related to crypto-assets.
Trade ideas

EURO STOXX 50 Is About To Drop 600 Dollars!!Based on my trading algorithms, EURO STOXX 50 is about to drop 600 dollars!
EURO STOXX 50 celebrates new ATH, due to Ukraine war abateThe European stock rally is beginning as investors have gotten optimistic about a potential ceasefire in Ukraine.
The end of the 3-years conflict was always a wild card for European equity markets. Now investors are starting to prepare for this scenario, aggressively buying energy-intensive sectors and European laggards.
While a lot of upside potential remains for some sectors, the path ahead is likely to be rapid. The benchmark Euro Stoxx 50 has rarely been this overbought in the past four years.
Some investors have been aggressively buying back their shorts on Europe, while others are diversifying out of expensive and heavily concentrated US equities. The region trades at about a 40% discount to the US and this gap has the potential to narrow. There’s also room for gains within the Stoxx Europe 600 to broaden, with just 20% of its members in overbought territory.
With the prospect of an eventual ceasefire on investors’ minds after the US and Russian leaders agreed to start negotiations, stocks geared to the reconstruction of Ukraine are in focus, like construction stocks Heidelberg Materials AG and Holcim AG as well as chemicals company BASF SE.
The strategists at Barclays Plc are overweight chemicals but are more cautious on autos, partly due to the US tariffs threat. They say construction materials have had a strong run already, while mining and steel may have more catch-up potential, along with transport and leisure.
Rebuilding Ukraine would be one of the largest construction undertakings in recent years, with total costs of nearly $500 billion, according to the World Bank. This would be highly commodity-intensive, especially for steel and cement, to restore buildings and infrastructure.
It is clearly unequivocally good news for European markets.
The EURO STOXX 50 is a stock index that represents 50 of the largest and most liquid stocks in the Eurozone. It is designed to represent blue-chip companies considered leaders in their respective sectors. The EURO STOXX 50 is one of the most liquid indices for the Eurozone.
Key facts about the EURO STOXX 50:
The index includes shares from various Eurozone countries, including Belgium, France, Finland, Germany, Italy, the Netherlands, and Spain.
France and Germany contribute to over 66% of the index.
The technology, industrial goods and services, and consumer products and services sectors account for more than 45% of the index.
The EURO STOXX 50 was introduced on February 26, 1998. Prices were calculated retroactively to 1986, with a base value of 1000 points on December 31, 1991.
The index captures about 60% of the free-float market capitalization of the EURO STOXX Total Market Index (TMI), which covers about 95% of the free-float market capitalization of the countries represented.
The EURO STOXX 50 serves as a benchmark for the Eurozone's stock market performance.
Eurex trades futures and options on the EURO STOXX 50, which are among the most liquid products in Europe and worldwide.
Technical challenge
The main 6-month graph for EURO STOXX 50 futures indicates the epic all time high (1st time over past 25 years), with a potential further upside price action.

$FESX1! EURO STOXX 50: 7 WEEKS OF GAINSEUREX:FESX1! EURO STOXX 50: 7 WEEKS OF GAINS
1/7
The EURO STOXX 50 is on track for its seventh consecutive weekly gain! 📈⚡️
This winning streak continues despite global trade war jitters and shifting market sentiment.
2/7
Why the optimism? 🤔
Investors appear cautiously confident about U.S. trade policy developments, with Europe seen as a more stable option amidst American economic uncertainties.
3/7
Key influences to watch:
• U.S. Jobs Data: Friday’s payroll numbers may affect overall risk sentiment.
• Trade War: Trump’s tariff talk + a one-month reprieve for Mexico & Canada = a temporary sigh of relief?
4/7
Currency factors also play a role. 💱
The Yen’s strength due to expected BoJ rate hikes could affect export-related optimism if the Euro shifts in tandem.
5/7
Commodities?
Gold remains steady near record peaks, signaling some investors are still seeking safe havens—even as equities rally.
6/7 What’s driving the EURO STOXX 50’s resilience?
1️⃣ Diversified European economy
2️⃣ Stable/dovish monetary policy
3️⃣ Shift to Europe as a “safer” bet
4️⃣ Combination of factors
Vote below! 👇✅
7/7
Market watchers see Europe’s diverse economic base 🏭🛍️ shielding stocks from U.S. volatility. Plus, the possibility of more accommodative European monetary policy adds extra support.

Euromarkets are BrekingOutEuroStoxx broke key resistance (with Weekly confirmation). This is a key level full of liquidity and psychology. In my view, if this is defended, only good things can come.

iFVG on FESX short for 2.5 RRBreak of FVG at London open and now an iFVG. A short from this iFVG targeting 2.5 RR

FESX & FDAX go down as ES Gapped down Yesterday i watched CME_MINI:ES1! at 5,608/06 area so many buyers over there, but fail to follow through. ES Gapped down on Asian Session. COMEX:GC1! broke high of 2 days balance, and CAPITALCOM:DXY is melting down. Seems Gold is the hedge for the fear right now.
I am short on EUREX:FESX1! and long COMEX:GC1! for now.

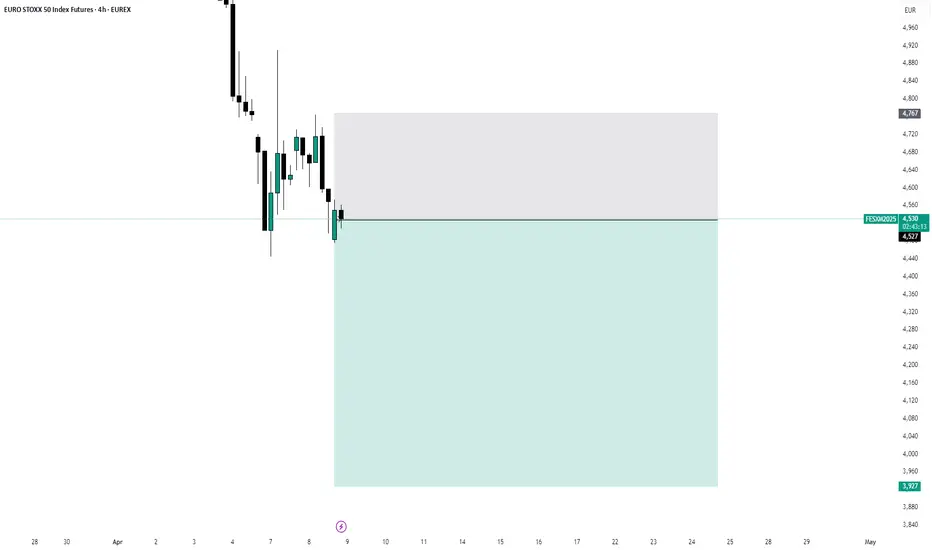
Euro Stoxx 50 Index Futures Long Trade SignalThe Down Trend Line Breakout and some other key factors of fundamental analysis assure that the next-looking scenario is a long trade now. if you love the analysis then make sure to follow me and like the post.


Euro Stoxx looking tiredEuro Stoxx futures are looking highly toppish, trading near important resistance levels, Elliott Waves targets and showing bearish momentum,
There is a possible huge downside scenario that would imply a more than 80% correction on the index, towards the 831 level.
A breakout above the recent highs, near 4513, would invalidate this view.

long position on FESXMy strtegy is based on price action with the reading of certain indicators that I like whilerespecting all the values that define the stock maket

FESX1!: MACRO TO MICRO CORRECTIONS / TRAJECTORY / EUREX MARKETDESCRIPTION: In the chart above I have made my best attempt in attempting to provide a MACRO VISUAL AID for the current state of the EUROPEAN MARKET.
POINTS:
1. DEVIATION was estimated using highest point of 5500 POINTS & LOWEST POINT OF 2000. POINTS were summed and divided by 2 giving an average and same was done for all other SUPPORTS (WHITE LINES).
2. SUPPLY & DEMAND POCKETS were placed accordingly in regards to deviation and in respect to NATURAL CHANNEL MOMENTUM.
3. NOTICE HOW MACRO CORRECTIONS OCCURRED BEFORE 2009 WHILE MICRO CORRECTIONS TEND TO OCCUR IN A MORE CONSISTENT CHANNEL AFTER 2009.
4. RSI also agrees with PAST MASSIVE CORRECTIONS & ONGOING MICRO CORRECTIONS.
5. RSI PATTERN THAT IS FOUND TO BE AT LESS OF AN INCLINE EQUATES TO A MORE STABLE MARKET RALLY.
*IMPORTANT: IF CONSISTENT PATTERNS ARE ANYTHING TO GO BY RSI INCLINE INDICATES THAT CURRENT MARKET RALLY SHOULD END AT OR AROUND JANUARY 2024. DESPITE THIS CURRENT RSI IS OVERBOUGHT AND IS LOOKING TO RETEST.
SCENARIO: WITH CURRENT OVERBOUGHT RSI LEVELS AND A RECENT REJECTION OF 4188 POINT FUTURE PRICE ACTION CAN SEE SOME DOWNTREND WITHIN CURRENT CHANNEL BEFORE WE COME TO SEE A JUMP INTO HIGHER SUPPLY & DEMAND POCKET. WITH THIS SAID 3900 IS A CRUCIAL LEVEL TO HOLD IF WE DON'T WANT TO SEE HEAVY DOWNSIDE.
FULL CHART LINK: www.tradingview.com
EUREX:FESX1!

EuroStoxx - VGA - Bearish consolidation firstHey the "whale calves" - following the nice bullish move on Stock Indices - in Europe mainly, the market needs to take a breath. Ideally, it should take place on the current level, to shape a bearish consolidation in a wave 4/ (Elliott waves prospective), before resuming the rise. The market is currently testing the upper end of its red channel, also corresponding to Fib. extentions. The short term RSI is posting a bearish divergence, showing the exhaustion of the bullish dynamic. "Play" the correction, or "wait to buy the dip". Stay Safe! Have Fun!

EURO STOXX 50 Volatility Forecast 19-24 Sep 2022EURO STOXX 50 Volatility Forecast 19-24 Sep 2022
The current implied volatility is +- 129$ from the current opening of the weekly candle, 3499$
With this in mind, we have a 80% chance that the market is going to stay within the range:
TOP: 3631
BOT: 3366
At the same time, we can see that the average weekly candle, is around 2.1 - 2.46%
From the technical analysis POV, we can see that our asset is below EMA 50/100/200.
At the same from the volume POV, we can see that currently our CMF is negative, indicating a bearish side.
Lastly, we can see that we are close to the most important resistence zone of this asset for this year, which is around 3400 so if we are not going to close below this point, there is a very high chance that the market will rebound and go towards 3500+
Otherwise if we are going to break it, we can expect a downfall movement towards 3300-.

EURO STOXX 50 FUTURES (FESX1!), H4 Potential for Bearish DropType : Bearish Drop
Resistance : 3569
Pivot: 3503
Support : 3433
Preferred Case: On the H4, with price moving below the ichimoku indicator, we have a bearish bias that price will drop to the pivot at 3503 where the pullback support is. Once there is downside confirmation that price has broken pivot structure, we would expect bearish momentum to carry price to the 1st support at 3433 where the swing low support is.
Alternative scenario: Alternatively, price could rise to 1st resistance at 3569 where the overlap resistance, 100% fibonacci projection and 38.2% fibonacci retracement are.
Fundamentals: No Major News

Stoxx short till 24 of September. till expiration of Sep16 futurStoxx short till 24 of September.
till expiration of Sep16 futures

EURO STOXX 50 FUTURES (FESX1!), H4 Potential for Bullish RiseType : Bullish Rise
Resistance : 3851
Pivot: 3742
Support : 3659
Preferred Case: On the H4, with price moving above the ichimoku indicator, we have a bullish bias that price will rise from our pivot at 3742 where the pullback support is to the 1st resistance at 3851 where the swing high resistance, 161.8% fibonacci extension and 78.6% fibonacci projection are.
Alternative scenario: Alternatively, price could break pivot structure and drop to 1st support at 3659 where the swing low support, 23.6% fibonacci retracement , -27.2% fibonacci expansion and 78.6% fibonacci projection are.
Fundamentals: As mentioned in the CPI report, US consumer inflation has eased up which leads us to have a bullish view on EURO STOXX 50 FUTURES .

EURO STOXX 50 FUTURES (FESX1!), H4 Potential for Bullish RiseType : Bullish Rise
Resistance : 3851
Pivot: 3742
Support : 3659
Preferred Case: On the H4, with price moving above the ichimoku indicator, we have a bullish bias that price will rise from our pivot at 3742 where the pullback support is to the 1st resistance at 3851 where the swing high resistance, 161.8% fibonacci extension and 78.6% fibonacci projection are.
Alternative scenario: Alternatively, price could break pivot structure and drop to 1st support at 3659 where the swing low support, 23.6% fibonacci retracement, -27.2% fibonacci expansion and 78.6% fibonacci projection are.
Fundamentals: As mentioned in the CPI report, US consumer inflation has eased up which leads us to have a bullish view on EURO STOXX 50 FUTURES.

DJ EURO STOXX 50 Futures (FESX1!), H4 Potential for Bullish RiseType : Bullish Rise
Resistance : 3851
Pivot: 3744
Support : 3659
Preferred Case: On the H4, with price moving along an ascending trendline and above the ichimoku indicator, we have a bullish bias that price will rise to our pivot at 3744 where the pullback resistance, 78.6% fibonacci retracement and 161.8% fibonacci extension are. Once there is upside confirmation of price breaking pivot structure, we would expect bullish momentum to carry price to 1st resistance at 3851 where the swing high resistance is.
Alternative scenario: Alternatively, price could drop to 1st support at 3659 where the swing low support and 61.8% fibonacci projection are.
Fundamentals: No Major News


FESX1 - DOUBLE TOP IN PROGRESS WITH BEARISH DIVERGENCE ON D1 !M1 : ATH @ 4036; Ongoing trend reversal in progress !
W1 : Bearish engulfing in progress (wait W1 closing for confirmation)
TS under attack, first significant support @ 3765 ahead of 3597, 3462 and
3326 (clouds support zone in this time frame)
D1 : Double top formation in progress coupled with a bearish divergence
trigger level @ 3882 (which should be confirmed on D1 closing basis)
A breakout of that level open the door for 3728 (DT target), which
is roughly the middle of the D1 clouds support zone
H4 : Below the clouds and currently below the former support trend line
H1 : Below the clouds. Clearly in a downtrend pattern. It is a SELL on rally
M30 : Same than H1. A sustainable move above the 3900 area would neutralise temporary
the ongoing downside risk
M15 : Same than H1 and M30, the trend is your friend...
M5 : Same than H1, M30 and M15, watch MBB currently @ 3900 as a good barometer which
will give clues for the upcoming trading hours
CONCLUSION : SWITCH MODE HAS BEEN ACTIVATED FROM A BUY ON DIPS TO A SELL ON RALLY...

dont fear to sell now99% dax,stox50 will go down to touch ema200 60min(green line) be sure this way in april will happend
we advice dont fear sell above 3825 and put bbuylimit on 3800(put sl=3765 tp=3975)
