eur nzd shortPrice is pulling back down to find area of liquidities in daily
We got first fail to swing high on H4 and we no we down to daily AOL
EURNZD trade ideas

Big drop ahead eurnzdMonth, weekly, daily overbought pair
Monthly selling zone reached
Resistance of parallel channel ahead
Next monthly big drop coming

Is EUR/NZD Setting Up The Ultimate Swing Trade Opportunity?🎭 The Great Euro Heist: EUR/NZD Cash Flow Caper
💼 Mission Brief: Operation Bull Run
Asset Under Surveillance: EUR/NZD (Euro vs Kiwi - yes, I said "Aussie" in the title for the vibes, mate 🦘)
Market: FOREX
Strategy Type: Swing/Day Trade Cash Flow Management
Risk Level: Thief Mode Activated
📊 The Intelligence Report
Market Setup: Bullish momentum confirmed! 🐂
Hull Moving Average retest looking clean
Bullish Heikin Ashi doji candle formation spotted (that's our signal, folks!)
Bulls are warming up for the ride
🎯 The Heist Plan (Entry Strategy)
The "Thief Layering" Method
We're using multiple limit orders (layering strategy) to sneak into this trade like pros:
Sell Limit Layers (Scale-In Entries):
🎯 Layer 1: 2.01000
🎯 Layer 2: 2.01500
🎯 Layer 3: 2.02000
Pro Tip: You can add more layers based on your own risk appetite and account size. The more layers, the smoother the average entry price!
Alternative Entry: Any current market price works too if you're feeling bold! 🚀
🛡️ Risk Management (The Exit Plan)
🚨 Stop Loss (Emergency Escape Route)
Thief SL: 2.00000
⚠️ Important Note: Fellow Thief OGs, this is MY stop loss level. You're the captain of your own ship! Set your SL based on your risk tolerance. Manage your money, make your money, at your own risk.
💰 Take Profit (The Getaway Target)
Target Zone: 2.05000
🚧 Market Intelligence: Police barricade (strong resistance) detected at this level + oversold conditions + potential trap zone. Smart thieves escape with the loot before things get dicey!
⚠️ Important Note: This is MY take profit target. You call the shots on when to secure your gains. Take partials, trail stops, or go full send - your vault, your rules!
🔗 Related Pairs to Watch (Correlation Play)
Keep an eye on these pairs for confirmation:
Direct Correlations:
FX:EURUSD - Euro strength indicator
OANDA:NZDUSD - Kiwi weakness/strength gauge
OANDA:AUDNZD - Trans-Tasman sibling rivalry (similar commodity currency behavior)
Inverse Correlations:
FX:USDJPY - Risk sentiment barometer
TVC:DXY (US Dollar Index) - Overall dollar strength
Key Point: If EUR is strengthening across the board AND NZD is showing weakness, our setup gets extra confirmation! 💪
🎓 Why This Setup Works
1️⃣ Technical Confluence: Hull MA + Heikin Ashi alignment = high probability setup
2️⃣ Layer Entry Strategy: Reduces risk by averaging into the position
3️⃣ Clear Risk/Reward: Defined exit points keep emotions in check
4️⃣ Cash Flow Management: Scale in, scale out = professional trade management
⚡ Quick Action Items
Set your limit orders (or enter at market)
Place your stop loss (adjust to YOUR comfort zone)
Set alerts at target level
Monitor correlated pairs for confirmation
Manage position size according to your risk tolerance
📢 Community Engagement
✨ If you find value in my analysis, a 👍 and 🚀 boost is much appreciated — it helps me share more setups with the community!
⚖️ Disclaimer
CRITICAL: This is a "thief style" trading strategy presented for entertainment and educational purposes. This is NOT financial advice. Trading FOREX involves substantial risk of loss. Past performance does not guarantee future results. Always do your own research, manage your risk properly, and never trade with money you cannot afford to lose. This analysis is shared in a fun, creative format but should be treated with the seriousness that trading requires. Trade at your own risk!
#EURNZD #FOREX #SwingTrading #DayTrading #PriceAction #TechnicalAnalysis #ForexSignals #TradingStrategy #HullMA #HeikinAshi #LayeringStrategy #RiskManagement #ForexTrading #CurrencyTrading #TradingIdeas #MarketAnalysis #ForexLife #TradingCommunity #ChartAnalysis #ForexSetup
Trade smart, stay stealthy, and may the pips be ever in your favor! 🎩💰

October 05, Forex Outlook: Key Moves to Watch This Week!Welcome back, traders!
In today’s video, we’ll be conducting a Forex Weekly Outlook, analyzing multiple currency pairs from a top-down perspective—starting from the higher timeframes and working our way down to the lower timeframes.
Our focus will be on identifying high-probability price action scenarios using clear market structure, institutional order flow, and key confirmation levels. This detailed breakdown is designed to give you a strategic edge and help you navigate this week’s trading opportunities with confidence.
📊 What to Expect in This Video:
1. Higher timeframe trend analysis
2. Key zones of interest and potential setups
3. High-precision confirmations on lower timeframes
4. Institutional insight into where price is likely to go next
Stay tuned, take notes, and be sure to like, comment, and subscribe so you don’t miss future trading insights!
Have a great week ahead, God bless you!
The Architect 🏛️📉

Bullish bounce off?EUR/NZD has bounced off the pivot, which has been identified as an overlap support that aligns with the 38.2% Fibonacci retracement and could rise to the swing high resistance.
Pivot: 2.00180
1st Support: 2.98927
1st Resistance: 2.02961
Disclaimer:
The above opinions given constitute general market commentary, and do not constitute the opinion or advice of IC Markets or any form of personal or investment advice.
Any opinions, news, research, analyses, prices, other information, or links to third-party sites contained on this website are provided on an "as-is" basis, are intended only to be informative, is not an advice nor a recommendation, nor research, or a record of our trading prices, or an offer of, or solicitation for a transaction in any financial instrument and thus should not be treated as such. The information provided does not involve any specific investment objectives, financial situation and needs of any specific person who may receive it. Please be aware, that past performance is not a reliable indicator of future performance and/or results. Past Performance or Forward-looking scenarios based upon the reasonable beliefs of the third-party provider are not a guarantee of future performance. Actual results may differ materially from those anticipated in forward-looking or past performance statements. IC Markets makes no representation or warranty and assumes no liability as to the accuracy or completeness of the information provided, nor any loss arising from any investment based on a recommendation, forecast or any information supplied by any third-party.

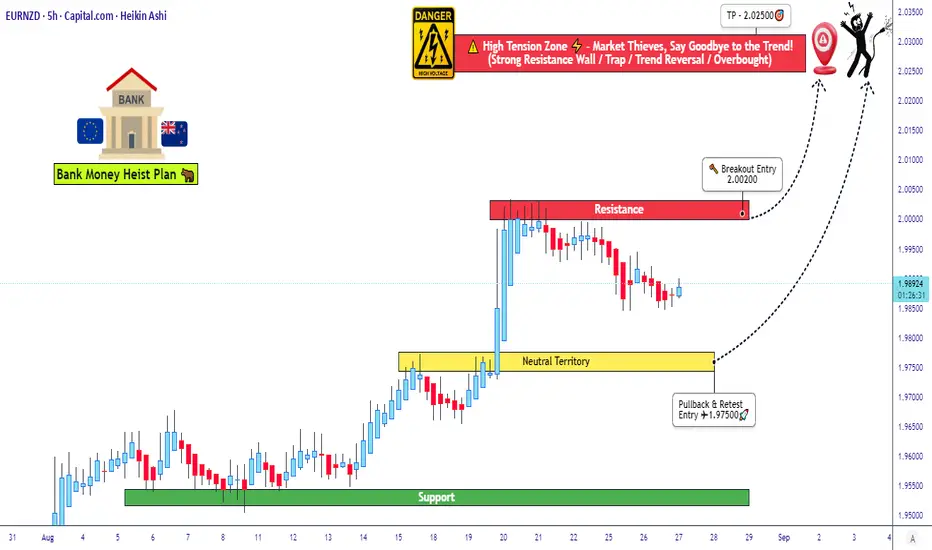
Ready To Raid This EUR/NZD Bullish Breakout With Me?🦹♂️⚡ HEIST ALERT: EUR/NZD BULLISH BREAKOUT INBOUND! ⚡🦹♂️
Asset: EUR/NZD "Euro vs Kiwi" Forex Bank (Swing/Day Heist)
Plan: BULLISH (Pending Order Layering Plan)
🎯 THE MASTER PLAN:
Dear Money Makers & Robbers! 🤑💰 Based on the 🔥Thief Trading Style Analysis🔥, we are plotting a BULLISH HEIST on the Euro vs Kiwi bank! Our intel suggests a major breakout is brewing. Time to load up and ride the lightning! ⚡
📍 ENTRY - THE HEIST IS ON!:
⚡ Phase 1: Breakout Entry @ 2.00200
Wait for the level to get SMASHED! Set a BUY STOP order to catch the explosive move.
♻️ Phase 2: Pullback & Layer Entry @ 1.97500 & ABOVE
True Thief style! We use LAYERS! After the breakout, place BUY LIMIT orders on any pullback toward 1.97500. This is how the pros stack the cash! 💵💵
📢 YO, LISTEN UP! 🗣️ Set a TRADINGVIEW ALARM 🔔 at 2.00200! Don't miss the breakout signal. A true thief is always prepared!
🛑 STOP LOSS - PROTECT THE BOOTY:
• Breakout Entry SL: This is the Thief's secret SL @ 1.99000
• Pullback/Layer Entry SL: Place your hideout @ 1.96000
📌IMPORTANT INSTRUCTION: Do NOT place your stop loss until AFTER the breakout or pullback entry is triggered! Place it only after you're in the trade. Adjust your final SL based on your own risk and strategy, you rebellious pirates! 🏴☠️⚠️
🎯 TARGET - ESCAPE WITH THE LOOT:
• Final Target: @ 2.02500 🎯
The top is a high-voltage area! ⚡ The market will be overbought and the guards will be alert. Take your stolen profits and ESCAPE before the trend reverses! Don't get greedy! Cash out and treat yourself, you deserve it! 🏆💸🍾
⚠️ GENERAL ORDERS:
• News Releases: Avoid new trades during high-impact news. Manage your running positions! 📰🗞️
• This is not personalized advice. This is our heist plan. Your risk is your own! 👊
• Boost this idea! 💥 Hit the Boost Button 💥 to support the crew and help us plot more profitable heists! 🚀🤝❤️
I'll see you at the target, thieves! Stay tuned for the next score! 🤑👊
#Forex #Trading #EURNZD #TradingPlan #PriceAction #SwingTrading #DayTrading #ForexSignals #Breakout #Bullish #Buy #TechnicalAnalysis #ThiefTrader #ForexLife #Profit #Investing #AlgorithmicTrading #SwingTrade
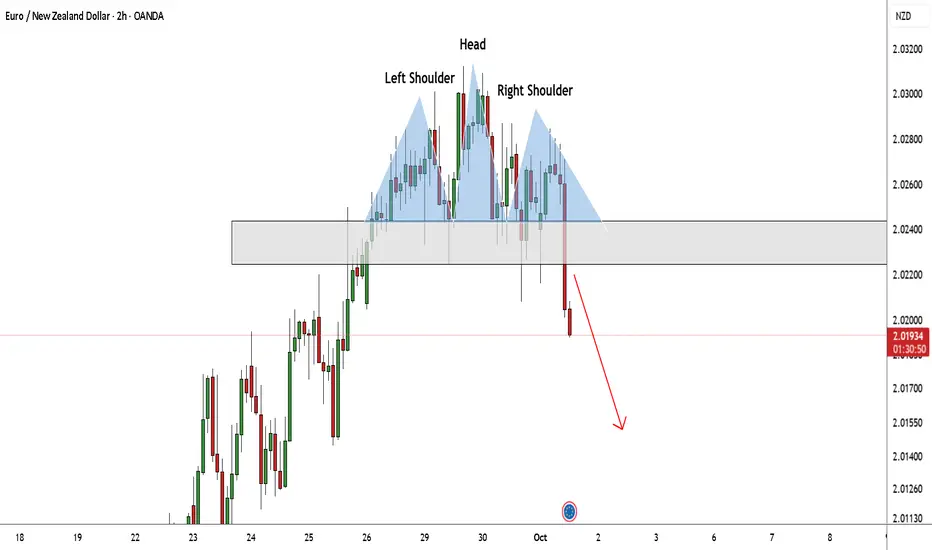
EUR/NZD Created H&S Pattern ,Short Setup Valid To Get 200 Pips !Here is my 2H Chart On EUR/NZD , The price creating a very clear reversal pattern ( head and shoulders pattern ) and the price made a very good bearish price action now from good res area so we can enter a sell trade now Or Waiting the price to go back to retest the broken neckline and targeting from 100 : 150 pips , the price go up very hard without any correction so i think the price will go down very hard also . if we have a daily closure above my neckline then this idea will not be valid anymore .
Reasons To Enter :
1- Perfect Reversal Pattern ( Head & Shoulders ) .
2- Clear Bearish Price Action .
3- Bigger T.F Giving Good Bearish P.A .
4- The Price Closed Below Neckline .
5- Perfect 4H Closure .
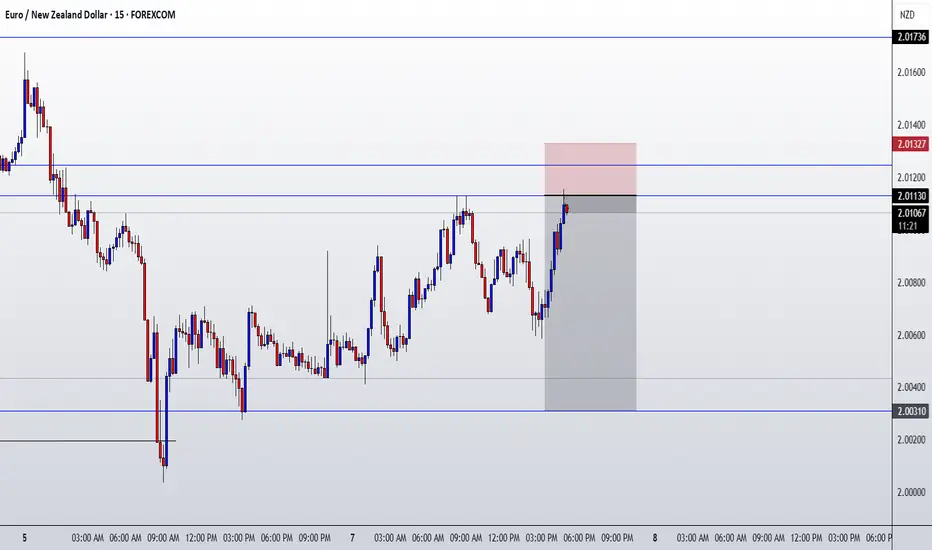
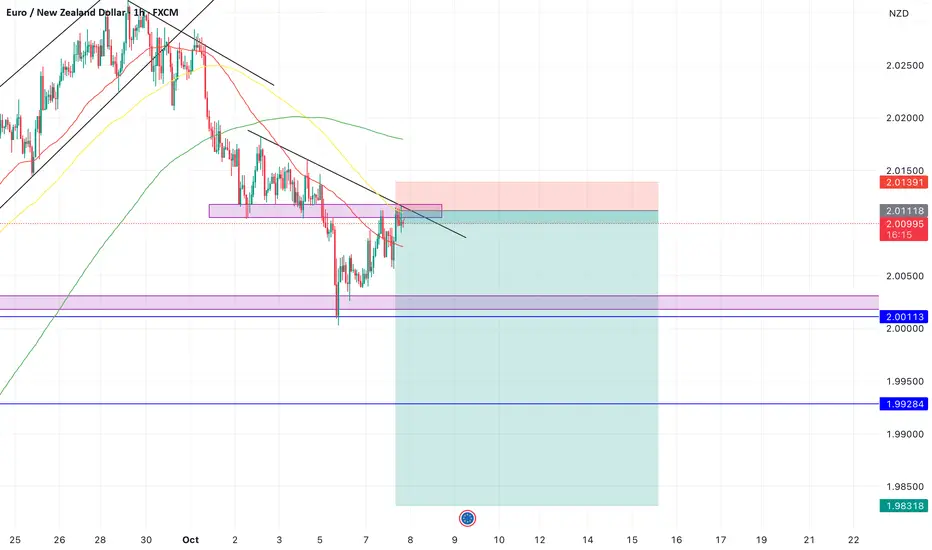
EURNZD Price is currently in a bearish momentum. With price pulling back and retesting the 2.01150 area, I’m going for a long short. Looking for possible retests at 2.00113 and 1.99284.
Trade Idea: Short EUR/NZD (Swing TradeThis setup is a classic harmonic-driven short trade, executed on the H4 timeframe with a broader outlook extending into the D1 chart. The chart showcases a well-formed bearish harmonic pattern—likely a Gartley or Bat—anchored at points X, A, B, C, and D. The completion of the pattern at point D aligns with a key resistance zone, suggesting a potential reversal and bearish momentum ahead.
📉 Entry, Stop-Loss, and Target
- Entry Zone: Around 2.0070–2.0173, where price has recently tested the harmonic completion and shown signs of rejection.
- Stop-Loss (SL): 2.0135, placed just above the pattern’s invalidation point and recent swing high to protect against false breakouts.
- Target Zone: 1.9920 to 1.9956, which coincides with a clearly marked Demand Zone on the chart. This area has historically attracted buying interest and could act as a strong support level.
📊 Risk/Reward Profile
This trade offers a Risk/Reward ratio greater than 2, which is ideal for swing setups. With a relatively tight stop and a well-defined target zone, the trade balances risk prudently while aiming for a meaningful reward. The smaller green box within the setup visually confirms this favorable RR profile
🔍 Technical Confluence
- Bearish Harmonic Pattern: Suggests exhaustion of bullish momentum and a high-probability reversal.
- Demand Zone Target: Acts as a magnet for price, supported by historical buying pressure.
- Candlestick Structure: Recent price action shows rejection wicks and bearish candles near the entry zone, reinforcing the short bias.
- Timeframe Synergy: H4 chart provides precision for entry and SL, while the D1 chart supports the broader swing outlook.
🧭 Trade Management Tips
- Monitor price behavior as it approaches the demand zone—partial profit-taking near 1.9956 could be wise.
- If momentum accelerates, consider trailing the stop to lock in gains.
- Avoid over-leveraging; this setup is technically sound but still subject to macroeconomic volatility.

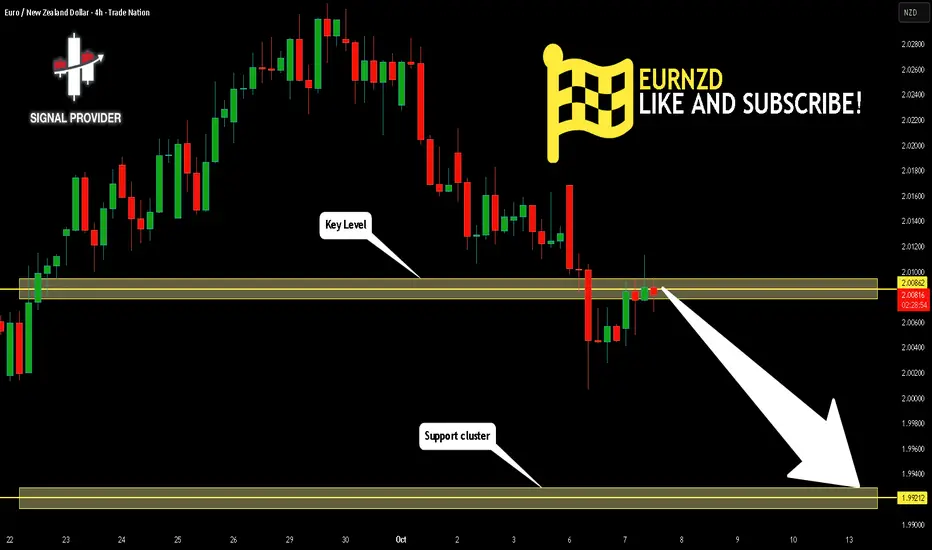
EURNZD Will Go Lower! Short!
Take a look at our analysis for EURNZD.
Time Frame: 4h
Current Trend: Bearish
Sentiment: Overbought (based on 7-period RSI)
Forecast: Bearish
The market is approaching a key horizontal level 2.008.
Considering the today's price action, probabilities will be high to see a movement to 1.992.
P.S
The term oversold refers to a condition where an asset has traded lower in price and has the potential for a price bounce.
Overbought refers to market scenarios where the instrument is traded considerably higher than its fair value. Overvaluation is caused by market sentiments when there is positive news.
Like and subscribe and comment my ideas if you enjoy them!
#EURNZD:Price accumulated now time for distribution! Price completed accumulated and now we expecting a strong bullish price distribution. Next week we can see price going and crossing our target with strong bullish volume kicking in the market. Price may go beyond 2.20 region; let's see how it goes.
Good luck and trade safe!
Team Setupsfx_

eurnzdThe pair has been delivering Bullish momentum for years. Seem to be resuming the bullish trend. Trading the Monthly will give you good return.


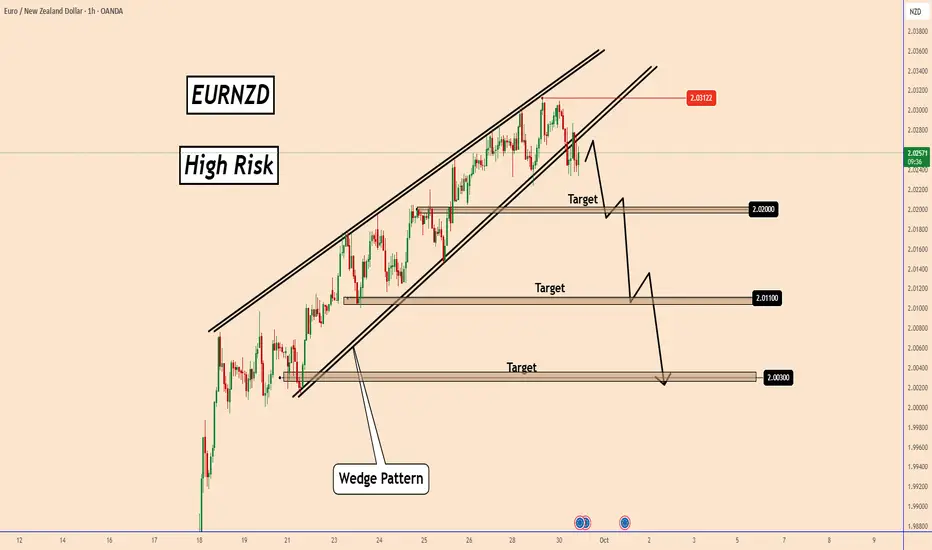
EURNZD: Rising Wedge Signals Potential ReversalEURNZD: Rising Wedge Signals Potential Reversal
The price is moving within a rising wedge pattern, which usually signals a potential bearish reversal.
Recently, the price reached 2.0300, marking a new all-time high that dates back to November 2009. Overall, the EURO is very overvalued.
If the wedge pattern holds this time, then the main targets are as follows:
2.0200.
2.0110
2.0030.
NZD weakness was attributed to the New Zealand economy not performing as expected, according to the RBNZ. I can't say if this is true, because the current economic situation is a mess in all major economies due to Trump's tariffs.
You may find more details in the chart!
Thank you and Good Luck!
❤️PS: Please support with a like or comment if you find this analysis useful for your trading day❤️
EURNZD-SellFor supporting reasoning please refer to NZDCHF-Buy
Approach EVERY trade with caution because there is no definite direction as of right now.
EURNZD is attempting a short position but is the market ready to take a risk with NZD 🤷🏽♀️.
Find out next time on NKEcommerce. Have Prosperous Trades and God Bless 🙏🏾

21-09-2025 _ Short Term Bullish Idea _ EURNZD H11- Price is in an Up Trend.
2- Price is consolidating after an impulsive move to the Up Side.
3- Place Buy Stop at the break of the consolidation.

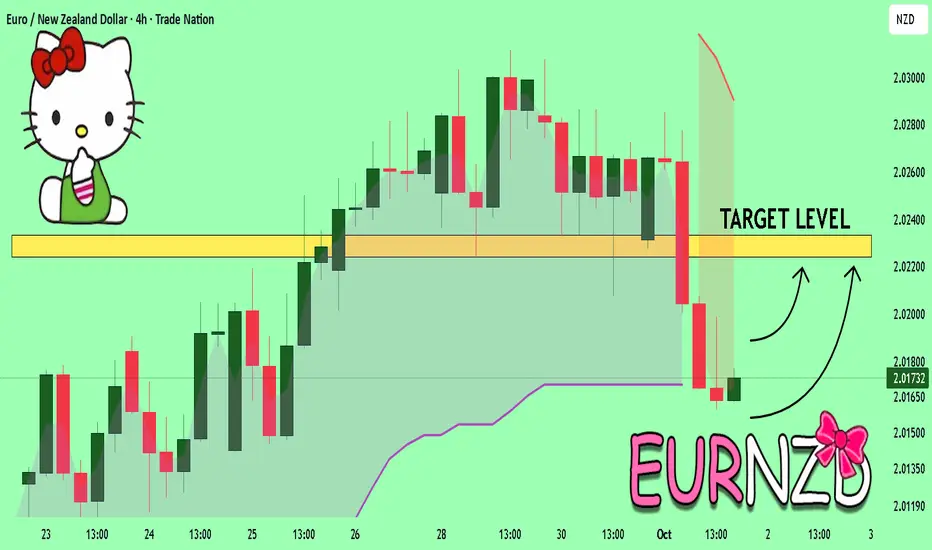
EUR-NZD Bearish Breakout! Sell!
Hello,Traders!
EURNZD price has broken down from a rising wedge structure, signaling Smart Money shift from accumulation to distribution. SMC suggests bearish momentum towards the 2.0180 target zone. Time Frame 2H.
Sell!
Comment and subscribe to help us grow!
Check out other forecasts below too!
Disclosure: I am part of Trade Nation's Influencer program and receive a monthly fee for using their TradingView charts in my analysis.

EURNZD SENTIMENTS 98 % SHORT trend : bullish
divergence : bearish
sentiments : 98% short
black trendline = 4H channel
purple trendlines = 1H
rising wedge pattern
Bias : Bearish
entry : 2.01977
stoploss : 2.03542
target : 1:2 ( 1.98801 )
will book 70% profit at TP1 @ 2.00344

EURNZD The Target Is UP! BUY!
My dear subscribers,
EURNZD looks like it will make a good move, and here are the details:
The market is trading on 2.0172 pivot level.
Bias - Bullish
Technical Indicators: Both Super Trend & Pivot HL indicate a highly probable Bullish continuation.
Target - 2.0224
About Used Indicators:
The average true range (ATR) plays an important role in 'Supertrend' as the indicator uses ATR to calculate its value. The ATR indicator signals the degree of price volatility.
Disclosure: I am part of Trade Nation's Influencer program and receive a monthly fee for using their TradingView charts in my analysis.
———————————
WISH YOU ALL LUCK
Strong sell eurnzdStrong bullish correction completed
Weekly, daily, monthly, overbought
Trading in a strong bullish channel but uper resistance of channel reached


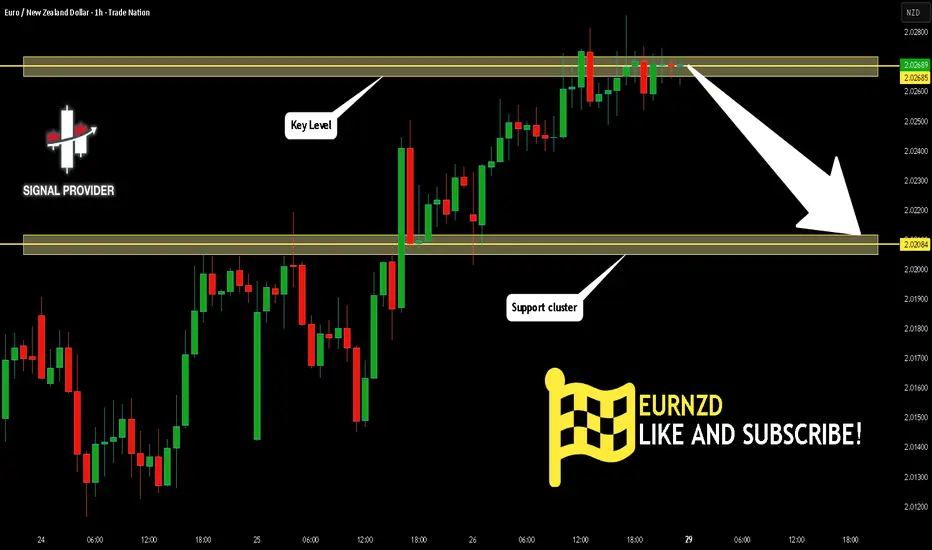
EURNZD Will Fall! Short!
Please, check our technical outlook for EURNZD.
Time Frame: 1h
Current Trend: Bearish
Sentiment: Overbought (based on 7-period RSI)
Forecast: Bearish
The market is trading around a solid horizontal structure 2.026.
The above observations make me that the market will inevitably achieve 2.020 level.
P.S
Overbought describes a period of time where there has been a significant and consistent upward move in price over a period of time without much pullback.
Like and subscribe and comment my ideas if you enjoy them!
EURNZD ENTRY CHARTWe are still BEARISH on this Pair, we have the Trend still pointing to the Down-side,Intra-day trend still BEARISH,then we switched to our structure TF, mark out our Valid zones with other confluences, then we switch to our ENTRY TF, to look for our PATTERN and FORMATION, if this matches with your Trade Idea, Kindly Apply a good risk management on this Trade, we will share our UPDATE in this NOTE SESSION, THANK YOU