EURNZD 1H TECHNICAL ANALYSISOVERALL TREND
📉 Bearish — price rejected near 1.9900
— forming lower highs with downside potential
🔴 SELL ORDERS
🔴 Sell Order 1: 1.9865
🔴 Sell Order 2: 1.9855
🎯 TARGET / TAKE PROFIT
💰 TP: 1.9800 (support + take profit zone)
🔴 STOP LOSS
🔻 SL: 1.9900 (above rejection zone)
🟢 SUPPORT ZONES
🟢 1.9800 — Immediate profit-taking level
🟢 1.9783 — Major support (watch for bounce)
✍️ STRUCTURAL NOTES
Sellers defending 1.9900, creating a clean bearish rejection.
Entry staggered with Sell Orders at 1.9865 & 1.9855.
Take profit aligned with demand/support around 1.9800.
Break below 1.9783 could extend the drop.
📊 TRADE OUTLOOK
Bias = Bearish toward 1.9800
SL tight at 1.9900 to protect against reversal
Risk/Reward favorable (~1:2)
⚡ SIGNAL FORMAT
PAIR: EURNZD
SELL STOP: 1.9865
SELL STOP: 1.9855
TP: 1.9800
SL: 1.9900
Trade ideas

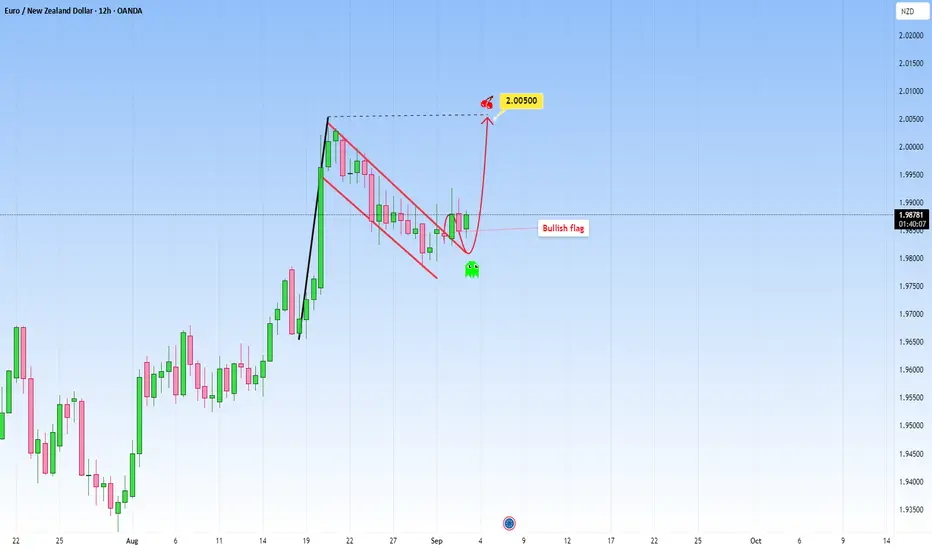
EURNZD: Rose steadily and created a Bullish FlagEURNZD looks quite interesting at the moment. Price rose to the upside steadily and now seems to have created a well known pattern: a bullish flag.
My expectation is for the price to continue, but first I would wait for a full strong candle to confirm the signal. I would target 2.00500.
If, on the other hand, price will decline below the flag, that would invalidate the continuation, and we can expect a short-term pullback incoming.
What do you think?
EURNZD BuyThe most logical way to consolidate at the bottom of the ascending channel is to consider buying trades.

EURNZD Daily Analysis: Watching Support for a Bullish Break💶🇳🇿 EURNZD on the daily timeframe is clearly in a bullish trend 📈.
Right now, price is experiencing a deep pullback 🔽, and I’ll be watching closely to see if it holds at the key support level 🛑📊.
If we get a bullish break of structure 🔓🟢 from here, it could open up a long opportunity 🎯🚀.
⚠️ This is for educational purposes only and not financial advice 📚

EURNZD | Bearish ContinuationEURNZD is in bearish trend.It is printing LHs and LLs and there is no divergence on the RSI.It is also not forming any reversal pattern so far.

China strengthens, commodity demand, equities showing risk onToday I avoid USD since it's bank holiday. Though there are some good set ups for selling USD. Also in US indexes buys. NZD and AUD are good for buys after China's economy appreciates. With Oil rally and Equities, global market have shown risk appetite.
Euro is weak due to slowing Eurozone growth and cautious ECB policy, while the New Zealand dollar is supported by strong commodity exports and relatively higher interest rates

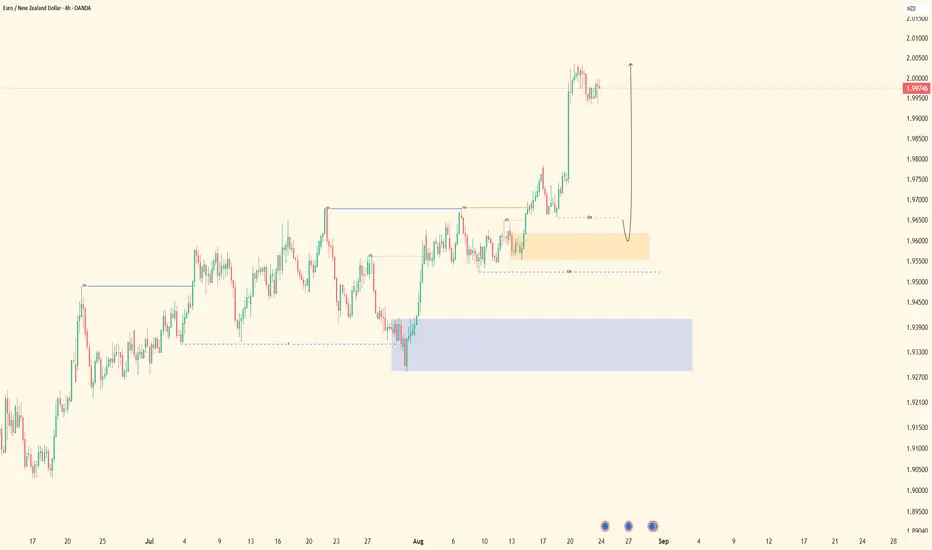
EURNZD Demand ZoneEURNZD has been bullish and it formed a demand zone
We are waiting to come down to this demand zone and go up

EURNZD | Bullish Bias - Waiting on Courtyard Liquidity Slash🔹 HTF (4H): Structure is clean and bullish with strong momentum holding to the upside.
🔹 MTF (30M): Looking for continuation longs. Waiting for that sell-side liquidity (courtyard) to be cleared and price to tap into my refined OB zone.
🔹 LTF (5M): Once price reaches the OB, I’ll wait for confirmations before committing to longs. No confirmation, no trade.
🔹 Execution Plan: Patience until OB mitigation — only then will I engage longs toward the highs.
🔹 Mindset Note: Smart money reveals the hand, we follow with precision.

EUR NZD SHORT RESULTS.Price held the selling pressure, broke down the support and retest it successfully to continue down.
First I missed entry from the top by my entry zone, and took the short again from the lower level and it moved just as predicted
_THE_KLASSIC_TRADER_.💪🔥

EURNZD buy zone The euro nzd looks to be hitting a buy zone from the pullback, this area looks very strong for the next leg up of the uptrend on the 4 hr chart 1.98075 looks a good buy point i would expect . Look here for confirmation candles 🕯 😍

EURNZD On The Rise! BUY!
My dear friends,
Please, find my technical outlook for EURNZD below:
The instrument tests an important psychological level 1.9849
Bias - Bullish
Technical Indicators: Supper Trend gives a precise Bullish signal, while Pivot Point HL predicts price changes and potential reversals in the market.
Target - 1.9865
Recommended Stop Loss - 1.9839
About Used Indicators:
Super-trend indicator is more useful in trending markets where there are clear uptrends and downtrends in price.
Disclosure: I am part of Trade Nation's Influencer program and receive a monthly fee for using their TradingView charts in my analysis.
———————————
WISH YOU ALL LUCK

EUR/NZD BEARISH BIAS RIGHT NOW| SHORT
Hello, Friends!
We are now examining the EUR/NZD pair and we can see that the pair is going up locally while also being in a uptrend on the 1W TF. But there is also a powerful signal from the BB upper band being nearby, indicating that the pair is overbought so we can go short from the resistance line above and a target at 1.960 level.
Disclosure: I am part of Trade Nation's Influencer program and receive a monthly fee for using their TradingView charts in my analysis.
✅LIKE AND COMMENT MY IDEAS✅

Potential bearish drop?EUR/NZD is reacting off the pivot and could drop to the 1st support which acts as an overlap support that aligns with the 50% Fibonacci retracement.
Pivot: 1.99253
1st Support: 1.96745
1st Resistance: 2.00336
Risk Warning:
Trading Forex and CFDs carries a high level of risk to your capital and you should only trade with money you can afford to lose. Trading Forex and CFDs may not be suitable for all investors, so please ensure that you fully understand the risks involved and seek independent advice if necessary.
Disclaimer:
The above opinions given constitute general market commentary, and do not constitute the opinion or advice of IC Markets or any form of personal or investment advice.
Any opinions, news, research, analyses, prices, other information, or links to third-party sites contained on this website are provided on an "as-is" basis, are intended only to be informative, is not an advice nor a recommendation, nor research, or a record of our trading prices, or an offer of, or solicitation for a transaction in any financial instrument and thus should not be treated as such. The information provided does not involve any specific investment objectives, financial situation and needs of any specific person who may receive it. Please be aware, that past performance is not a reliable indicator of future performance and/or results. Past Performance or Forward-looking scenarios based upon the reasonable beliefs of the third-party provider are not a guarantee of future performance. Actual results may differ materially from those anticipated in forward-looking or past performance statements. IC Markets makes no representation or warranty and assumes no liability as to the accuracy or completeness of the information provided, nor any loss arising from any investment based on a recommendation, forecast or any information supplied by any third-party.

EUR/NZD Daily AnalysisWith price back at the big number 2.0000, will we see another rejection like we did in April 2025 or is your bias to the upside?
Sellers could look for a break of the trendline and a correction or a possible double top before selling off.
Are you a buyer or a seller?

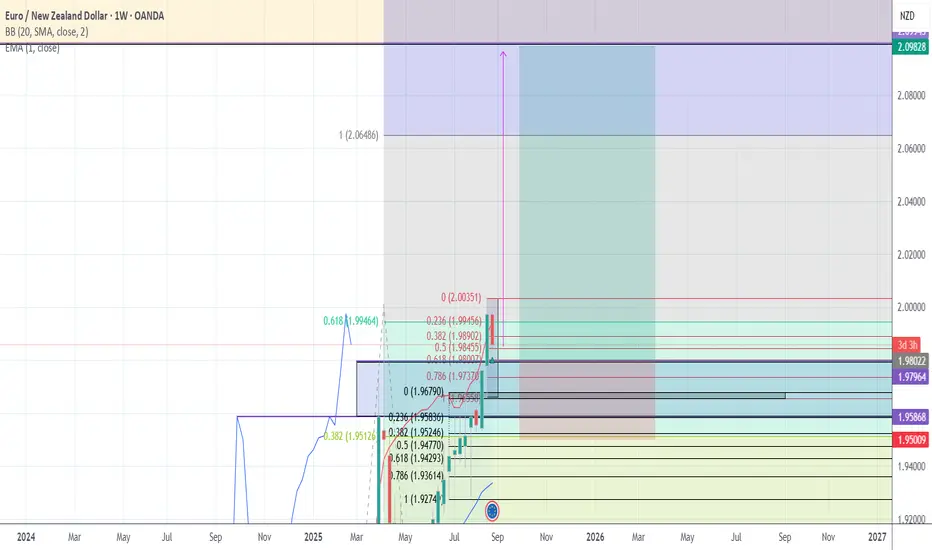
MTF Fibonacci Analysis-Yearly/Monthly/WeeklyMulti-timeframe analysis using Fibonacci retracement.
The black Fibonacci is drawn from the monthly closed candle (higher timeframe trend).
The red Fibonacci is drawn from the weekly closed candle (shorter-term retracement).
Key Levels:
0.236 (1.9945) → first resistance
0.382 (1.9890) & 0.5 (1.9850) → intermediate support zones
0.618 (1.9804) → main support level
0.786 (1.9737) → critical support; a break below may extend towards 1.9670 – 1.9520
If support holds, the next bullish target is around 2.00 – 2.0648 (Fibo extension)
Position Management:
Stop Loss is placed just below the previous closed weekly candle (weekly spike).
A trailing stop of 1–1.5 ATR is used, always adjusted below the latest weekly spike.
This provides protection while letting the trend run.
Partial profits can be taken near 2.00, while the main bullish target remains 2.06 (Fibo extension).
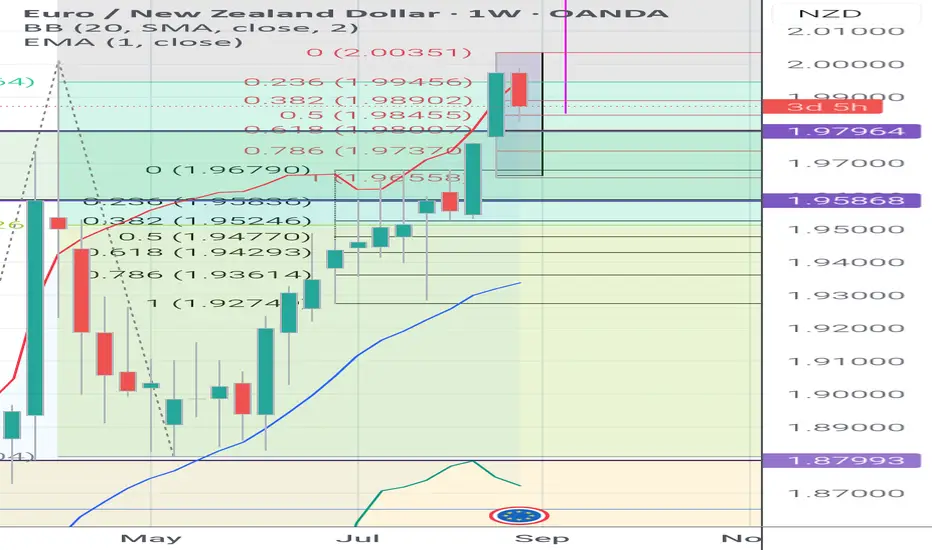
EURNZD - Breakout & Fibonacci Extension Targets EURNZD is moving in a strong uptrend, confirmed by both weekly & monthly closes above the 1.96-1.98 zone.Fibonacci retracement shows price holding above the 0.382 and 0.618 levels.A clear breakout above 2.00-2.12zone(fib extraction targets). Risk management: Trailing stop under each weekly candle (1-1.5ATR).As long as weekly closes stay above 1.96,the bullish momentum remains intact.
EURNZD and pullback 250-300 pipsEURNZD if it continues to pull back could fall 250-300 pips to the lower line of the bullish channel. There we can expect new support for a return to the bullish trend.

EURNZD Eyes 1.99 — Technical & Fundamental Bulls AlignedToday, I want to analyze EURNZD ( OANDA:EURNZD ) for you, which is in good shape both technically and fundamentally .
Please stay with me.
EURNZD is moving close to the Support zone(1.88750 NZD-1.7970 NZD) and 100_SMA(Daily) and has managed to form a Double Bottom Pattern .
From the perspective of Elliott Wave theory , EURNZD seems to have completed the main wave 4 , and we should wait for the main wave 5 . The main wave 5 could complete at the Heavy Resistance zone(2.120 NZD-1.9927 NZD) .
-----------------------------------
EURNZD – Fundamental Analysis:
The EURNZD pair currently reflects a divergence between two very different economic outlooks.
Eurozone (EUR):
The European Central Bank (ECB) has recently begun cutting interest rates to support slowing economic activity, especially in the industrial and manufacturing sectors. Despite this dovish shift, inflation remains relatively under control, and the euro has held up well against riskier currencies thanks to global uncertainty and safe-haven flows.
New Zealand (NZD):
New Zealand's economy is under pressure. The latest GDP figures confirmed a weak growth outlook, and signs of a technical recession are mounting. While the Reserve Bank of New Zealand (RBNZ) has maintained a relatively hawkish tone, it faces a dilemma: inflation is sticky, but domestic demand and housing remain fragile. The RBNZ may be forced to soften its stance sooner than expected.
Outlook:
This fundamental backdrop supports a bullish bias for EURNZD. The euro’s relative stability versus the increasingly vulnerable New Zealand dollar makes this pair attractive for long positions — especially if upcoming NZ data disappoints or global risk sentiment weakens further.
-----------------------------------
Based on the above explanation, I expect EURNZD to rise to at least 1.9917 NZD .
Note: Stop Loss(SL): 1.8779 NZD
Please respect each other's ideas and express them politely if you agree or disagree.
Euro/New Zealand Dollar Analyze (EURNZD), Daily time frame.
Be sure to follow the updated ideas.
Do not forget to put a Stop loss for your positions (For every position you want to open).
Please follow your strategy and updates; this is just my Idea, and I will gladly see your ideas in this post.
Please do not forget the ✅' like '✅ button 🙏😊 & Share it with your friends; thanks, and Trade safe.

eurnzd sell signal. Don't forget about stop-loss.
Write in the comments all your questions and instruments analysis of which you want to see.
Friends, push the like button, write a comment, and share with your mates - that would be the best THANK YOU.
P.S. I personally will open entry if the price will show it according to my strategy.
Always make your analysis before a trade
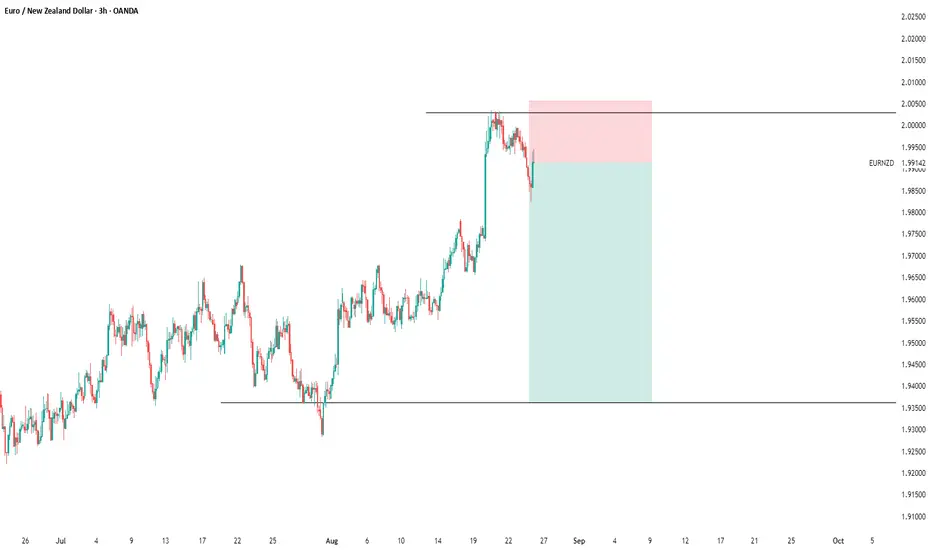
EURNZD Wave Analysis – 25 August 2025- EURNZD reversed from the round resistance level 2.0000
- Likely to fall to support level 1.9800
EURNZD currency pair recently reversed from the resistance area between the round resistance level 2.0000 (former multi-month high from April) and the upper daily Bollinger Band.
This resistance area was further strengthened by the upper resistance trendline of the daily up channel from the start of June.
Given the strength of the resistance level 2.0000 and the overbought daily Stochastic, EURNZD currency pair can be expected to fall to the next support level 1.9800.

EURNZD Massive Long! BUY!
My dear followers,
This is my opinion on the EURNZD next move:
The asset is approaching an important pivot point 1.9922
Bias - Bullish
Safe Stop Loss - 1.9911
Technical Indicators: Supper Trend generates a clear short signal while Pivot Point HL is currently determining the overall Bearish trend of the market.
Goal - 1.9946
About Used Indicators:
For more efficient signals, super-trend is used in combination with other indicators like Pivot Points.
Disclosure: I am part of Trade Nation's Influencer program and receive a monthly fee for using their TradingView charts in my analysis.
———————————
WISH YOU ALL LUCK

2025_08_25 Bear Flag on EURNZDAfter a push up, it looks like the pair is consolidating and forming bear flag. On the breakout @ 1.9997, tp is 2.0166 and sl @ 1.98444.

EURNZD| Bullish Structure With Continuation SetupPair: EURNZD
Bias: Bullish
HTF Overview (4H): External structure was broken to the upside with strong momentum, confirming bullish intent.
MTF Confirmation (30M): Anticipating continuation. Waiting for a sweep of sell-side liquidity into the area of interest. Once mitigation occurs, I’ll look to LTF confirmations for refined entry signals.
Entry Zone (5M): Entry planned after a lower high break and pullback confirmation.
Targets:
• TP1 = 5M highs
• TP2 = 30M highs (depending on market delivery)
Mindset Note: Strong momentum sets the tone, but the sweep provides the insurance — patience before execution.