QuantSignals V3: AAL Neutral-to-Bearish Intraday MoveAAL QuantSignals Katy 1M Prediction 2025-11-20
Prediction Type: 1-Month (Katy AI)
Current Price: $12.47
Trend: NEUTRAL
Confidence: 55%
Volatility: 42.9%
Trade Signal: SHORT
Entry: $12.47
Target: $12.42
Stop Loss: $12.66
Expected Move: -0.52%
Technical Summary:
Price near current neutral rang
Key facts today
Next report date
—
Report period
—
EPS estimate
—
Revenue estimate
—
0.778 EUR
817.22 M EUR
52.37 B EUR
649.83 M
About American Airlines Group, Inc.
Sector
Industry
CEO
Robert D. Isom
Website
Headquarters
Fort Worth
Founded
2013
ISIN
US02376R1023
FIGI
BBG00HLHCLC8
American Airlines Group, Inc. is a holding company, which engages in the operation of a network carrier through its principal wholly owned mainline operating subsidiary, American. The firm offers air transportation for passengers and cargo. It operates through the following geographical segments: Domestic, Latin America, Atlantic, and Pacific. The company was founded on December 9, 2013, and is headquartered in Fort Worth, TX.
Related stocks

The American Fall Key risk factors
Weak earnings and guidance
The company reported a third-quarter net loss of about $111 million (≈ $0.17 per share) excluding special items.
full-year adjusted EPS outlook is low (between ~$0.65 and ~$0.95) and constrained, which has analysts signalling risk.
American Airlines N

$AAL Bearish below $12 and 20 MA?The US Gov't shutdown continues to have major knock-on effects. One of them being disruption to airlines due to the Air Traffic Controllers being out of work. This adds to an overall bearishness across aviation/defence/airline stocks.
American Airlines has earnings before the open on Thursday. Look

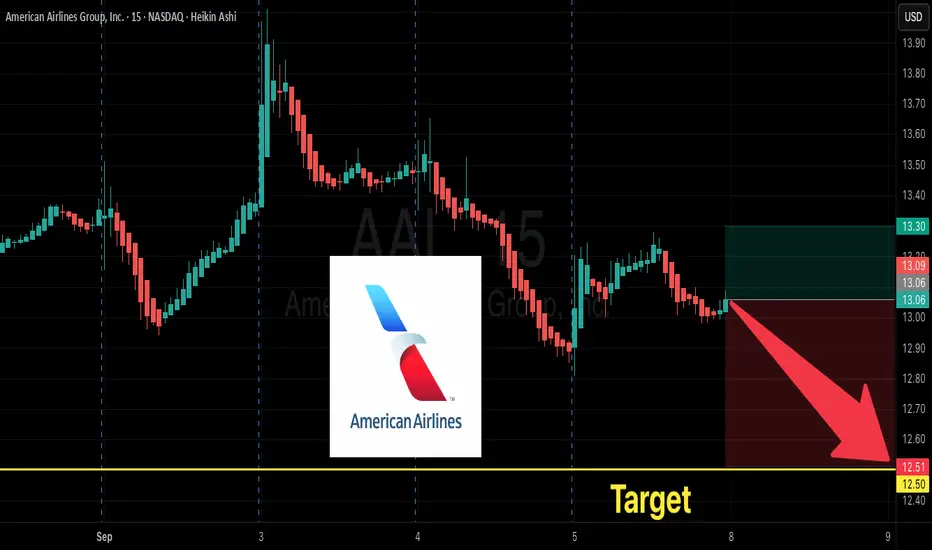
AAL Breakdown Setup — $12.50 PUT Trade Idea!
# 🐻 AAL Weekly Bearish Setup — \$12.50 PUT 🎯 (Sep 12 Expiry)
📊 **Summary**
* **Momentum:** Daily RSI 53.4 falling, Weekly RSI 64.4 falling → downside tilt.
* **Volume:** +30% on a red week → institutional distribution.
* **Options Flow:** Call/Put ratio 1.65 (bullish flow) but likely **retail/cov
$AAL another short term mover? Up to $18-19?NASDAQ:AAL has a similar chart to NASDAQ:INTC right before it started moving just in terms of momentum on the 1D, 2D, and 1W (which all recently turned bullish). Again, feel like this move could be news related, being I'm looking for is a large move in a relatively short time period.
What I'm lo

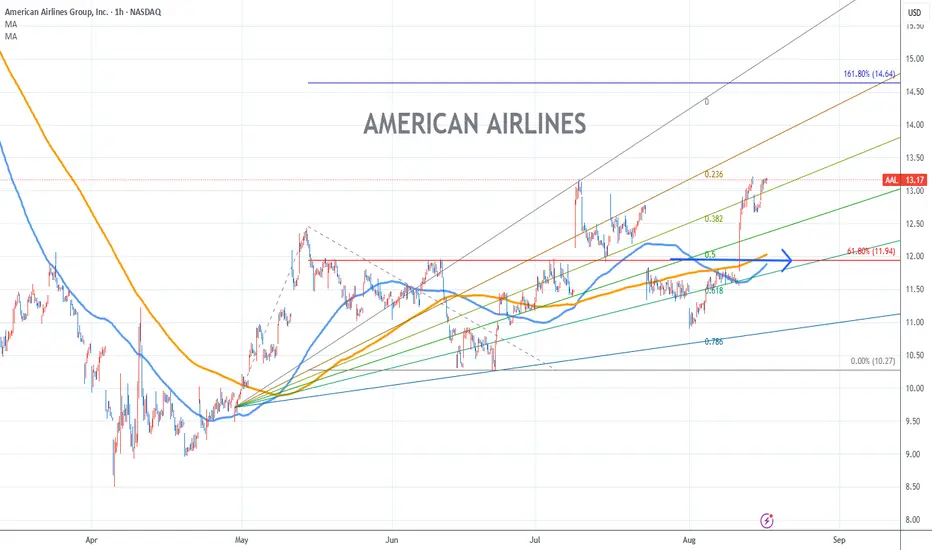
American Airlines Stock Chart Fibonacci Analysis 081525Trading Idea
1) Find a FIBO slingshot
2) Check FIBO 61.80% level
3) Entry Point > 12/61.80%
Chart time frame:B
A) 15 min(1W-3M)
B) 1 hr(3M-6M)
C) 4 hr(6M-1year)
D) 1 day(1-3years)
Stock progress:A
A) Keep rising over 61.80% resistance
B) 61.80% resistance
C) 61.80% support
D) Hit the bottom
E)
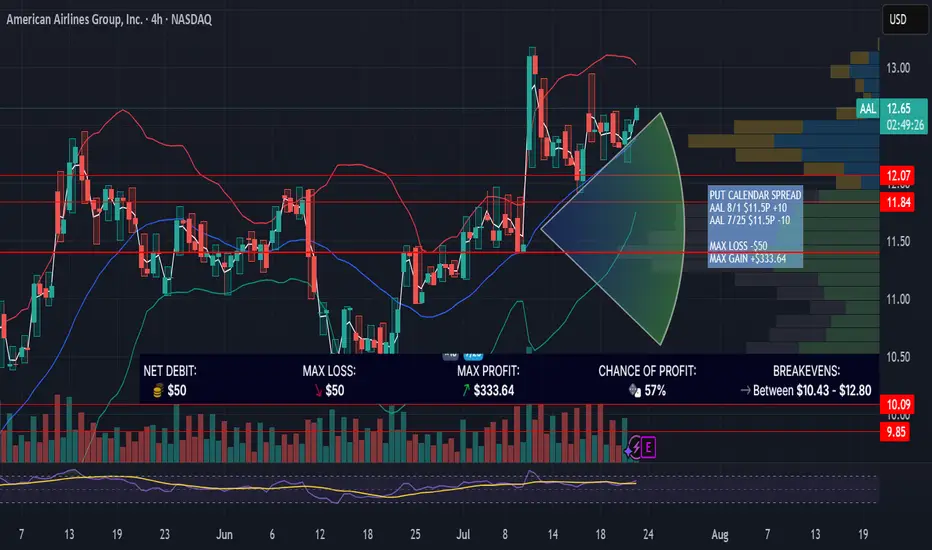
AAL PUT CALENDAR SPREAD / EARNINGSAAL is up 11% since 7/9/25 with a gap up riding on earnings of its competitor DAL. AAL earnings are in the morning on 7/24/25. Looking for a "sell the news" event with a good risk/reward options trade. This trade is designed for price to settle near the high volume node at $11.50 near expiration on
$AAL – Turbulence Over? Prepping for Altitude Reclaim (13.76+ Ta✈️ 📅 Date: July 3, 2025 | 🧠 Source: VolanX Hybrid Predictor + SMC Confluence
📍 WaverVanir International LLC
🧭 Macro Backdrop
Fed on Pause, Dollar Cooling → Creates tailwinds for airlines by lowering hedging costs and boosting consumer demand.
Jet Fuel Prices Stable → Crude hovering under $85 keeps

Upside soon Little consolidation on golden zone area for a while. I am leaning more towards the upside with 1st target of fib 1 @ 14, 2nd target w/ fib 1.6 @ 18 and final @ 25

American Airlines Stock Chart Fibonacci Analysis 061625Trading Idea
1) Find a FIBO slingshot
2) Check FIBO 61.80% level
3) Entry Point > 10.6/61.80%
Chart time frame:B
A) 15 min(1W-3M)
B) 1 hr(3M-6M)
C) 4 hr(6M-1year)
D) 1 day(1-3years)
Stock progress:A
A) Keep rising over 61.80% resistance
B) 61.80% resistance
C) 61.80% support
D) Hit the bottom
E

See all ideas
Summarizing what the indicators are suggesting.
Neutral
SellBuy
Strong sellStrong buy
Strong sellSellNeutralBuyStrong buy
Neutral
SellBuy
Strong sellStrong buy
Strong sellSellNeutralBuyStrong buy
Neutral
SellBuy
Strong sellStrong buy
Strong sellSellNeutralBuyStrong buy
An aggregate view of professional's ratings.
Neutral
SellBuy
Strong sellStrong buy
Strong sellSellNeutralBuyStrong buy
Neutral
SellBuy
Strong sellStrong buy
Strong sellSellNeutralBuyStrong buy
Neutral
SellBuy
Strong sellStrong buy
Strong sellSellNeutralBuyStrong buy
Displays a symbol's price movements over previous years to identify recurring trends.
USU02413AJ8
American Airlines, Inc. 8.5% 15-MAY-2029Yield to maturity
7.22%
Maturity date
May 15, 2029
US23771T32
American Airlines, Inc. 7.25% 15-FEB-2028Yield to maturity
6.39%
Maturity date
Feb 15, 2028
USU02413AH2
American Airlines, Inc. 7.25% 15-FEB-2028Yield to maturity
6.18%
Maturity date
Feb 15, 2028
AAL4327176
American Airlines, Inc. 3.575% 15-JAN-2028Yield to maturity
—
Maturity date
Jan 15, 2028
AAL5288053
American Airlines, Inc. 2.875% 11-JUN-2034Yield to maturity
—
Maturity date
Jun 11, 2034
AAL5291551
American Airlines, Inc. 3.95% 11-JUL-2030Yield to maturity
—
Maturity date
Jul 11, 2030
AAL4867589
American Airlines, Inc. 3.15% 15-FEB-2032Yield to maturity
—
Maturity date
Feb 15, 2032
AAL4526208
American Airlines, Inc. 3.6% 15-OCT-2029Yield to maturity
—
Maturity date
Oct 15, 2029
AAL4327177
American Airlines, Inc. 4.1% 15-JAN-2028Yield to maturity
—
Maturity date
Jan 15, 2028
AAL4867591
American Airlines, Inc. 3.85% 15-FEB-2028Yield to maturity
—
Maturity date
Feb 15, 2028
USG0R209AB6
AAdvantage Loyalty IP Ltd. 5.75% 20-APR-2029Yield to maturity
—
Maturity date
Apr 20, 2029
See all 4AAL bonds
Curated watchlists where 4AAL is featured.


Frequently Asked Questions
The current price of 4AAL is 11.374 EUR — it has increased by 2.93% in the past 24 hours. Watch American Airlines Group Inc. stock price performance more closely on the chart.
Depending on the exchange, the stock ticker may vary. For instance, on EUROTLX exchange American Airlines Group Inc. stocks are traded under the ticker 4AAL.
4AAL stock has risen by 5.08% compared to the previous week, the month change is a −3.90% fall, over the last year American Airlines Group Inc. has showed a −16.95% decrease.
We've gathered analysts' opinions on American Airlines Group Inc. future price: according to them, 4AAL price has a max estimate of 17.36 EUR and a min estimate of 8.68 EUR. Watch 4AAL chart and read a more detailed American Airlines Group Inc. stock forecast: see what analysts think of American Airlines Group Inc. and suggest that you do with its stocks.
4AAL reached its all-time high on Jan 17, 2018 with the price of 47.800 EUR, and its all-time low was 7.698 EUR and was reached on May 14, 2020. View more price dynamics on 4AAL chart.
See other stocks reaching their highest and lowest prices.
See other stocks reaching their highest and lowest prices.
4AAL stock is 2.85% volatile and has beta coefficient of 1.29. Track American Airlines Group Inc. stock price on the chart and check out the list of the most volatile stocks — is American Airlines Group Inc. there?
Today American Airlines Group Inc. has the market capitalization of 7.51 B, it has decreased by −4.79% over the last week.
Yes, you can track American Airlines Group Inc. financials in yearly and quarterly reports right on TradingView.
American Airlines Group Inc. is going to release the next earnings report on Jan 22, 2026. Keep track of upcoming events with our Earnings Calendar.
4AAL earnings for the last quarter are −0.14 EUR per share, whereas the estimation was −0.24 EUR resulting in a 38.94% surprise. The estimated earnings for the next quarter are 0.49 EUR per share. See more details about American Airlines Group Inc. earnings.
American Airlines Group Inc. revenue for the last quarter amounts to 11.67 B EUR, despite the estimated figure of 11.61 B EUR. In the next quarter, revenue is expected to reach 12.34 B EUR.
4AAL net income for the last quarter is −97.15 M EUR, while the quarter before that showed 508.49 M EUR of net income which accounts for −119.11% change. Track more American Airlines Group Inc. financial stats to get the full picture.
American Airlines Group Inc. dividend yield was 0.00% in 2024, and payout ratio reached 0.00%. The year before the numbers were 0.00% and 0.00% correspondingly. See high-dividend stocks and find more opportunities for your portfolio.
As of Nov 25, 2025, the company has 133.3 K employees. See our rating of the largest employees — is American Airlines Group Inc. on this list?
EBITDA measures a company's operating performance, its growth signifies an improvement in the efficiency of a company. American Airlines Group Inc. EBITDA is 3.63 B EUR, and current EBITDA margin is 9.56%. See more stats in American Airlines Group Inc. financial statements.
Like other stocks, 4AAL shares are traded on stock exchanges, e.g. Nasdaq, Nyse, Euronext, and the easiest way to buy them is through an online stock broker. To do this, you need to open an account and follow a broker's procedures, then start trading. You can trade American Airlines Group Inc. stock right from TradingView charts — choose your broker and connect to your account.
Investing in stocks requires a comprehensive research: you should carefully study all the available data, e.g. company's financials, related news, and its technical analysis. So American Airlines Group Inc. technincal analysis shows the buy rating today, and its 1 week rating is buy. Since market conditions are prone to changes, it's worth looking a bit further into the future — according to the 1 month rating American Airlines Group Inc. stock shows the sell signal. See more of American Airlines Group Inc. technicals for a more comprehensive analysis.
If you're still not sure, try looking for inspiration in our curated watchlists.
If you're still not sure, try looking for inspiration in our curated watchlists.