PLTR 1D Time frame📊 Palantir (PLTR) Daily Snapshot
Current Price: $162.36
Change: +4.01% from the previous close
Intraday Range: $156.37 – $162.75
Volume: 59,300,483 shares traded
🔎 Key Levels
Resistance:
R1: $162.75 (recent high)
R2: $165.00 (psychological level)
R3: $170.00 (next resistance zone)
Support:
S1: $156.37 (recent low)
S2: $150.00 (psychological support)
S3: $145.00 (next support zone)
📈 Technical Indicators
RSI (14): 67.41 — Neutral to slightly bullish
MACD: 1.51 — Positive momentum
Moving Averages:
5-day SMA: $157.25 — Buy signal
50-day SMA: $145.00 — Buy signal
200-day SMA: $130.00 — Buy signal
Stochastic Oscillator: 77.32 — Overbought
ADX (14): 44.32 — Strong trend strength
📌 Market Sentiment
Catalysts: Positive momentum following recent gains and analyst upgrades.
Sector Performance: AI and data analytics sectors showing strength, with Palantir leading gains among peers.
📅 Outlook
Bullish Scenario: A breakout above $162.75 could lead to a push toward $170.00.
Bearish Scenario: A drop below $156.37 may test support around $150.00.
Overall Bias: Moderately bullish, with positive momentum but facing near-term resistance.
4PLTR trade ideas

PLTR short update PLTR has been on a decline finally after a historic run. The stock had a clear reversal candle. I am working the OBV indicator back into my strategy and the channel looks tested to the downside, this is another momentum indicator but I find patterns are easier to spot on it. You can also note divergences. I think we go to 120 here in the coming weeks or the green demand box near 80$.

PALANTIR HIGH PROBABILITY SETUP SOON!!!🚨 PLTR HIGH PROBABILITY BUY SETUP 🚨
* Here We Can See The Next Potential Moves For Palantir Coming Hours/Days.
* Keep Your Eyes Close On Your Trading Positions.
* Happy PIP Hunting Traders.
FXKILLA.
For Those Trading PalantirPLTR has greatly accelerated it's growth trend lines. Right now PLTR is almost 3 years ahead of it's main long term trend line. What this means is upside potential is diminishing.
I see a lot of long charts for PLTR and wanted to share that support is actually at $134. So if you're a PLTR trader, looking to buy, that's the best area to do it.
If however you're looking to sell, then $230 is your spot.
I feel like people buying PLTR are playing a bit with fire as the fast gains are likely gone and eventually a return to the long term trend line is likely. I don't see that happening at least until IXCO runs into resistance, so until then $134 is the buy area.
Good luck!

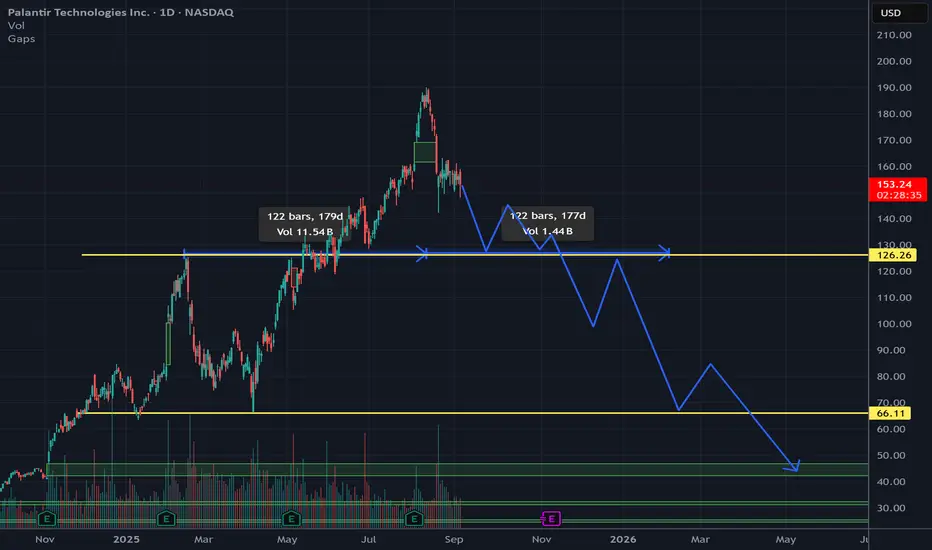
Palantir (PLTR) Fractal AnalysisOver 180 days, PLTR climbed aggressively, fueled by high conviction buying. With candlesticks showing strong green bodies and upside momentum, peaking near the $190 52-week high.
This analysis focuses on the fractal comparison in the chart, forecasting an extended bearish phase that could drag the stock significantly lower before any stabilization.
I predict PLTR enters an extended correction phase. This fractal symmetry suggests the downside could match or exceed the prior upside's duration and magnitude, projecting a measured move toward $65 or lower
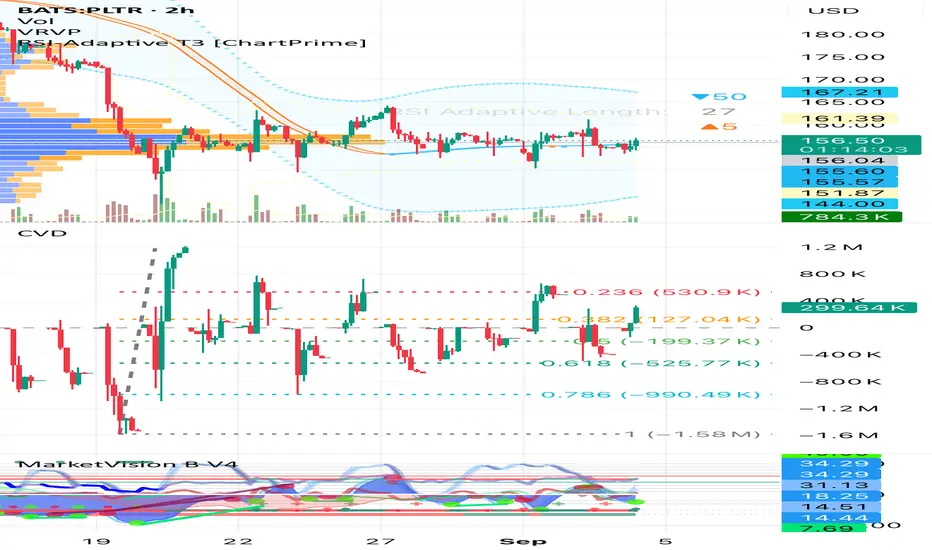
Cumulative Delta | Condensed PxCumulative delta is often used to try and get a picture of the real condensed price action as it is all buys minus all sales.
But I never see anyone doing TA on CVD candles even though it makes perfect sense.
So I’ve done it here with Fib Retracement as an experiment and it looks significant to me, I need to also use Non cumulative delta volume bars and perform the same analysis but my concept is:
let’s be reductive as there’s always so much noise
why not draw classic patterns on cvd as it would be similar to drawing them on tick or volume based charts
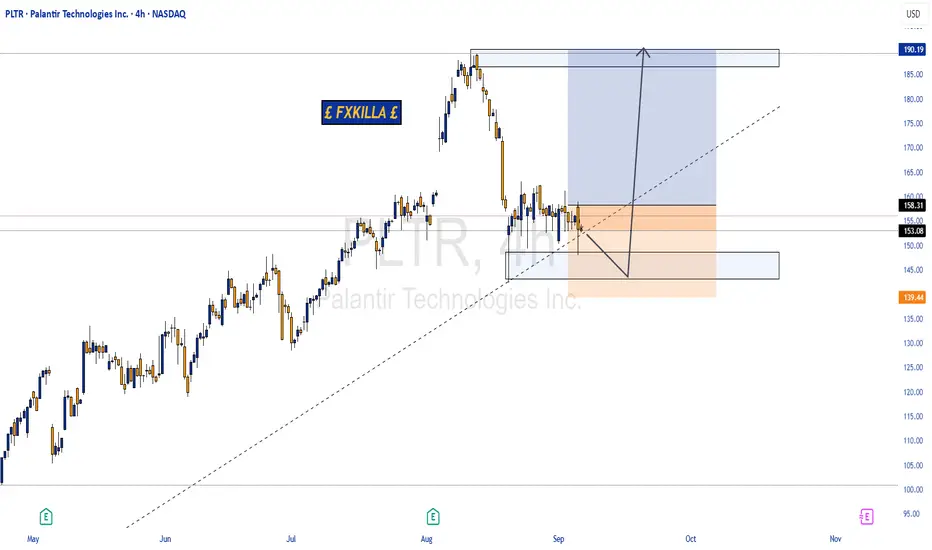
Palantir - BullishPalantir has completed a healthy retracement to the 0.382 Fibonacci level drawn from the recent major bullish rally, a key area that often acts as strong support during trending markets. This level not only holds technical significance from a Fib perspective, but it's also been respected structurally as a prior demand zone. What's particularly notable is the formation of a clear hammer candle at this level — a classic bullish reversal signal — indicating strong buying interest stepping in after a temporary pullback. This confluence of Fib support and bullish candlestick pattern suggests the bulls may be ready to resume control, potentially setting the stage for the next impulsive leg up.
Entry: CMP
TP 1: 190
TP 2: 260 (ABCD projection)
SL: 128

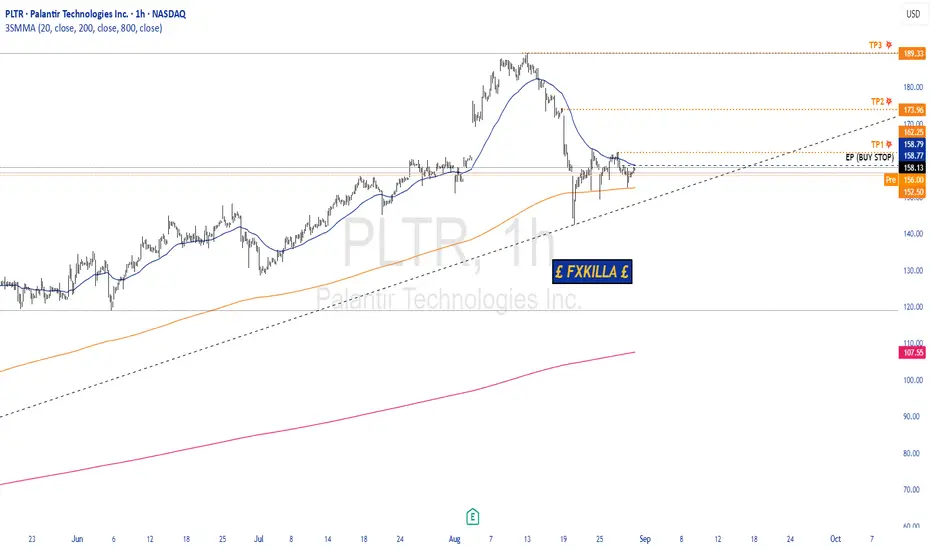
PALANTIR HIGH PROBABILITY BUY SETUP SOON!!🚨 PALANTIR HIGH PROBABILITY BUY SETUP 🚨
* Here We Can See Clearly The Next Potential Move For PLTR Coming Hours/Days.
* Keep Your Eyes Close On Your Trading Positions.
* Happy PIP Hunting Traders.
£ FXKILLA £
Palantir UpdatePLTR made a new local low today but swiftly recovered after. I could be one degree off, and price could have intentions of making another move below the (b) wave $149.37. At this time, I still believe the minor A wave is in fact complete, however, we still don't have confirmation. If price can move above $164.18, I will call that the confirmation needed to verify we are in fact within wave B.
We still have positive divergence in the micro charts. This suggests pressure should push us higher to the target box. That is of course assuming this will maintain a standard target. It is a B wave though if my count is correct. This should give you a heads up that the pattern will quite possibly become very complex.
Unless price moves below $142.35, my primary analysis points to the target box above.

PALANTIR GOES READY TO 'WHAKA WHAKA' BEARS CORNER╭∩╮( •̀_•́ )╭∩╮Palantir Technologies’ recent stock decline in August 2025 stems from a combination of technical and fundamental factors. After an explosive rally in the first half of the year - driven by strong enthusiasm for AI, record financial results, and a wave of commercial and government contracts - the stock entered a pronounced six-day losing streak, dropping over 17%, with more than $73 billion of market capitalization wiped out from its recent peak.
Fundamental Reasons
Valuation Concerns. Palantir’s valuation soared to extreme levels, with forward price-to-earnings (P/E) ratios between 193 and 252, dwarfing those of other tech giants like Microsoft and Apple (whose ratios hover around 30). This staggering valuation reflects enormous investor expectations for future growth, creating vulnerability to profit-taking and re-rating if growth moderates or disappoints.
Short Seller Critiques. Citron Research’s Andrew Left released a report arguing Palantir is “detached from fundamentals,” suggesting its shares should be valued at $40, compared to recent levels around $158–$190, using price-to-revenue metrics aligned with OpenAI’s $500 billion valuation. His public criticism catalyzed bearish sentiment and led to a surge in short-selling profits.
Competitive Landscape. Palantir’s government segment, historically its core business, is facing intensified competition. New Department of Defense contracts awarded to OpenAI, Anthropic, Google, and xAI signal that the company’s dominance over federal AI budgets may be waning. Growth outside the US has also slowed due to regulatory and competitive hurdles.
Earnings Growth but Slowing Trajectory. Palantir delivered its first $1 billion revenue quarter and continues to post robust year-over-year growth. However, concerns remain about the sustainability of this pace. Consensus forecasts now project more moderated annual growth rates, and Wall Street’s consensus outlook shifted from “Buy” to “Hold,” with a bearish 12-month price target of $107—significantly below recent prices.
Technical Reasons
Overbought Conditions. After rallying 100%+ year-to-date, technical indicators such as the 14-day Relative Strength Index approached “overbought” territory (RSI ~62), suggesting the risk of a near-term pullback. Furthermore, shrinking volumes on continued price increases indicated waning bullish momentum, with buyers becoming more cautious and profit-taking accelerating.
Correction from Record Highs. The rapid run-up led Palantir into a vulnerable technical posture; corrections often follow periods of exuberant price action, particularly when coupled with weak underlying volume and stretched technical metrics. Recent technical analysis flagged downside risk if momentum falters and results disappoint relative to lofty expectations.
Outlook and Further Price Action.
Mid-term, Palantir’s trajectory hinges on whether it can continue to justify and deliver against the premium embedded in its valuation. Sustained AI adoption and successful expansion in commercial sectors could underpin further long-term growth. However, any slowdown in earnings growth, intensifying competition in government contracts, or a sharp marketwide rotation out of high-multiple tech stocks could drive further downside.
Short-term, the combination of elevated valuation, technical overextension, and negative headlines from prominent short sellers has increased the volatility.
In comparative terms, despite of recent nearly 20 percent decline from all the history peak, in nowadays Palantir' stock demonstates the best of the best year-to-date +104.96% performance in 2025 over the all S&P500 and Nasdaq-100 indices components. Palantir' stock returns over the past 5 years prevail +1000 per cent.
Among all S&P500 and Nasdaq-100 indices components, only three another great stocks were able to do the same over the past 5 years - MicroStrategy (+2204%), Supermicro (+1489%) and Nvidia Corporation (+1258%).
The main technical graph inndicates on major support in Palantir stocks near $160 per share, with further possible price action in the second half of the year 2025.
--
Best wishes,
@PandorraResearch Team

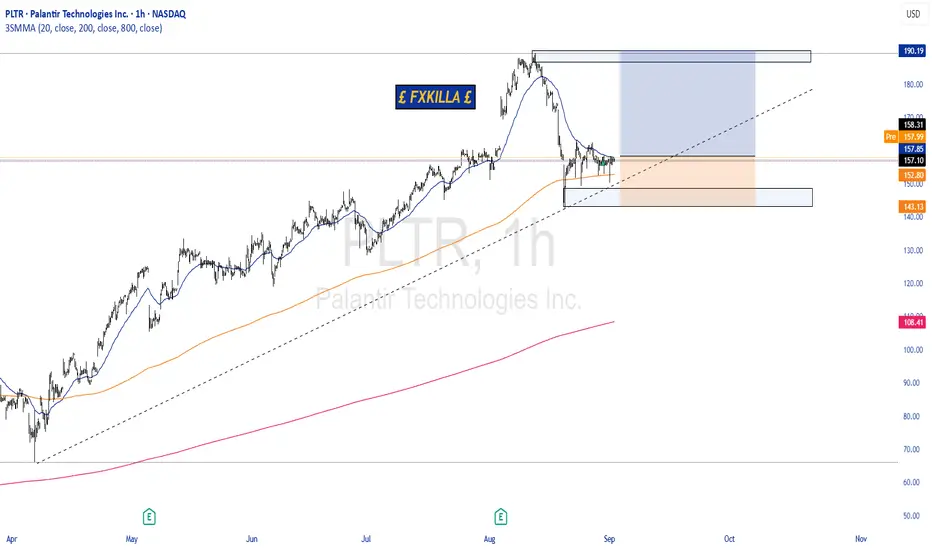
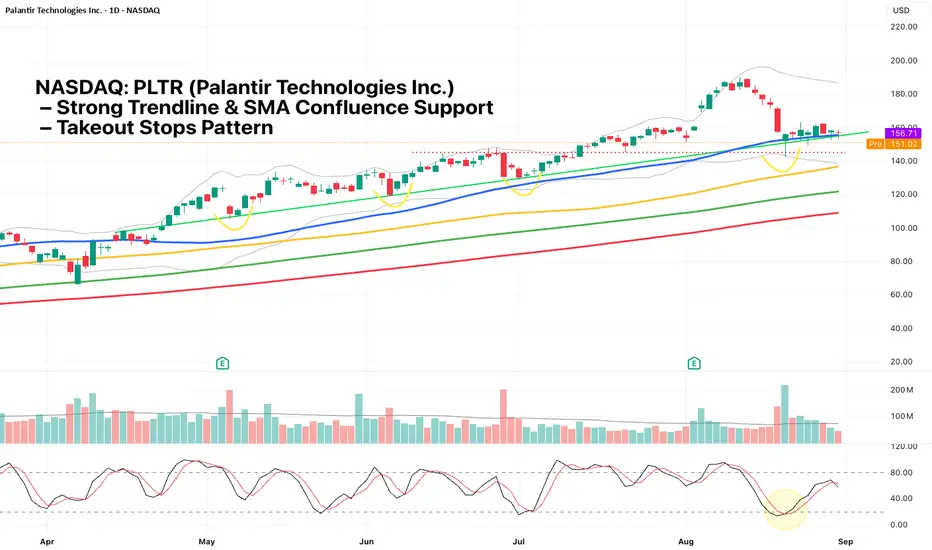
NASDAQ: PLTR – Strong Trendline & SMA Confluence SupportNASDAQ: PLTR Palantir remains in a clear uptrend with the moving averages aligned (SMA 50 > SMA 100 > SMA 150 > SMA 200). Since April, price has consistently traded above the 50-day SMA, finding support on each pullback to the trendline (green line). This trendline has been tested four times over the past six months, the latest on August 20.
On August 20, PLTR formed a hammer candlestick while testing multiple key supports simultaneously:
1) Horizontal support (red dotted line)
2) Cut Lower Bollinger Band
3) Tested 50-day SMA
4) Trendline support (green line)
5) Stochastic in oversold zone
6) Takeout stops pattern: wick flushed below prior lows, likely taking out stops before reversing
This strong confluence of signals suggests buyers are defending the level, offering a favorable risk-reward setup.
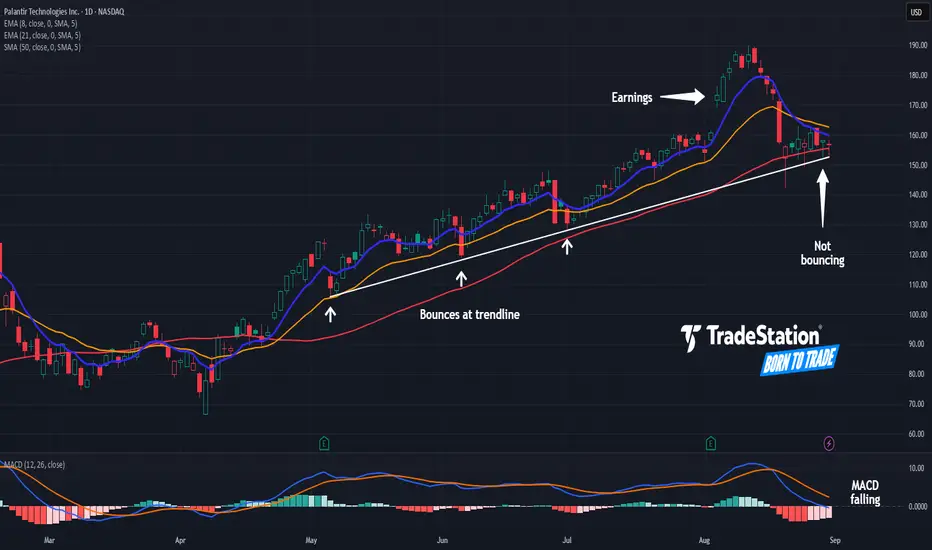
Palantir May Have Stopped BouncingPalantir Technologies has enjoyed a dramatic run, but some traders may see risks in the high-flying software company.
The first pattern on today’s chart is the series of higher lows since early May. PLTR bounced at that trendline in June and early July. However, it spent most of late August sitting at the line. Is the uptrend fading?
Prices have similarly hugged the 50-day simple moving average without significant buying. That may suggest its intermediate-term momentum is slowing.
Third, PLTR failed to hold a breakout on August 5 after quarterly results beat estimates. The result is a potential exhaustion gap.
Fourth, the 8-day exponential moving average (EMA) has crossed below the 21-day EMA for the first time since mid-April. MACD is also falling. Some chart watchers may view those as bearish short-term signals.
Next, there could be valuation concerns: TradeStation data shows PLTR has the highest price/earnings and price/sales ratios in the S&P 500.
Finally, PLTR is an active underlier in the options market (ranking third in the S&P 500). That could help traders take positions with calls and puts.
TradeStation has, for decades, advanced the trading industry, providing access to stocks, options and futures. If you're born to trade, we could be for you. See our Overview for more.
Past performance, whether actual or indicated by historical tests of strategies, is no guarantee of future performance or success. There is a possibility that you may sustain a loss equal to or greater than your entire investment regardless of which asset class you trade (equities, options or futures); therefore, you should not invest or risk money that you cannot afford to lose. Online trading is not suitable for all investors. View the document titled Characteristics and Risks of Standardized Options at www.TradeStation.com . Before trading any asset class, customers must read the relevant risk disclosure statements on www.TradeStation.com . System access and trade placement and execution may be delayed or fail due to market volatility and volume, quote delays, system and software errors, Internet traffic, outages and other factors.
Securities and futures trading is offered to self-directed customers by TradeStation Securities, Inc., a broker-dealer registered with the Securities and Exchange Commission and a futures commission merchant licensed with the Commodity Futures Trading Commission). TradeStation Securities is a member of the Financial Industry Regulatory Authority, the National Futures Association, and a number of exchanges.
Options trading is not suitable for all investors. Your TradeStation Securities’ account application to trade options will be considered and approved or disapproved based on all relevant factors, including your trading experience. See www.TradeStation.com . Visit www.TradeStation.com for full details on the costs and fees associated with options.
Margin trading involves risks, and it is important that you fully understand those risks before trading on margin. The Margin Disclosure Statement outlines many of those risks, including that you can lose more funds than you deposit in your margin account; your brokerage firm can force the sale of securities in your account; your brokerage firm can sell your securities without contacting you; and you are not entitled to an extension of time on a margin call. Review the Margin Disclosure Statement at www.TradeStation.com .
TradeStation Securities, Inc. and TradeStation Technologies, Inc. are each wholly owned subsidiaries of TradeStation Group, Inc., both operating, and providing products and services, under the TradeStation brand and trademark. When applying for, or purchasing, accounts, subscriptions, products and services, it is important that you know which company you will be dealing with. Visit www.TradeStation.com for further important information explaining what this means.
PLTR Bulls Eye $168 Target→Don’t Miss Out
🚀 **PLTR Swing Trade Setup | Weekly Bullish Trend vs. Daily Correction** 💎
📊 **TRADE DETAILS**
🎯 **Instrument**: \ NASDAQ:PLTR
📈 **Direction**: LONG
💰 **Entry Price**: 156.50 (limit, fill up to 157.00)
🛑 **Stop Loss**: 151.90
🎯 **Take Profit**: 168,00
📊 **Size**: 15% of portfolio
💪 **Confidence**: 60%
⏰ **Entry Timing**: Market Open (8/31)
⚖️ **R\:R ≈ 2.9** | Risk ≈ -4.6 / Reward ≈ +13.5
📌 **Rationale**
✅ Weekly trend still strongly bullish (EMA stack + MACD positive).
✅ Clear stop cluster at 152.55 (50 EMA).
✅ Tactical swing long if structure holds.
⚠️ Daily MACD still corrective + weak volume → size capped.
---
🔥 **Hashtags **
\#PLTR #OptionsTrading #SwingTrade #EarningsPlay #BullishSetup #StockMarket #TradingSignals #RiskReward #MomentumTrading #TradeIdeas

PLTR HIGH PROBABILITY SETUP SOON!!🚨 PLTR HIGH PROBABILITY BUY SETUP 🚨
* Here We Can See Clearly The Next Potential Move For PLTR Coming Hours/Days.
* Keep Your Eyes Close On Your Trading Positions.
* Happy PIP Hunting Traders.
£ FXKILLA £
head and shoulder and bear flaglooks like we are heading down in the 120 range, price went down to 142 then consolidated at 160 now breaking down.
making both H & S pattern and bear flag
not financial advice.

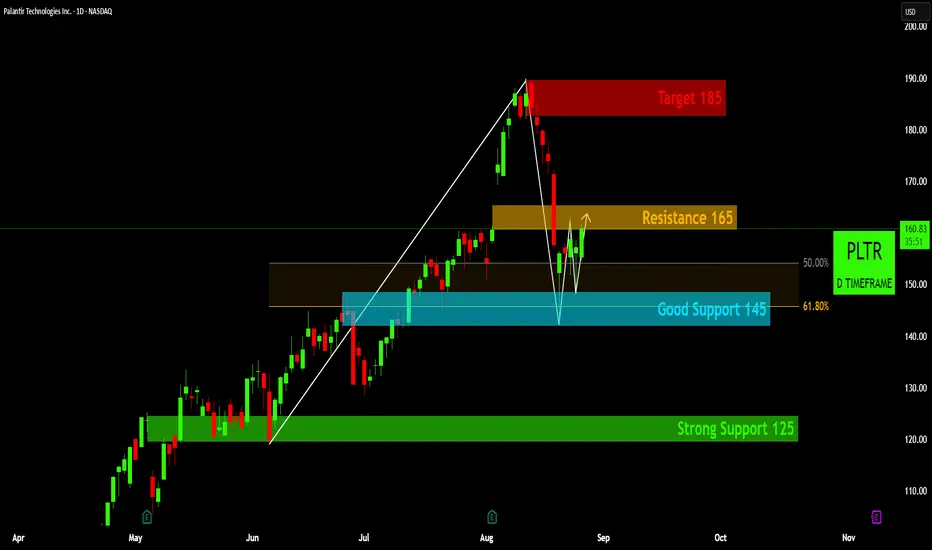
PLTR's W-Pattern: Is 165 the Gateway to 185?
Bullish Reversal Pattern: PLTR has recently formed a clear 'W' shaped bottoming pattern, with its two lows consolidating around the Good Support 145 level (which aligns with the 61.8% Fibonacci retracement). This pattern is generally considered a strong bullish reversal signal after a prior downtrend from the peak near 190.
Key Breakout Level: The critical level to confirm the 'W' pattern breakout and initiate a long position is a decisive break and sustained close above the Resistance 165 zone. This level acts as the neckline of the 'W' pattern, and overcoming it would suggest strong bullish conviction.
Support Confirmation: The repeated bounces off the Good Support 145 level during the 'W' formation indicate its significance as a strong demand zone. This provides a good foundation for the potential upward move, with Strong Support 125 serving as a deeper, more robust safety net if market conditions deteriorate.
Upside Target: Upon a successful breakout above Resistance 165, the chart clearly identifies Target 185 as the next significant upside objective. This level aligns with a previous area of price congestion and could be the initial profit-taking zone for a confirmed move higher.
Disclaimer:
The information provided in this chart is for educational and informational purposes only and should not be considered as investment advice. Trading and investing involve substantial risk and are not suitable for every investor. You should carefully consider your financial situation and consult with a financial advisor before making any investment decisions. The creator of this chart does not guarantee any specific outcome or profit and is not responsible for any losses incurred as a result of using this information. Past performance is not indicative of future results. Use this information at your own risk. This chart has been created for my own improvement in Trading and Investment Analysis. Please do your own analysis before any investments.
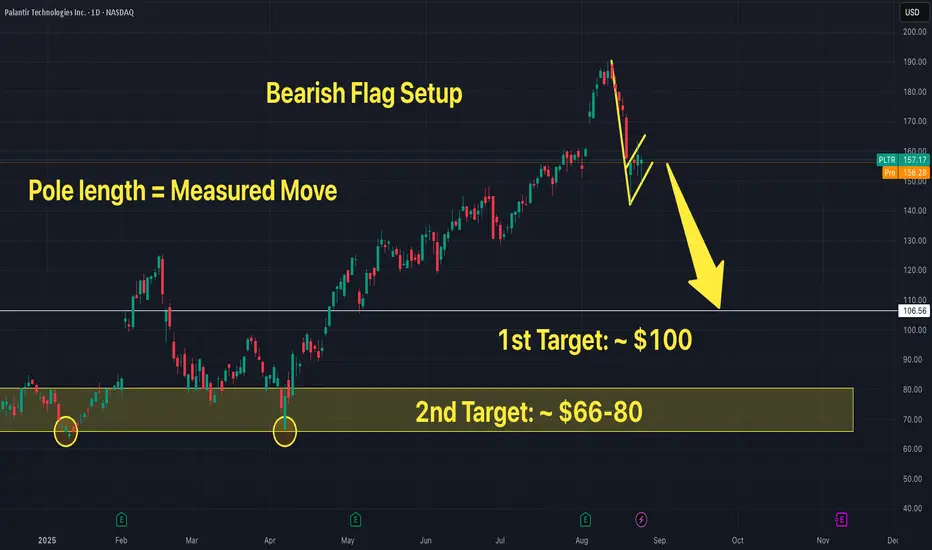
$PLTR - $100 Price Target with Bear FlagThere is a clear bearish flag setting up. Short at the break of flag for a measured move to the sub $100 level. Further selling pressure may bring it down to the support zone of between ~$66 to $80 level.
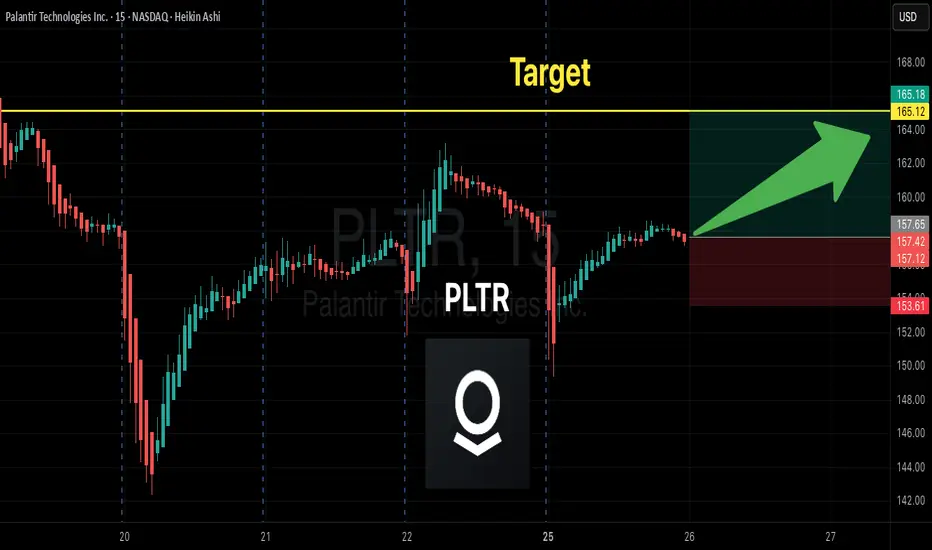
PLTR Weekly Options Setup | $165C Eyeing 75% Upside!
## 🚀 PLTR Weekly Options Play (Aug 25–29): Tactical Call Setup 🎯🔥
**Summary of Model Signals**
* **Mixed Views:** 2 bullish/neutral vs. 2 bearish/neutral → no full consensus.
* **Claude:** ✅ Bullish, calls at \$165 (OI cluster, daily RSI rebound).
* **Grok:** ❌ Bearish, puts at \$142 (institutional selling, weak RSI).
* **Gemini + Llama:** ⚖️ Neutral, no clear trade.
**Key Market Notes**
* 📊 2.2x weekly volume = high institutional activity.
* ⚡ Options flow neutral (C/P 1.04).
* 🌀 Daily RSI rebounding from oversold.
* 💎 Heavy call OI stacked \$160–\$170 (pinning/squeeze zone).
* 🛑 Risks: theta decay (4 DTE), gamma whipsaws, low VIX → possible chop.
---
### 📈 Trade Plan (Speculative, Small Size)
* 🎯 **Direction:** CALL (LONG)
* 🔑 **Strike:** \$165.00
* 💵 **Entry:** \$0.98 (ask)
* 🎯 **Target:** \$1.70 (+75%)
* 🛑 **Stop:** \$0.53 (–45%)
* 📅 **Expiry:** Aug 29, 2025
* 📏 **Size:** 1 contract (small/speculative)
* ⏰ **Timing:** Entry at open, exit by Thursday if no momentum.
* 📊 **Confidence:** 60% (moderate conviction, mixed models).
---
### 📊 TRADE DETAILS (JSON for coders/quant backtesters)
```json
{
"instrument": "PLTR",
"direction": "call",
"strike": 165.0,
"expiry": "2025-08-29",
"confidence": 0.60,
"profit_target": 1.70,
"stop_loss": 0.53,
"size": 1,
"entry_price": 0.98,
"entry_timing": "open",
"signal_publish_time": "2025-08-25 13:14:21 UTC-04:00"
}
```
---
### 🔖 Tags:
\ NASDAQ:PLTR #OptionsTrading #WeeklyOptions #CallOptions #TechStocks #MomentumTrading #StockMarket #TradingSetup 🚀📈🔥💎
Palantir 2025 - Analysis - Elliott Wave PLTR looks like it is in Wave 4 consolidation/correction. If this holds, the next push higher would be Wave 5, with a likely target retest of $200 - $220. Palantir's next earnings report should be around November 10th, this would line up nicely with a continued run up into earnings, end of year "Santa Rally", hopefully hitting the 1.618% Fib extension at $219.45.
Elliott Wave Count (2025 View)
Wave 1 – The initial strong rally that started early in the year (around the $40–$60 zone) and pushed higher into the $100+ area.
Wave 2 – The corrective pullback that consolidated sideways/downward after the first rally (likely stalling between $80–$100).
Wave 3 – The largest and most impulsive rally that carried PLTR up toward the recent all-time highs (~$180–$190). This leg is clearly extended.
Wave 4 – The sharp pullback off those highs, retracing back to around $150s. This correction looks steep but fits as a Wave 4 since RSI cooled sharply too.
Wave 5 (potentially forming or still ahead) – If this structure holds, the next leg would be another rally attempt, targeting a move back toward or above the prior highs (~$180–$200 zone).
Supporting Clues
RSI: Overbought (>70) at the Wave 3 peak, then cooling into mid-40s (Wave 4 typical reset zone).
Volume: Big spikes on the Wave 3 rally and during the Wave 4 selloff, suggesting strong participation.
200-day EMA: Still rising far below price (~$110s), so long-term uptrend remains intact.

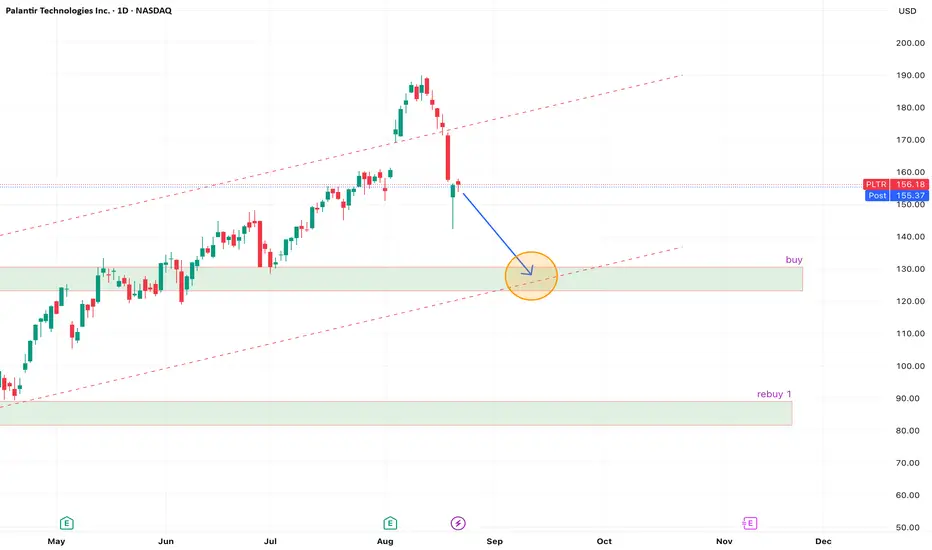
PLTR Pullback in Progress – Eyes on the Reload ZonePLTR looks like it’s in the middle of a healthy pullback after a strong run. I’m watching for it to drift down into the lower trendline and demand zone — that area lines up nicely with previous structure and could offer a clean bounce. If it gets there with decent volume and price action starts to slow, I’ll look to step in. Until then, just letting it come to me — no need to chase. Rebuy zone marked lower in case it really unwinds.
Risk Builds as Palantir Breaks Multiple Support Levels The shares of Palantir fell by more than 9% on 19 August, on heavy volume. The sharp decline caused significant technical damage to the chart. The uptrend that the stock had been following since July 1 was broken with ease. Meanwhile, the share price fell below the 10-day exponential moving average and the 20-day simple moving average, indicating that a change in trend may be developing.
The lower Bollinger Band is currently at $144.25, while the relative strength index stands at 43.8, indicating the stock is nowhere near oversold and could fall a further 8% before approaching such levels. Moreover, the share price has dropped below a key technical support at $160.50, an area that had previously acted as resistance in the run-up to the company’s results at the end of July.
Based on the chart, there should be firm support for the stock at the lower Bollinger Band around $145, which also coincides with a technical support level formed in late June. If the shares fail to hold that support, the risk is a move back towards $120.
If a change in trend is indeed underway, it will need to be confirmed on the next rally attempt. As long as the stock remains below the falling 10-day exponential moving average and the 20-day simple moving average—both of which should now act as resistance—the path is likely towards much lower levels. However, if the stock manages to break out and rise above those resistance levels, a return to the all-time highs cannot be ruled out.
Written by Michael J. Kramer, founder of Mott Capital Management.
Disclaimer: CMC Markets is an execution-only service provider. The material (whether or not it states any opinions) is for general information purposes only and does not take into account your personal circumstances or objectives. Nothing in this material is (or should be considered to be) financial, investment or other advice on which reliance should be placed.
No opinion given in the material constitutes a recommendation by CMC Markets or the author that any particular investment, security, transaction, or investment strategy is suitable for any specific person. The material has not been prepared in accordance with legal requirements designed to promote the independence of investment research. Although we are not specifically prevented from dealing before providing this material, we do not seek to take advantage of the material prior to its dissemination.
$PLTR TANASDAQ:PLTR Chart Analysis (Aug 2025)
Since November 2024, NASDAQ:PLTR has staged a 370% bull run into mid-August 2025. The advance unfolded as a 13-wave Elliott fractal sequence, but the latest leg shows signs of a corrective phase, confirmed by a break of the verified uptrend line.
Throughout the rally, hidden bullish divergence on the CCI appeared several times, reinforcing continuation, but broader participation weakened as early as December 2024, suggesting underlying exhaustion. Notably, volume patterns showed buying on impulses but also profit-taking on retracements, typical of a maturing rally.
From April 7th, a rising trendline was established, evolving into a rising wedge structure. Multiple retests in June–August held, with hidden bullish divergence on the CCI and repeated interactions with the ±2σ Bollinger Bands, which acted as dynamic support/resistance.
The 5th wave climaxed with an exhaustion gap, coinciding with CCI overextension above +200 and a decisive upper Bollinger Band breakout. This marked unsustainable momentum. The subsequent trendline break on heavy volume, followed by a pin bar on even stronger volume, signals exhaustion and distribution.
The highest-probability scenario now is a retest of the broken trendline from below, where confluence comes from:
1.Expanding volume confirming sellers’ control,
2.Mean reversion tendency back into the Bollinger midline,
3. Elliott structure shifting into corrective mode

PLTR Profit target or shortlast short didnt work out. it held the level and continued after trading sideways for a few weeks. i would like to see it react off this yearly level.
