Fartcoin - Double support, strong rebound potentialFartcoin is sitting right on a double support level, which gives the chart a solid base. This setup signals strong rebound potential. If momentum builds from here, we could see a sharp bounce.
FARTCOINUSDT.3L trade ideas

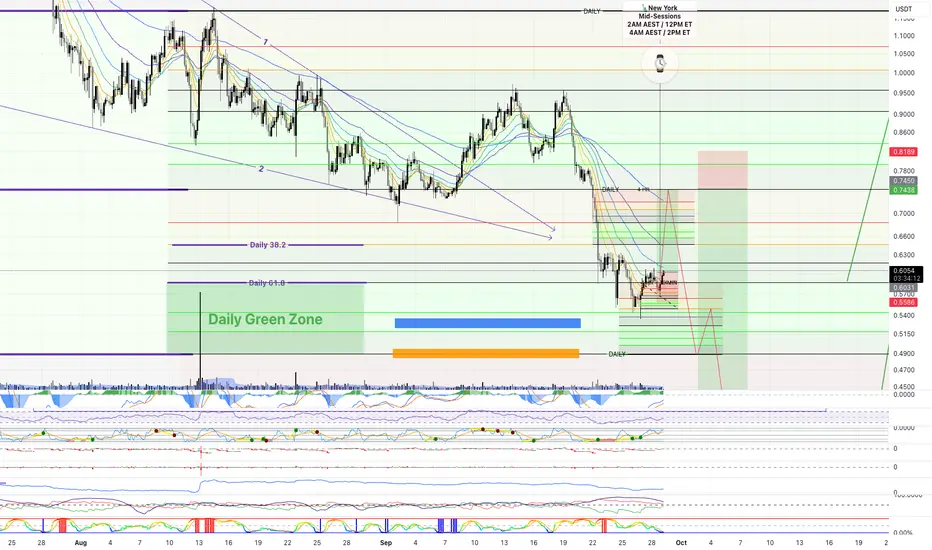
FARTCOIN - BEARISH CONSOLIDATION LIKELY: 0.5500$ next? #FARTCOIN - update:
Strong sowntrend still in place 📉
M15 - H1 view, very neutral, clean range phase.
H = 0.63500$
L = +/- 0.600$
Weekly view remain strongly bearish, with the lower key support I see around 0.550$!
I placed all main levels in my second chart; but without a range or trend break, prices might continue to dump. 📉
Remember, it's always safer to follow the main trend, I also often try to counter trade, but most of time of those trades retults in losses...
Once bulls will be back, our job is to focus on reversal setup & bull consolidation / Patterns.

FARTCOIN - all gaps filled 3D/W/M gaps all filled
0.75 fib filled
Top volume coin
OBV always on the rise
I’m long

FARTCOIN — Patience First, 1:15 PotentialIdea, not certainty.
Unlike my previous analysis, I’m not treating this as a done deal.
High-timeframe context, so patience is part of the edge. Defined risk, aiming for 1:15.It’s an idea. A shadow on the map.
Some hunts end with teeth in the prey, others end with silence in the woods. Both are fine.
High timeframe means high patience.
Risk-to-reward? 1:15. That’s not a trade, that’s a hunt worth bleeding for.
I move step by step. No rush. No mercy.
If the signals appear, I strike — clean and fast.
If they don’t, I vanish like nothing was ever there.
That’s the rule: no attachment, no begging, no noise.
Either the kill comes to me, or I walk away sharper than before.
Not financial advice. Just a wolf calculating in the dark.

Fartcoin Faces Breakdown Risk Below $0.93After two failed attempts to reclaim $0.93, Fartcoin has slipped back to key Fibonacci support. The market is at a decisive point where either a bounce occurs or further downside accelerates.
Key Technical Points
- Double Rejection: $0.93 resistance rejected twice.
- 0.618 Fibonacci: Current support under test.
- Breakdown Target: Loss of support opens path to $0.51.
Analysis
Price action highlights clear weakness, with $0.93 acting as a ceiling. Holding the Fibonacci level is critical; a bounce here could rotate price back to retest $0.93. However, if broken, the next logical support lies at $0.51, representing a significant technical breakdown.
Market structure suggests sellers remain in control until price reclaims resistance. Bulls must defend current levels to avoid continuation lower.
What to Expect
Fartcoin sits at a make-or-break level. A rebound keeps $0.93 in play, but a breakdown exposes $0.51 as the next downside target.

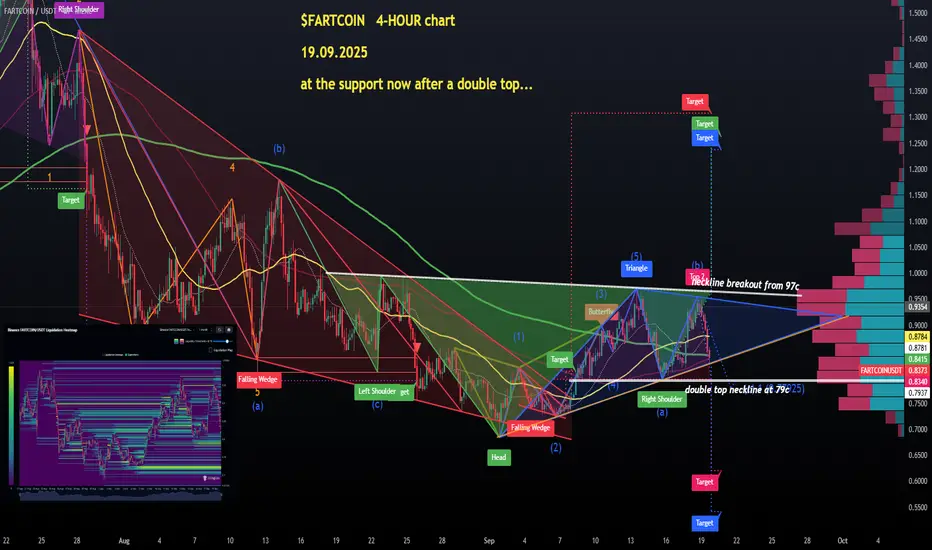
$FARTCOIN at support now after a FAILED IH&S breakout$FARTCOIN strategy of waiting for a succesfull close above resistance before entering worked very well indeed, a bullet dodged as we had a rejection at 96c, just at the upper trendline (inverse h&s neckline) resistance.
So now, after a double top was formed, $Fartcoin is trading at the monthly ascending support and 3-4% lower would be the double top neckline at 79c.
We want to stay above the ascending support or we could grab accumulated liqidity below at 72c (see the Liquidity map attached).
No longs before a good breakout above 97c as far as im concerned💙👽
Fartcoin Holds $0.76 Support as Range FormsFartcoin has been oscillating between critical supports, building a base at $0.76. The longer price holds above this level, the more likely it is to initiate a bullish reversal within the range.
Key Technical Points
- $0.76 Support: High-time-frame zone holding as base.
- Range Formation: Between weekly and daily supports.
- Upside Target: Breakout could drive rotation to $1.22.
The support at $0.76 continues to attract buyers, creating a structural floor for accumulation. While oscillations within the range may persist for some time, the formation of a base is constructive for a bullish reversal.
If buyers maintain control of this level, Fartcoin could rotate higher toward $1.22, where the next major resistance lies. A loss of this support, however, would undermine the bullish scenario and open the door to deeper downside.
What to Expect
Fartcoinis likely to continue ranging before a reversal emerges. Holding $0.76 remains critical for the bullish case, with $1.22 the next target once demand confirms.

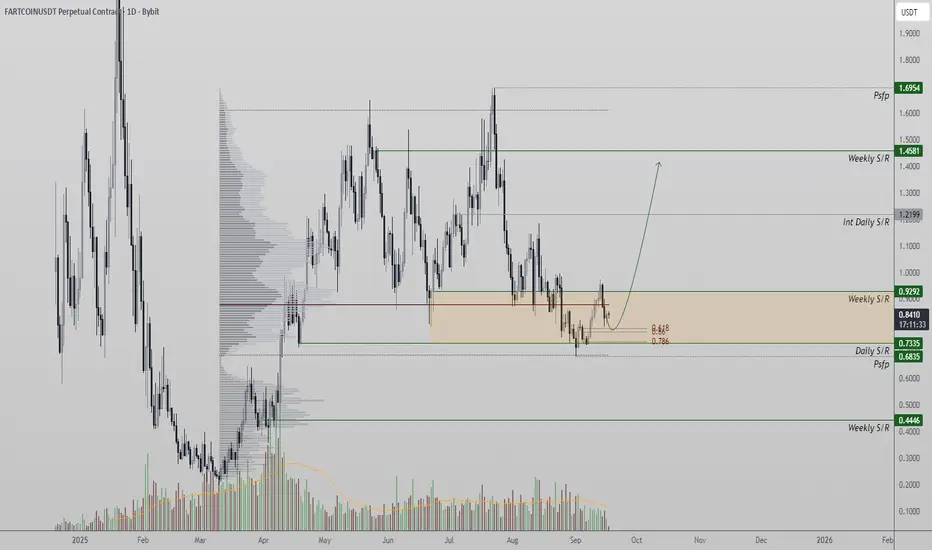
FARTCOIN OVERSOLD LONG IDEATrade Idea – Mean Reversion Bounce on FARTCOIN/USDT
The chart shows FARTCOIN in a heavily oversold zone, trading near a significant demand area after an extended downtrend. Price has already tested and respected the lower value area (VA) and is showing signs of stabilizing.
The setup is built around a mean reversion bounce expectation, where price is likely to retrace higher toward previous imbalance zones and value areas. Momentum indicators and structure suggest that sellers are exhausted, opening up room for a recovery leg.
Entry Zone: Current levels around $0.63 – $0.64, following rejection of the recent low.
Stop Loss: Below $0.50 to protect against a deeper continuation move.
First Target: $0.72 (local resistance / value area retest).
Extended Targets: $1.46 – $1.69 (prior value area and liquidity levels).
This trade thesis is based on the principle that oversold conditions tend to normalize, with buyers stepping in to capture value and momentum carrying price back toward equilibrium zones. If momentum strengthens on the bounce, the move could develop into a mid-term trend reversal.

Forecast for FARTCOIN 1st October 2026Expectation of 36% Move to the Downside for FARTCOIN after it hits the 128 day MA on the 4 HR timeframe.
Forecast for FARTCOIN 30th September 2026 (Amended)FAIf you took this same FARTCOIN Long that I posted on the 29th of September 2026, you likely would of had the opportunity to be stopped out at break-even. This trade was a bit untrustworthy as it was initiated on a Friday and continued upwards on a Sunday night (Eastern Time), both low liquidity days of the week (easy to push price around).
For this trade, I am expecting the same long trade but first with a bearish move downward and again an expectation of 24%-28%+ Move to the Upside for FARTCOIN.
Be sure to move your stops to Break-even once price has moved at least 1-2 Fibonacci Levels above your entry price.
Forecast for FARTCOIN 30th September 2026If you took this same FARTCOIN Long that I posted on the 29th of September 2026, you likely would of had the opportunity to be stopped out at break-even. This trade was a bit untrustworthy as it was initiated on a Friday and continued upwards on a Sunday night (Eastern Time), both low liquidity days of the week (easy to push price around).
For this trade, I am expecting the same long trade but first with a bearish move downward and again an expectation of 24%-28%+ Move to the Upside for FARTCOIN.
Be sure to move your stops to Break-even once price has moved at least 1-2 Fibonacci Levels above your entry price.
$FARTCOIN - below 6-months' range low, recovery NEXT?$FARTCOIN has started a short squeeze which can lead to much higher prices again, soon.
The attached LIQUIDATION heatmap is showing massive short liquidations going on right now above 60cents, and there is more damage to be done to bears if #Fartcoin can reach a dollar mark again, and don't forget the January ATH was around $2.75.
As far as the 12-hour chart, FARTCOIN has recovered 8-9% from the lower low, which might also have been the bottom.
Especially seeing the OBV stable profile during a huge sell-off which went on from for the last 9 weeks.
Whales have been accumulating, so we might be about to witness a great recovery mission here.
I need a higher low to be established on the DAILY / 12-hour charts first. So far, this memecoin has been in a steady DOWNTREND.
This might be coming to an end. CRYPTOCAP:DOGE is going to be a leader of a new wave up for memes, so keeping an eye on these charts, for now👽💙

Forecast for FARTCOIN 29th September 2026Expectation of 20%-24%+ Move to the Upside for FARTCOIN. Explosive move suggested by BBWP Indicator.
FARTCOINUSDTFARTCOINUSDT: Potential buying opportunity at long-term wedge support, trend reversal expected.

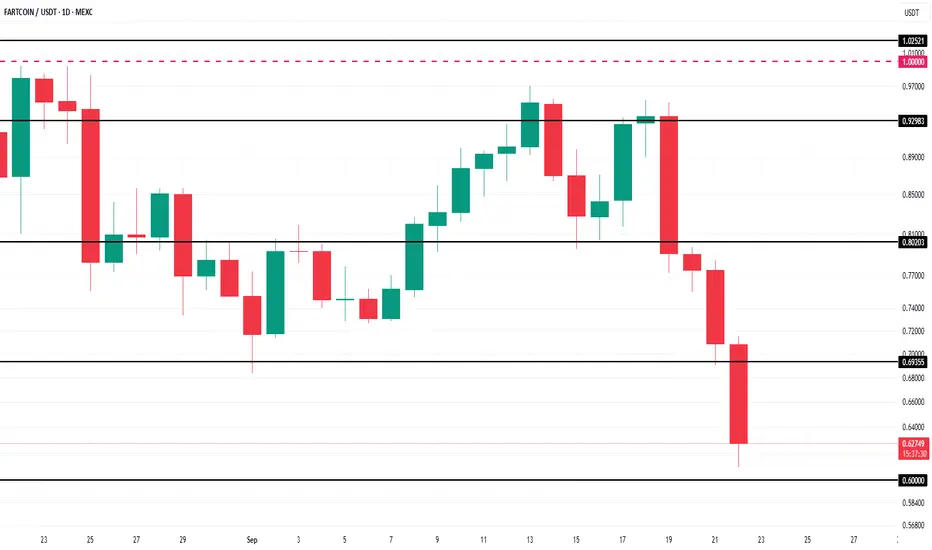
3 Meme Coins To Watch In The Final Week Of SeptemberFARTCOIN has faced significant losses this week, dropping 24.29% and ranking among the worst-performing altcoins. Despite the sharp decline, a potential silver lining remains for investors.
The Relative Strength Index (RSI) is approaching the oversold threshold, which historically signals a rebound opportunity for assets. If momentum shifts, FARTCOIN could bounce from its $0.600 support level, targeting $0.678 and potentially $0.732. These gains would offer relief to holders seeking recovery after the recent steep declines.
However, if bearish momentum continues to weigh on the token, FARTCOIN risks breaking below the $0.600 support level. Such a move would expose the coin to further downside pressure, potentially sliding toward $0.500. This decline would invalidate the bullish thesis and extend losses for meme coin investors.
Fartcoin Eyes $1.45 Reversal After Testing Fibonacci ConfluenceFartcoin has retraced into a major confluence zone, with the 0.618 Fibonacci retracement, point of control, and daily support clustering near $0.73. This level could serve as the foundation for a reversal toward $1.45.
Introduction:
While recent price action has been corrective, Fartcoin’s current position highlights a potential bottoming zone. The confluence of multiple technical levels at $0.73 gives merit to a reversal scenario, provided the coin consolidates above support. Traders are now watching for a shift in structure that could spark the next leg higher.
Key Technical Points:
Testing the 0.618 Fibonacci retracement near $0.73.
Point of control and daily support reinforce the zone.
Breakout structure could accelerate toward $1.45.
Fartcoin’s retracement into $0.73 is significant, as this zone combines several technical supports into one dense region. The value area low, daily SR, and point of control all overlap here, creating a high-probability reversal area. If buyers step in and establish a base, the likelihood of a structural shift toward higher levels increases considerably.
For a bullish reversal to take shape, Fartcoin must consolidate above $0.73 and print a higher low. This would confirm market structure has flipped, paving the way for continuation toward $1.45. The latter level represents both psychological resistance and a target defined by the Fibonacci extensions of the prior impulse move.
On the other hand, failure to establish support here would undermine the bullish case. A breakdown beneath $0.73 could open the door to deeper declines, weakening the probability of recovery in the short term.
What to Expect in the Coming Price Action:
Fartcoin sits at a decisive support cluster, with a reversal toward $1.45 possible if the structure shifts bullish. Holding $0.73 is essential, making this level the battleground for the next directional move.
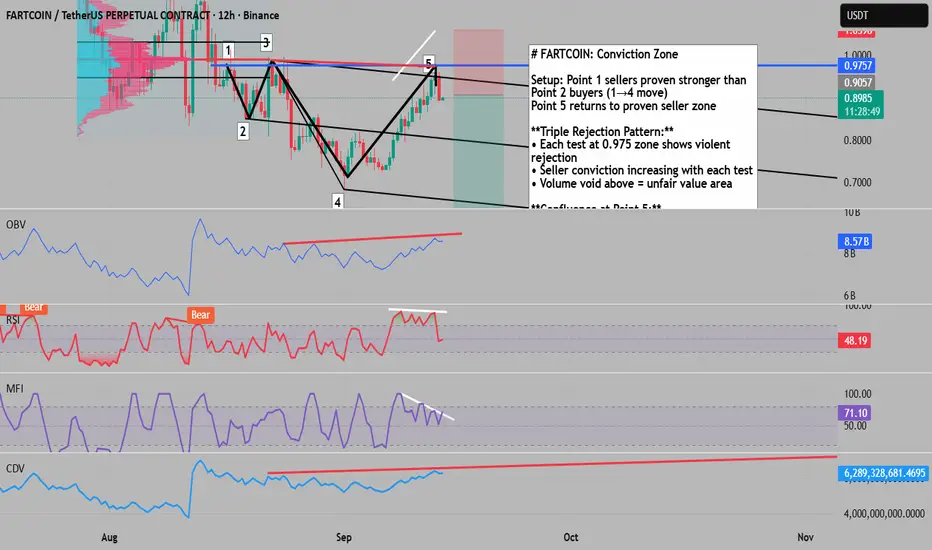
The Conviction Zone: FARTCOIN's Triple Rejection Pattern# The Conviction Zone: FARTCOIN's Triple Rejection Pattern
## Market Structure Analysis
The price action from Points 1→4 established a critical fact: sellers at the 0.975 zone are objectively stronger than buyers from Point 2. This isn't opinion - it's proven by the deeper low at Point 4. Now at Point 5, price returns to these validated sellers, creating a high-probability short opportunity.
## The Triple Rejection Phenomenon
Each interaction with the 0.975 resistance zone demonstrates increasing seller aggression:
First Contact: Initial resistance established
Second Contact: Sharp rejection with increased volume
Third Contact (Point 5): Violent reversal on first touch
This escalating defense pattern reveals institutional sellers protecting their position with growing conviction. The lack of consolidation at resistance shows buyers have no interest in accumulating at these levels.
## Volume Structure Analysis
The volume profile tells a compelling story:
- Heavy Volume: 0.70-0.85 zone (value area)
- Volume Void: Above 0.975 (rejection zone)
- Interpretation: The thin volume above resistance indicates this is an "unfair" price - the market quickly rejects these levels to return to the accepted value area below.
## Divergence Confluence
### Classic Bearish Divergence
- Price: Higher high at Point 5
- RSI: Lower high (46 vs previous)
- MFI: Lower high confirming momentum loss
### Hidden Bearish Divergence (CVD)
- Price: Lower high structure
- CVD: Higher high showing distribution
- OBV: Similar hidden divergence pattern
- Meaning: Smart money is distributing into retail buying
## Advanced Technical Markers
### VWAP Analysis
Anchoring from Point 1 shows Point 5 precisely hitting the 2nd standard deviation - a statistically significant reversal zone where price typically mean reverts.
### Andrews Pitchfork
Using Points 2, 3, and 4 for construction, Point 5 touches the outer median line - a classic reversal point in pitchfork theory.
## Footprint Chart Revelations
The volume footprint provides surgical precision:
September 13, 5:00 AM:
- Bullish candle close ABOVE bullish imbalance
- BUT closes BELOW bearish imbalance
- Delta: NEGATIVE despite bullish bar
- Signal: Delta divergence = hidden selling
September 13, 5:00 PM:
- Closes below bearish imbalance
- Negative delta confirms selling
- No bullish warnings present
Additional Footprint Observations:
- Absorption visible at resistance (large volume, no progress)
- Negative cumulative delta during rallies
- Buy imbalances getting filled while sell imbalances hold
## Risk Management
Entry: 0.8987 (current price)
Stop Loss: 1.0598 (above Value Area High and volume profile resistance)
Target: 0.6212 (68.59% move)
Risk/Reward: 1:4.03
Position Sizing: Given memecoin volatility, use 50% of normal position size
## Market Context
- Local downtrend intact (lower highs, lower lows)
- Bitcoin correlation weakening (independent price action)
- Memecoin sector rotating out of favor
- Volume declining on rallies, expanding on selloffs
## Trade Execution Notes
Confirmation Signals:
- Break below 0.8900 with volume
- CVD continuing lower
- Failure to reclaim 0.9000 on any bounce
Invalidation:
- Acceptance above 0.9750 (multiple 4H closes)
- CVD turning positive above resistance
- Volume expansion on breakout
## The Edge
This setup combines:
1. Proven market structure (objective seller strength)
2. Multiple divergences (classic and hidden)
3. Statistical extremes (VWAP 2nd deviation)
4. Footprint confirmation (delta divergences)
5. Clean risk/reward with defined stop
The confluence of volume analysis, divergences, and footprint data creates a high-conviction short opportunity in an already weak market structure.
long fartcoin swing 13sept Possible long FARTCOIN
- W stoch golden cross
- The grab W hold support and bounce
- 1321 ema about to cross W
- good atmosphere crypto
- btc dom good, altseason index good, total 123 good, stable.d good,
- no fud, rate cut fix
market entry or limit entry

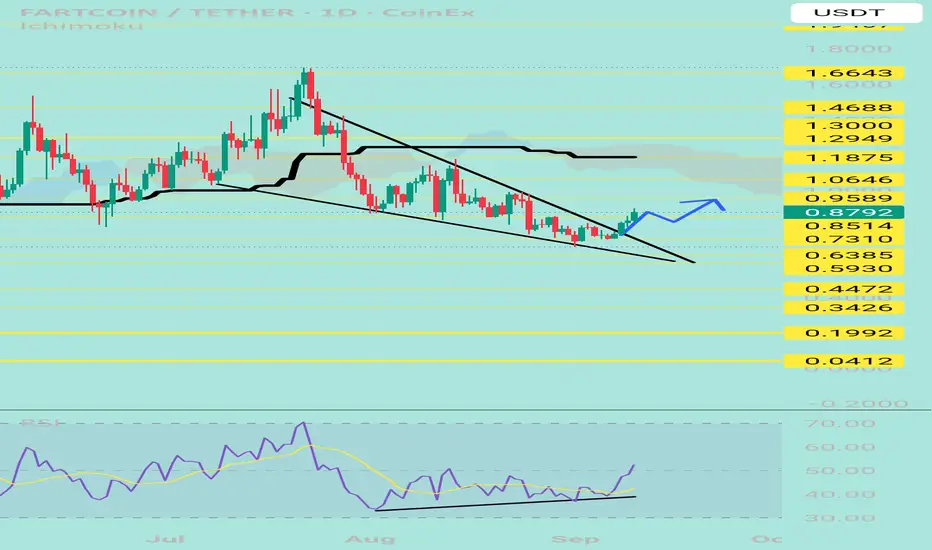
FARTCOINUSDTHi snipers. On the one-day timeframe, we witnessed the formation of a descending triangle, which, along with a divergence, was able to form an upward breakout. Given the increase in trading volume, I expect the price to grow further. I am practicing and learning, and this is not a buy or sell recommendation.
FARTCOIN scalp short ideaTesting my indicator with a small system of filter, scalp short here:
-Small Bear Divergence, also Overbought zone.
-Trend look exhausted need reset.
This is a test trading idea, building something new, not a final indicator.

$FARTCOIN - Boomerang Setup FormingMEXC:FARTCOINUSDT | 2d
Boomerang setup forming, looks like it’s attempting for a breakout.
If price rejects at weekly rolling vwap, here's my POIs:
.67–.64 (lower edge)
.57–.52 (yearly rvwap)

Simple idea on Resistance And Support + entryEverything Base on just Resistance And Support Looks Pretty Strong up there
Also Add a Entry
Let me know What you guys Think

FARTCOIN LONGSoo hello and welcome back
I have identified a new weekly range and a potential to make some gains with fartcoin
On the graph you can see why
1. Weekly bull FVG gap filled
2. LQ swept hence there is money to make a move
3. CIOD on the 4H and tapped a 4H OB
anything else is seen on the graph !
Good luck and do not overtrade
