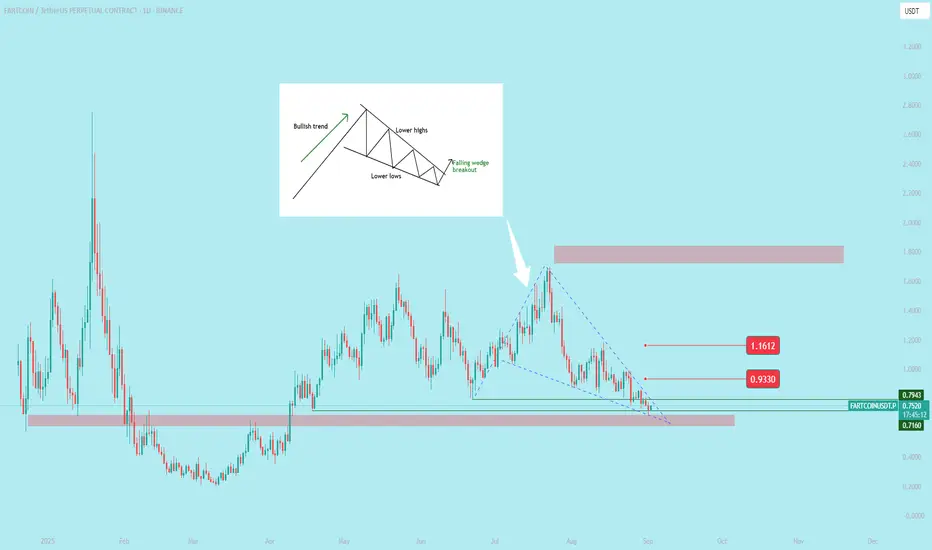
$FARTCOIN Performing falling wedge patternThe falling wedge is a bullish chart pattern in technical analysis that signals a potential price reversal to the upside.
Key characteristics of a falling wedge
Downward-sloping trendlines: The pattern is contained by an upper resistance line connecting lower highs and a lower support line connecting lower lows.
Converging lines: The space between the two trendlines narrows as the pattern progresses, indicating a decrease in volatility and easing selling pressure.
Declining volume: Trading volume typically decreases as the wedge forms, which confirms that the downward momentum is fading.
Bulkowski's statistics: According to research by chart pattern expert Thomas Bulkowski, the falling wedge pattern has a higher success rate for upward breakouts (around 68%) than for downward ones, reinforcing its bullish bias.
FARTCOINUSDT.5S trade ideas
FARTCOIN — Patience First, 1:15 PotentialIdea, not certainty.
Unlike my previous analysis, I’m not treating this as a done deal.
High-timeframe context, so patience is part of the edge. Defined risk, aiming for 1:15.It’s an idea. A shadow on the map.
Some hunts end with teeth in the prey, others end with silence in the woods. Both are fine.
High timeframe means high patience.
Risk-to-reward? 1:15. That’s not a trade, that’s a hunt worth bleeding for.
I move step by step. No rush. No mercy.
If the signals appear, I strike — clean and fast.
If they don’t, I vanish like nothing was ever there.
That’s the rule: no attachment, no begging, no noise.
Either the kill comes to me, or I walk away sharper than before.
Not financial advice. Just a wolf calculating in the dark.

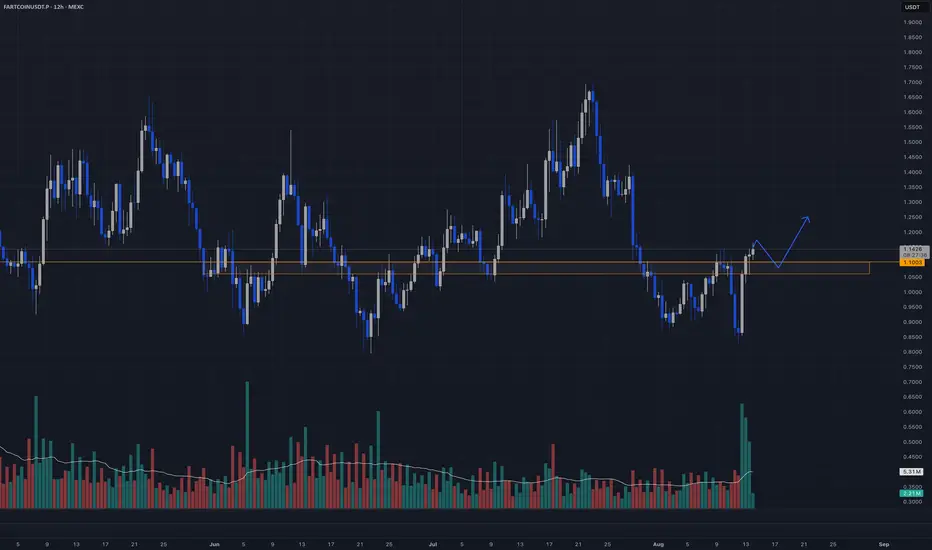
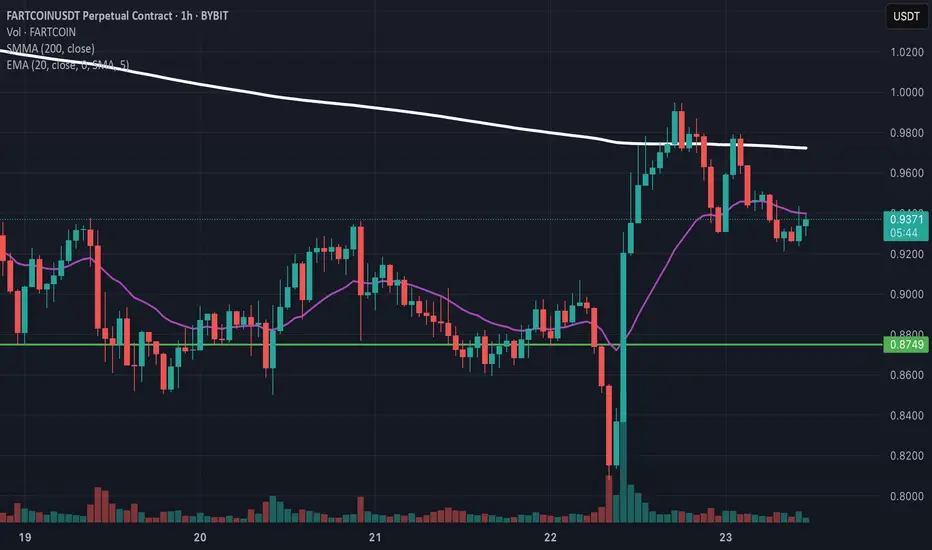
FART long 5xEntry $0.7353
On Trend-line
SL $0.71
Below Daily close
Target $0.85
200EMA Hourly
Risk 3-10
Very low risk
FARTCOIN 4H The chart shows that after a bearish move, the price has reached a key resistance zone around 0.80–0.82. Currently, it is consolidating right at this level, showing indecision in the market.
Key Points:
Major Resistance:
The 0.80–0.82 zone has acted as strong resistance in the past. A confirmed breakout above this level could signal the start of a bullish leg.
Bullish Scenario :
If the price closes above 0.82 with confirmation, upside targets could extend toward 0.88–0.90. The blue arrow highlights this breakout possibility.
Bearish Scenario :
Failure to break above this resistance could trigger a pullback toward the 0.74 and possibly 0.70 support zones.
Risk Management :
Safer entries come after a confirmed breakout. A reasonable stop-loss could be placed below 0.78–0.76 depending on risk tolerance.


FARTCOIN - The air is going to get heavyThis gas is stored since many days so make fire make food and for us scalp and make it a go, sharts happen if breaks red

Hot Air Rises or is this not a fart?If we break lower it was not a fart but a shart
We either fart or we shart

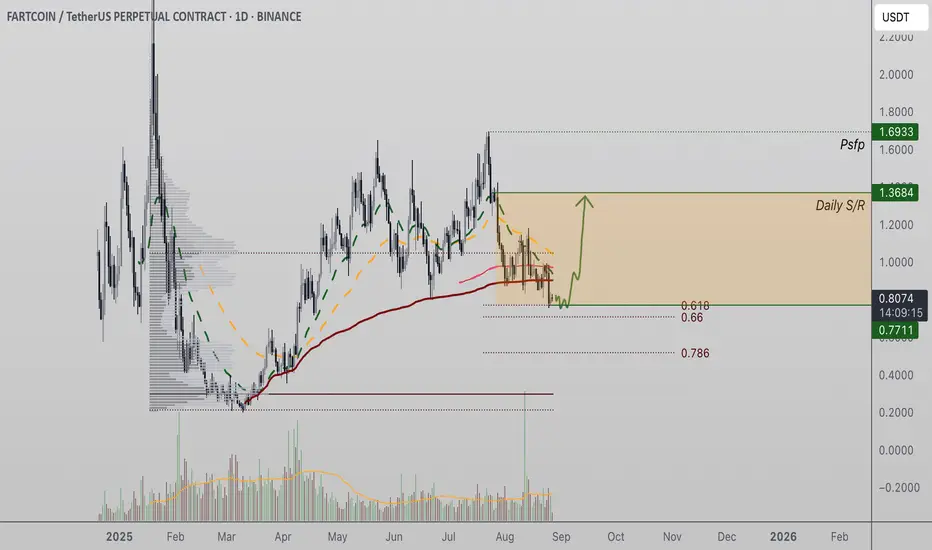
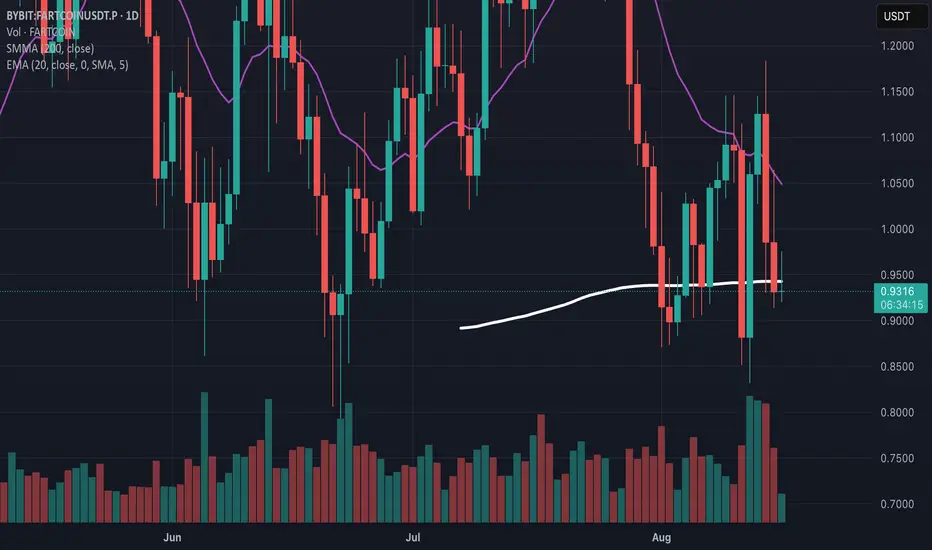
Fartcoin Defends $0.77 Support, Eyes Rotation Toward $1.36Fartcoin has reverted to the $0.77 region, a level reinforced by both Fibonacci retracement and daily support. Multiple daily closes above this zone suggest demand is present, keeping bullish continuation on the table.
The $0.77 mark has emerged as a pivotal region for Fartcoin’s price action, aligning with a critical Fibonacci level and daily support. Recent trading has confirmed demand in this area, with multiple daily closes holding above it. From a structural standpoint, this confluence is crucial in maintaining bullish momentum and setting up the conditions for another rally.
Key Technical Points:
- Support at $0.77: Confluence of Fibonacci retracement and daily support makes this a key level to defend.
- Bullish Engulfing Candle: Liquidity sweep followed by an impulsive rebound signals demand is active.
- Upside Target $1.36: A rotation toward this high time frame level becomes likely if volume inflows confirm.
Price action around the $0.77 level has been decisive. Following a liquidity breach and impulsive candle lower, buyers quickly stepped in to spark a bullish engulfing candle, reclaiming support. This reaction suggests that demand is sitting at this level, providing the first confirmation that $0.77 is acting as a strong floor for continuation. Multiple daily closes above this support reinforce the bullish case and highlight the presence of accumulation.
Market structure also favors a continuation. The liquidity sweep beneath $0.77 has already cleared resting stops, reducing downside pressure. This event is often a precursor to renewed bullish momentum, as liquidity is absorbed and price stabilizes. The subsequent ability of buyers to keep price above $0.77 shows that the structure of higher lows can remain intact, keeping the broader bullish bias alive.
However, the key missing element is volume. While structural support has held and demand is visible, a sustained rotation toward $1.36 requires strong bullish inflows to validate momentum. Without this confirmation, the current price action risks stagnation, with upside capped until participation increases. Monitoring trading volume in the short term will be critical to gauge whether bulls are prepared to push Fartcoin higher.
What to Expect in the Coming Price Action:
If demand continues to defend $0.77 and bullish volume confirms, Fartcoin could rotate toward the $1.36 level, which represents a significant high time frame resistance. A failure to generate volume, however, could keep price consolidating near current levels, delaying the next move.

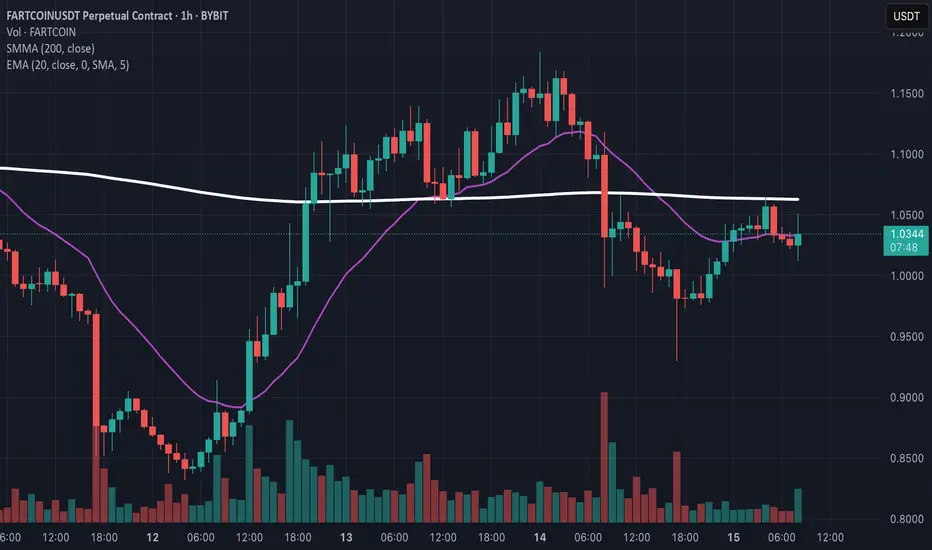
Long x10 FARTEntry $0.94
Above 100EMA on Daily
SL $0.92
Below Close on Daily yesterday
Target $1.03
Sell 50% and B/E
Final Target $1.55
FART Swing long 5xEntry $0.40 buy 70% buying power
$0.33 buying rest of buying power
Using weekly chart
SL $0.11 - Ready to add funds $ if needed
Final target - 5+X ready to buckle up and go on rocket during last push in Bull market

fartcoin updateprice has reacted nicely from fib levels i mentioned earlier in my update it rose around 22% but still be very cautious
it may go down as of now the move towards upside is still 3 wave move that can easily retrace back if btc dom moves higher

Long FART x15Entry $0.82
Target $0.87
SL $0.78
Trading pull back off sell off
Move B/E once hit $0.84

FARTCOIN – Time to step in!Many alts sitting at s/r flips right now. While the market feels heavy going into a much anticipated powell event, and there are some sweeps on higher timeframe to wait for, we can also look for ltf internal sweeps and look for the s/r to hold.
Two things I'm looking out for on FARTCOIN:
- either sweep the recent lows and bounce, then we look to long into 1.30 zone to fill that imbalance.
- lose the local low and no reclaim, then we wait for the green box, which we've been waiting for for months now.


Fartcoin / Usdt GATEIO:FARTCOINUSDT
"This chart’s heating up — price gonna cook soon 🚀🔥"
Be careful market is heating zone.
Disclaimer : Not Financial Advice.

a quick move downward to meet the genesis of strong buyers =SELL*I've marked out 4 points of interest
which will help us create a narrative ,
founded on logic and reasoning.
1. genesis of buyers, highly volitile and
without any structure, very one sided,
as expected with highly volitile moves,
we typically have slower structured
movement from the opposing side,
UNLESS its a profit take (1.1) . in this case it was,
once profit was taken we get to 2
2. a shelf of support created, pushing us up
to the sellers in that micro structure around the
left of 3
4. a push below this structure with strength , the
buyer volume creating that support has become
seller volume
* what do I think will happen ?
* I think for sure the market is curious about what is
left at 1 , or perhaps under 1 , we could also have
the market beind induced to the downside now
and 1 might be the next profit take
* according to chaos theory we have a 51% chance that
price will reach the next orange zone below, according
to stats over the pas 2,500 candles, not the greatest
odds, but .... better than a coin toss?
* regardless, the logical move is down and a 1:1 RR is appropriate
with a stop order.

FART Long x71st Entry $0.87
50% buying power
2nd entry $0.82- Remaining buying power
SL $0.78
Target $1.37 - Sell 100%
Using Daily trend lines for entry
bullish setup on FARTCOINUSDT (15M timeframe)A clear Change of Character (CHOCH) has occurred, signaling a shift in momentum from bearish to bullish after a Swing Structure Shift (SSS). A well-defined demand zone between 0.9063 – 0.9288 is holding, which acts as the key support area. Entry is positioned around 0.9570, with a stop-loss at 0.9063, safely below the demand zone, and a take-profit target at 0.9844. This provides a risk-to-reward ratio of roughly 1:2, which is favorable for a long setup. RSI is neutral around 51.5, showing neither overbought nor oversold conditions, leaving room for price expansion. 📌 Conclusion: As long as price holds above 0.9288, the bullish scenario remains valid with upside potential toward 0.9844. A breakdown below 0.9063 would invalidate this setup and potentially trigger a new bearish leg.

FART Long 5xEntry $1.02- 75% buying power
2nd entry $0.95 - 25%
Entry is below 200 on Hourly
SL $0.88
Sell 50% $1.134 - Then B/E
Final target $1.15
Risk 4/10
FARTCOIN – Hot Air Summer?Fartcoin put in a nice low here, with the local sweep and fast move up.
Now we are filling the imbalance, which could set us up for a new local high, flip the resistance into support and then take a stap at the 1.5 highs again.
If local resistance can't be flipped, I would be looking for a move down into the big orderblock, cleaning up the bad lows and finally retesting htf supply

From Stink to Bank: High-Probability Liquidity Grab LongSome trades whisper… others make a statement. This one might just leave the market speechless.
After two days of locked-in analysis, caffeine overload, and more fibs than a politician, we’ve isolated a textbook Liquidity-Grab Pullback on $FARTCOINUSDT.P.
Yes, the name’s ridiculous — but the structure, orderflow, and risk/reward are dead serious.
This is where smart money quietly sets the table… before the real gas hits.
📊 BINANCE:FARTCOINUSDT.P — Liquidity-Grab Pullback
🎯 Direction: Long (only after downside sweep confirmed)
📍 Entry Zone: 1.06 – 1.10 (15m bullish OB/FVG from BOS leg; 0.382–0.618 retrace)
🛑 Stop Loss: 0.99 (below sweep low / OB edge; ATR buffer)
💰 Targets:
• TP1 — 1.25
• TP2 — 1.33
• TP3 — 1.45
📐 RR Ratio: ~2.7 : 1 (to TP2)
🧠 Trust Meter: █████████▒▒ — 90%
⸻
🔍 Plan & Context
• HTF Bias (12H): Range base just swept, primed for rotation into mid–upper range.
• Sweep: Look for wick through 1.02–0.99 that closes back inside → liquidity taken.
• Trigger: After sweep, wait for 15m BOS up (close >1.12–1.14).
• Entry Mechanics: BOS up → buy pullback into 1.06–1.10 OB/FVG aligned with Fib pocket.
• Orderflow Filter: Sweep bar vol ≥1.5× 20-bar avg; CVD absorption + BOS needed.
• Macro Context: BTC.D dropping — alt long environment.
⸻
📏 Management
• SL → BE+fees at TP1, then trail under 5m HLs.
• Time-stop: no new HH in 50m → cut 50% or exit.
• Invalidate on 12H close < 0.99 or BTC nuking + BTC.D spike.
• Avoid entry ±30m major news.
⸻
🚀 Candle Craft | Signal. Structure. Execution.