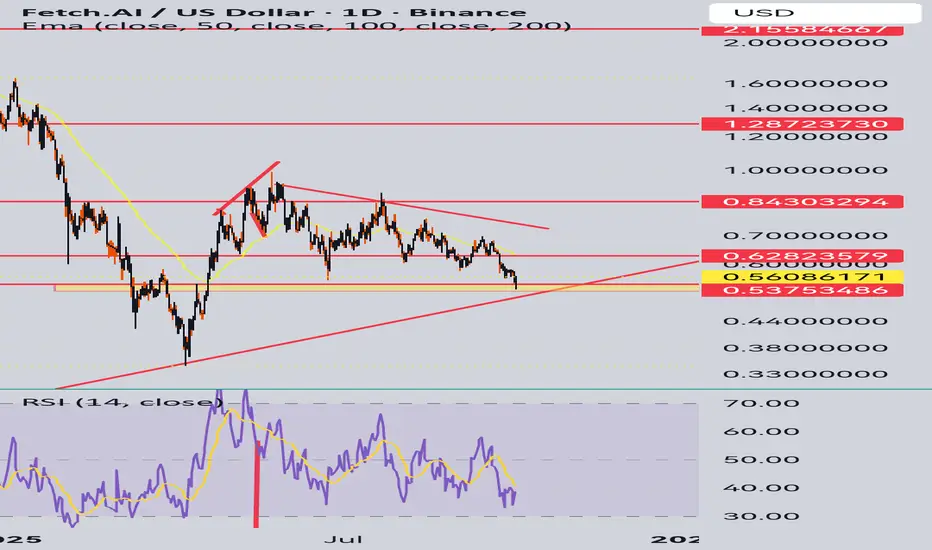
Fetch ai Beautiful backtest. This is the time to buy. Also beautiful 5 waves into suppert. But and put SL just below
FET Macro Outlook, Why Hasn't it moved?NYSE:FET macro still appears to be in an expanding megaphone pattern with an expected terminal target of the R2 pivot at $4.73 almost a 10x from here.
After being one of the best performers late 2024 FET drew a lot of attention and trapped a lot of new investors and traders. This attracts whales,

FET: Eyes Further Gains as Uptrend Remains Intact FET managed to edge higher since last Thursday, further advancing orange wave b as we had primarily anticipated. We still expect its corrective high below the resistance at $1.16 before orange wave c likely triggers a decline toward support at $0.55. Above this level, we anticipate the low of blue w

$FET is coming for it!Pretty obvious play here for FET (unless market for some reason dumps randomly)

$1 soon? - FET weekly analysis Aug 31 - 6thFetch.ai displayed a very clear structure in Minor Wave 1, followed by a deep retracement in Minor Wave 2, which is quite typical for altcoins. This correction unfolded as a Double Three, consisting of a ZigZag in Wave w and a Flat structure in Wave y. Overall, this places us in Intermediate Wave 3,

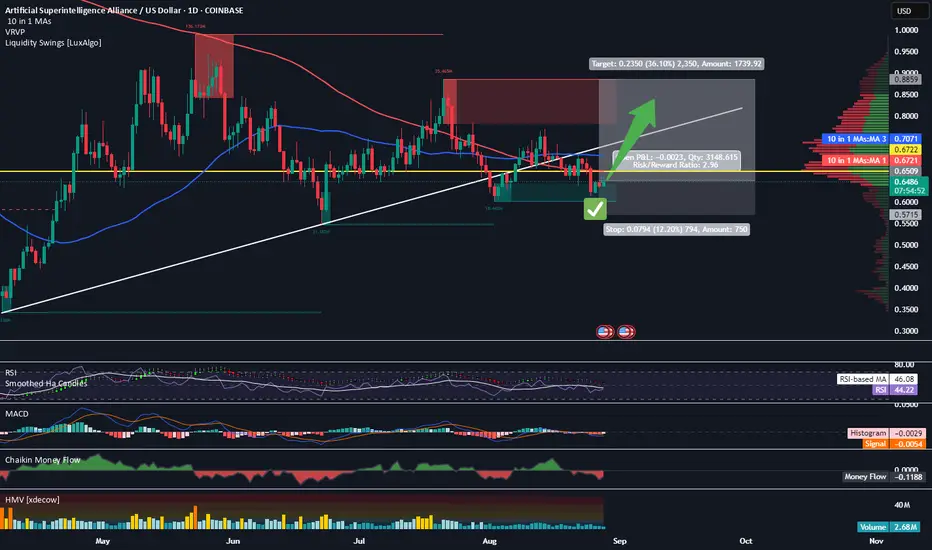
Long Signal Given on Fetch AIFetch AI runs hot when it goes. Recently, I received a BUY alert from my indicator letting me know that we’re getting close to another run soon. I have entered here and will have a fairly conservative target of .88. My SL is .57, giving me a fairly modest 1:3 rrr. My plan is to sell half at the targ
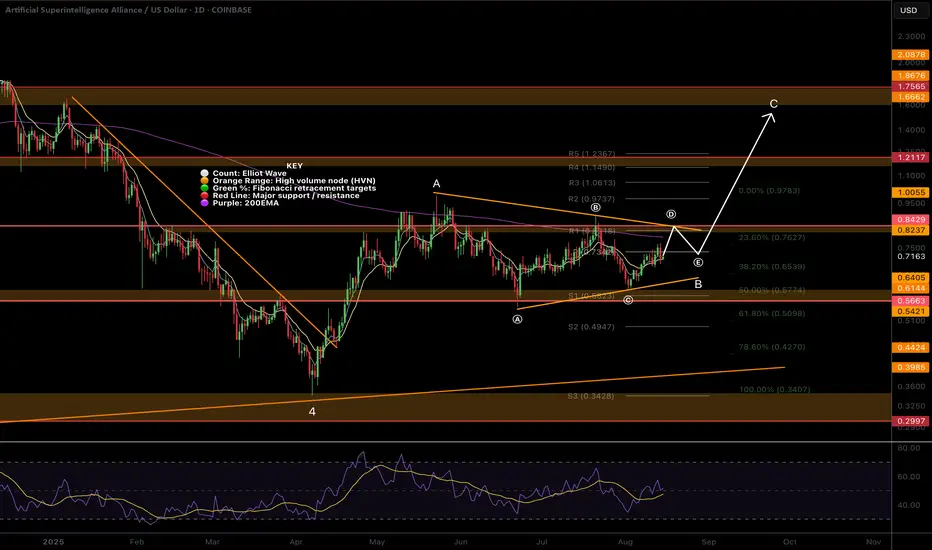
FET Wave 2 Underway, Triangle InvalidatedWave C of 2 appears to be underway for $FET. With the 1:1 extension target from wave A lines up with the golden pocket retracement and S2 daily pivot so is definitely an area to watch.
RSI has room to fall into oversold.
Price failed 2 tests of the descending daily 200EMA, we expect price to break

Sell sell sell - FET weekly update Aug 17 - 23thFetch.AI presents a very clear structure. At this stage, we are most likely in Intermediate Wave 3, Minor Wave 2, and Minute Wave C. This structure aligns well with that of other altcoins, which further supports the scenario. Broadly speaking, I expect a deep Minor Wave 2 correction, after which Min

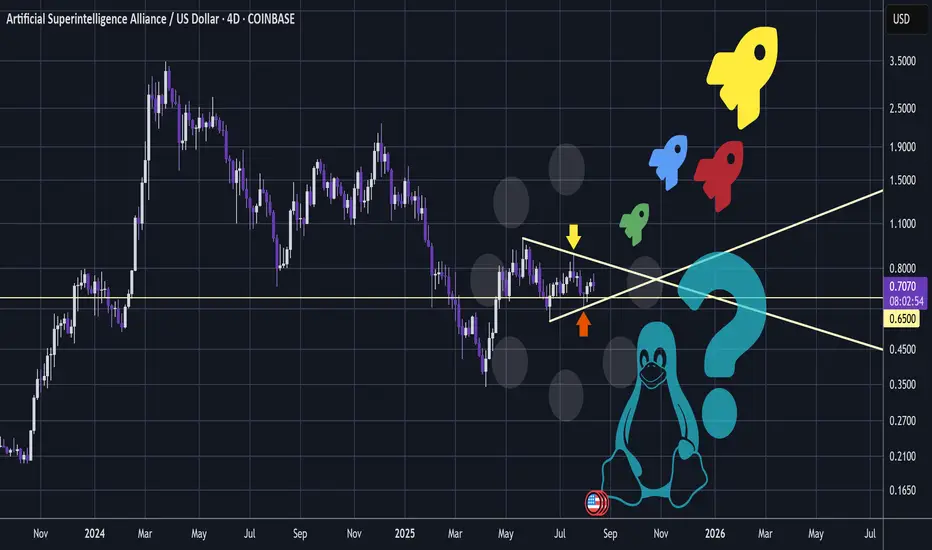
FET - Potential Accumulative BuyFET #59
With Bitcoin having a slump and FET remaining shallow, I think this might be a good area to start buying up FET.
Currently it is @ $0.71 which is just below the apex of what appears to be a contracting triangle.
Notice that there is a higher low and a lower high to form this shape.
These
$FET Elliot Wave Updated, Triangle forming?NYSE:FET appears to be printing a triangle in a larger degree wave B of an ABC counter-bear trend correction.
Wave (D) is expected to finish at the descending resistance, poking above the daily 200EMA, while wave (e) is often shallow so expected to end at the daily pivot point. The target is $1.6
See all ideas
Summarizing what the indicators are suggesting.
Oscillators
Neutral
SellBuy
Strong sellStrong buy
Strong sellSellNeutralBuyStrong buy
Oscillators
Neutral
SellBuy
Strong sellStrong buy
Strong sellSellNeutralBuyStrong buy
Summary
Neutral
SellBuy
Strong sellStrong buy
Strong sellSellNeutralBuyStrong buy
Summary
Neutral
SellBuy
Strong sellStrong buy
Strong sellSellNeutralBuyStrong buy
Summary
Neutral
SellBuy
Strong sellStrong buy
Strong sellSellNeutralBuyStrong buy
Moving Averages
Neutral
SellBuy
Strong sellStrong buy
Strong sellSellNeutralBuyStrong buy
Moving Averages
Neutral
SellBuy
Strong sellStrong buy
Strong sellSellNeutralBuyStrong buy
Displays a symbol's price movements over previous years to identify recurring trends.
Curated watchlists where FETUSD.P is featured.

AI Coins: Robots are here
25 No. of Symbols
See all sparks