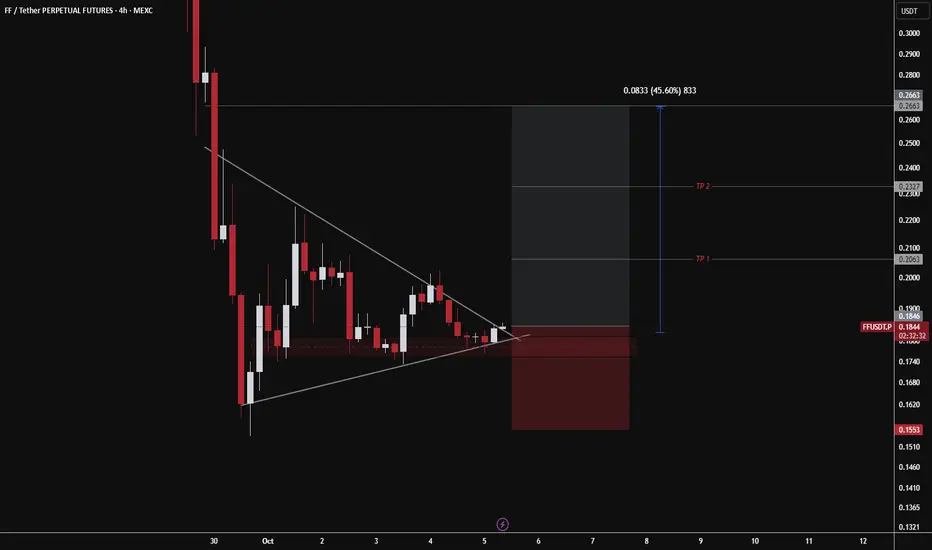
FF/USDT – Stabilizing After 70% Drop, Base Formation Signals RecAfter a sharp 70% decline from its listing highs, FF is finally showing signs of stabilization and base formation. Price action has started to consolidate within a well-defined support zone, suggesting that sellers are exhausted and buyers are gradually stepping in to accumulate.
FFUSDT.P trade ideas
FFUSDT Coin 15 Min. Technical AnalysisFFUSDT Coin 15 Min. Technical Analysis
Falcon Finance, a newly listed coin on the exchanges, is currently moving sideways in the 15-minute technical analysis. As long as it is priced above the 0.239 support, there may be a possibility to test the 0.507 resistance in the future.
Resistances: 0.2897 - 0,3115 - 0,3436 - 0,3732 - 0,3961 - 0,4377 - 0,5071
Supports: 0,2397 - 0,2000
We would appreciate it if you rocket our posts. Also, don’t forget to share on your social accounts.
Legal Disclaimer:
The information, opinions, and recommendations contained here do not constitute investment advice. Investment advisory services are provided within the framework of an investment advisory agreement to be signed between clients and brokerage firms, portfolio management companies, or non-deposit banks. The content written on this page only reflects personal views. These views may not be suitable for your financial situation, risk, and return preferences. Therefore, investment decisions should not be made based solely on the information and writings here.

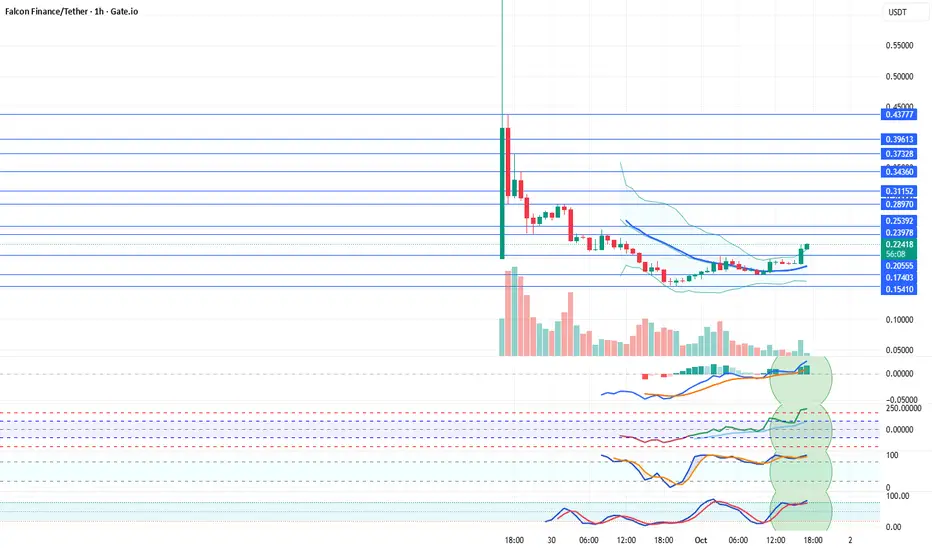
FFUSDT 1 Hour Technical AnalysisFFUSDT 1 Hour Technical Analysis
Falcon Finance Coin has risen above its 21-day moving average. After the sharp decline following its listing, it now appears to be recovering. Having broken above the 0.20555 resistance, we believe Falcon Finance Coin may continue its upward movement if indicators remain positive. Resistance levels will be monitored closely.
Resistances: 0.2397 – 0.2539 – 0.2897 – 0.3115 – 0.3436 – 0.3732 – 0.3961 – 0.4377
Supports: 0.2055 – 0.1740 – 0.1541
We’d appreciate it if you 🚀 rocket our posts. Also, don’t forget to share them on your social media accounts.
Legal Disclaimer:
The information, comments, and recommendations provided here do not constitute investment advisory services. Investment advisory services are offered within the framework of an investment advisory agreement to be signed between the client and brokerage firms, portfolio management companies, or non-deposit banks. The content shared on this page reflects only personal opinions. These views may not be suitable for your financial situation, risk profile, or return preferences. Therefore, no investment decisions should be made based on the information provided here.
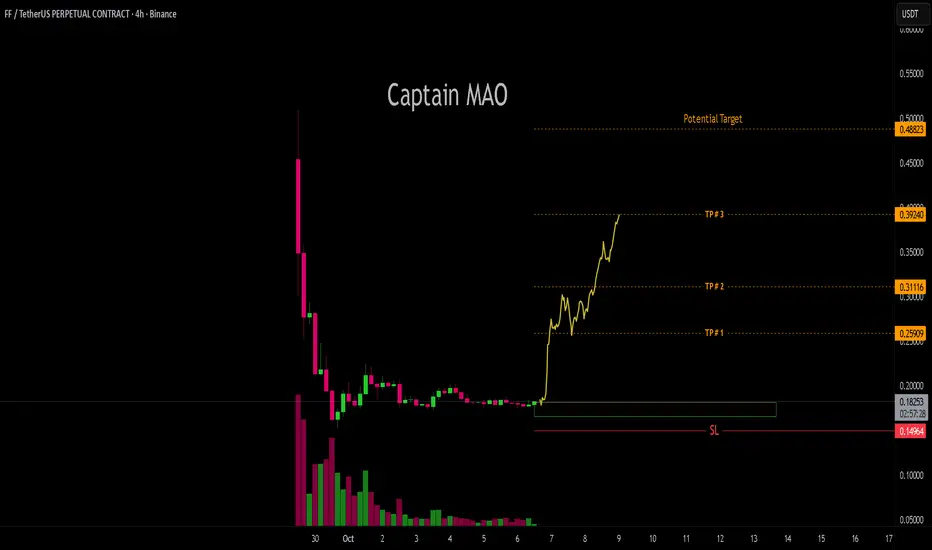
FF📊 FF/USDT Setup (4H)
🟢 Pattern:
A Falling Wedge Pattern has formed, which is technically a common signal of potential bullish reversal. The price is also rebounding at a minor support area after several failed attempts to break lower — indicating buyers are starting to step in.
📈 Entry Zone:
Around the 0.1800 – 0.1860 area (retest of the wedge breakout).
$FF short scalp lookNYSE:FF has had a glorious rise from the lows today, up about 30%. On the LTF (low time frame), there is a clear uptrend, but NYSE:FF just fell down out of the trend and is rejecting off of it.
New coins are very risky to trade as there isn't much chart structure, so keep this in mind if you are trading them. You cannot rely on supports and resistances or any TA too confidently as the chart structure is developing in real time.
Nonetheless, I anticipate some profit taking and some short term downwards momentum. I will close the trade if it blasts above the $0.22 area and retests with upwards momentum.
