File coin is about to make a big move !!!Short term 3.5 is easily available for file coin
8 dollars in medium term is possible
Trade ideas

$FIL Trendline Test – Support Hold or Channel Break?BINANCE:FILUSDT LSE:FIL Trendline Test – Support Hold or Channel Break?
Current trend: FIL's in a steep descending channel, slamming into the 1.95 support after rejection from 5.20 resistance—volume spike on the dip shows buyers scrambling 🛡️.
Hold support? Probable yes; channel base and prior lows aligning for a potential hammer bounce.
Breakout above resistance? Tough without 5.20 clear—needs strong close for 6-8% reversal pump 🚀.
Dip risk? High to 1.80 if breaches, accelerating the downtrend.
Target: Rebound to 2.30 on defense; downside 1.70 floor.
Indicators tracking: RSI (29, extreme oversold), Trendline slope, and MACD divergence 📉.
#FILTrading #CryptoChannel #FiboTrendCrypto

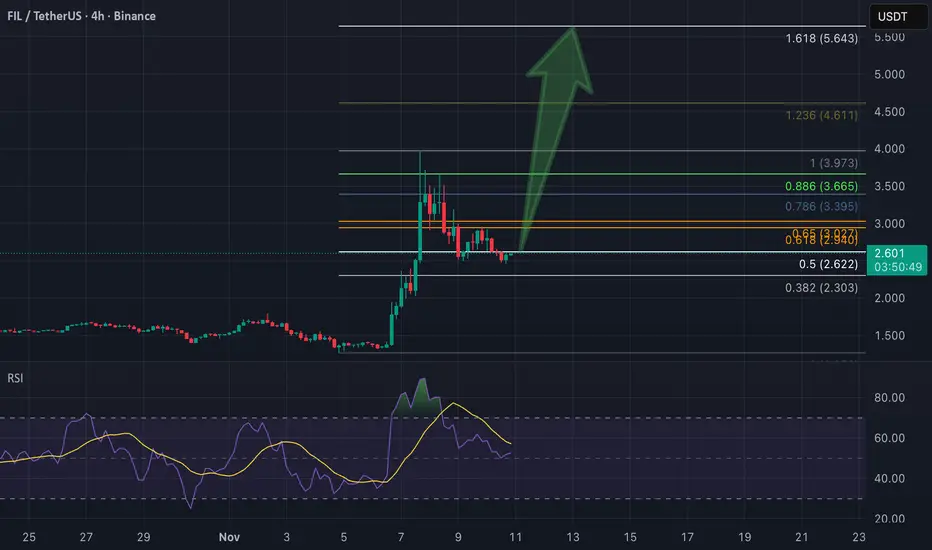
Filecoin 4H Outlook: Possible Rebound After PullbackFilecoin made a strong move up and then started to cool down, pulling back to the 0.5 Fibonacci zone around $2.6. This area now works as support where buyers are stepping in.
If price holds here, the next resistance is at $2.92-3.00, and then $3.40-3.65. A breakout above $3.65 could push FIL toward $3.97, then $4.61, and maybe up to $5.64.
But if price closes below $2.30, the bullish setup will be canceled and we could see a deeper drop.
Summary:
📈 Pattern: Strong move up with Fibonacci pullback
🟢 Support: $2.50-2.60
🔵 Resistance: $2.92-3.65
🎯 Targets: $3.97 - $4.61 - $5.64
⚠️ Cancel: 4H close below $2.30
RSI is starting to rise from low levels, showing early signs that buyers may take control again. A candle close above $3 would confirm the move and then, let's follow the volume.
A good entry point for this setup would be around $2.55-2.65, close to the 0.5 Fibonacci zone, where price has already shown signs of holding support.
Here’s how we could plan it:
Entry: $2.55-2.65
Stop loss: Below $2.30 (to protect from deeper drop)
Targets:
TP1: $2.92
TP2: $3.40
TP3: $3.97+
This gives roughly a 1:2.5 to 1:3 risk/reward, which is solid if Bitcoin stays stable or moves up.
FILin weekly view, FIL just closed the 1str FVG and now i expect to overcome the actual price to make second leg of pump.
Next target should be 3$-3.5$ and if bulls will take over very possible to reach 5$
according to the other projects that spiked 300-500% of pumps
NFA
DYOR

FIL - Momentum Shift Confirmed!📈After months of trading within a bearish descending channel, FIL has finally broken out with a strong bullish impulse, signaling a clear shift in market momentum. This breakout marks a potential end to the prolonged downtrend and the beginning of a new bullish phase.
🏹From here, I’ll be looking for trend-following long setups on every healthy correction, ideally after retesting the broken structure zone. The next key target lies around the $5 round number, which also aligns with a major resistance area on the higher timeframe.
⚔️As long as FIL holds above the previous breakout zone, the bulls remain in control.
⚠️ Disclaimer: This is not financial advice. Always do your own research and manage risk properly.
📊All Strategies Are Good; If Managed Properly!
~Richard Nasr

#FIL / $FILUSDT Massive breakout confirmed from the long-term #FIL / BINANCE:FILUSDT
Massive breakout confirmed from the long-term falling wedge after months of accumulation! 🚀
Currently retesting the breakout zone near $2.0–$2.3 as long as it holds this level, the structure remains strongly bullish.
Short-term targets: $3.2 → $4.0
Mid-term potential: $6.0+

FIL USDT LONG SIGNAL---
📢 Signal Alert
🔹 Pair: FIL / USDT
📈 Trade Type: Long
💰 Entry Zone: 2.620 – 2.536
🎯 Take-Profit Targets (Partial Management):
▫️ TP1 = 2.893
▫️ TP2 = 3.129
▫️ TP3 = 3.380
▫️ TP4 = 3.694
▫️ TP5 = 4.272
🛑 Stop-Loss: 2.450
📊 Timeframe: 1H
⚖️ Risk/Reward Ratio: 9.0
📌 Suggested Leverage: 3x – 5x
⚠️ Capital management is mandatory.
💬 Please review the chart before entering the trade.
---
🧠 Technical Analysis Summary:
FIL is showing a strong accumulation pattern above the 2.50 support zone, with buyers stepping in aggressively at each retest.
A confirmed bounce from this level can push price toward the 3.12–3.38 resistance range in the short term, followed by potential continuation to 3.69–4.27 if momentum sustains.
RSI is recovering from the oversold region, and volume shows rising bullish interest.
EMA 20 crossover above EMA 50 on the 1H timeframe supports a possible mid-term reversal trend.
---
⚙️ Trade Management Tip:
🔸 Take partial profit at TP1, then move stop-loss to entry.
🔸 For TP3–TP5, trail stop using last swing low or EMA 20 to maximize profit.
🔸 Avoid re-entry if price closes below 2.45 with volume.
---
⚠️ Disclaimer:
This signal is shared for educational and analytical purposes only.
Always DYOR (Do Your Own Research) and use proper risk management before entering any trade.
---

FIL/USDT – Falling Wedge Breakout + Retest | Bullish Reversal ExFIL/USDT has broken out of a clean Falling Wedge pattern on the 45m timeframe and is currently retesting the upper trendline.
This retest zone is a high-probability area for bullish continuation if buyers hold above the breakout level.
📈 Technical Highlights
Falling Wedge breakout successfully completed
Price retesting the trendline support
Bullish structure forming above $2.06
Strong upside targets if retest confirms
💹 Trade Plan
Entry: $2.06 – $2.10
Stop Loss: $1.85
TP1: $2.35
TP2: $2.68
TP3: $2.90
⚠️ Invalid Scenario
If FIL closes below $2.04 (45m candle), the retest fails and bullish setup becomes invalid.
📢 Note
This is a technical analysis idea only — not financial advice.
Always manage risk and trade safely.

FIL/USDT Setup After a strong impulsive move to the upside , FIL has entered a healthy retracement phase , likely aiming to fill the recent imbalance left behind on lower timeframes.
The overall market structure remains bullish , with higher highs and higher lows intact.
I’m watching for price to revisit key demand zones or mitigate imbalances before continuing the next leg up.
Key points:
🚀 Strong bullish momentum following recent breakout
🔁 Current retrace likely to fill imbalances (FVGs) on H4 / H1
🧭 Looking for confirmation around demand zones or liquidity sweep below recent lows
🎯 Upside targets: previous swing high → potential expansion toward next resistance zone
Trading idea:
Wait for bullish confirmation at key imbalance/demand areas before entering. Manage risk accordingly — this setup favors continuation if structure holds and the retrace completes cleanly.

$FIL Trendline Siege – Support Battle Rages?BINANCE:FILUSDT LSE:FIL Trendline Siege – Support Battle Rages?
Current trend: FIL's in a steep channel descent from 5.5K highs, now scraping 1.96 support after sharp rejection—sellers relentless, but volume taper hints at capitulation nearing 🛡️.
Hold support? Even odds yes; prior lows and EMA confluence could mount defense for quick snapback.
Breakout above resistance? Setup if 2.50 closes above trendline—potential 6-8% rally to 2.70 on BTC mercy 🚀.
Dip risk? Elevated to 1.80 on crack, liquidation clusters waiting to ignite.
Target: Upside 2.30 on hold; downside 1.85 buffer.
Indicators tracking: RSI (26, ultra-oversold), Trendline violation watch, MACD death cross 📉.
#FILTrading #CryptoDip #FiboTrendCrypto

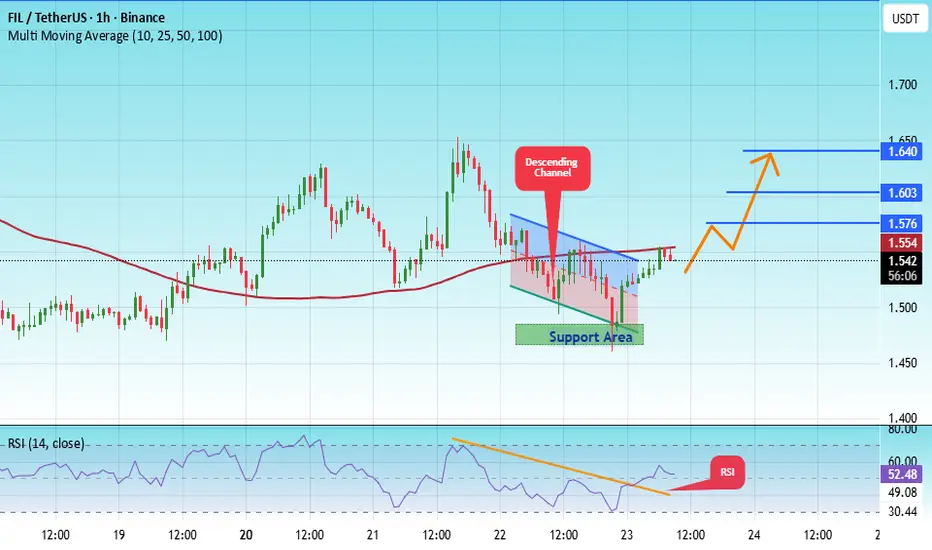
#FIL/USDT Ready for a Breakout? Analysis of a Long Accumulatio#FIL
The price is moving within a descending channel on the 1-hour frame, adhering well to it, and is heading for a strong breakout and retest.
We have a bearish trend on the RSI indicator that is about to be broken and retested, which supports the upward breakout.
There is a major support area in green at 1.47, representing a strong support point.
We are heading for consolidation above the 100 moving average.
Entry price: 1.54.
First target: 1.57.
Second target: 1.60.
Third target: 1.64.
Don't forget a simple matter: capital management.
When you reach the first target, save some money and then change your stop-loss order to an entry order.
For inquiries, please leave a comment.
Thank you.
FILECOIN - Can It Sustain the Breakout?FILECOIN is showcasing impressive strength today, currently trading around $3.33
After bottoming at $1.26, price rallied to a high of $3.97 before consolidating near $3.30s
Filecoin has drawn traders’ attention after a sharp breakout from its long consolidation phase. The 3-day chart shows a strong surge, just below its diagonal key resistance.
If bulls maintain momentum and secure a breakout above this zone, Filecoin could extend its rally toward $5 to $5.50, a level that aligns with prior structural resistance.
That said, traders should monitor the $3 to $2.60 support zone for potential retests before continuation.
FIL’s recovery underscores the project’s strong fundamentals and persistent investor confidence. The coming days will reveal whether this move evolves into a full bullish reversal.

FILUSDT 1W#FIL seems to have found its bottom and has started to take off. Let’s zoom out and look at the weekly chart — the first thing that stands out is the biggest weekly volume candle, which is a super bullish signal.
On the other hand, #FIL is moving within a large falling wedge pattern and is currently facing a major resistance cluster that includes the wedge resistance, the weekly SMA50, and the Ichimoku cloud. A breakout above this cluster could trigger a strong rally toward the following targets:
🎯 $5.451
🎯 $7.172
🎯 $10.661
🎯 $13.481
🎯 $16.301
🎯 $20.316
🎯 $25.430
⚠️ Always remember to use a tight stop-loss and maintain proper risk management.

FILUSDT — the formation is repeating, the structure is familiar.Filecoin(FIL) - is a decentralized storage system with the goal of "storing humanity's most important information." During its initial coin offering (ICO) in 2017, the project raised $205 million. The launch was initially planned for mid-2019, but the mainnet launch date was postponed until block 148,888, which occurred on October 15, 2020.
📍 CoinMarketCap : #50
📍 Twitter(X) : 667.3K
🔍 What I observe:
I’ve added the full trading history to the chart for better understanding (the chart on exchanges is cut off). The coin is liquid. I also added the prices for the public and private offerings.
There’s a large horizontal channel, or more specifically, a channel within a channel, which has been active for about 1111 days.
After another drop, a descending wedge formed, and now we are witnessing a breakout of its resistance (a retest is possible).
These patterns are ones I regularly track and trade, based on personal experience accumulated over the years and my strategy.
📊 I’ve plotted the nearest resistances and target prices with movement percentage calculations.
💭 It’s quite possible that this formation in the lower part of the wedge, coinciding with the area of lows on the support of the outer channel, was used to gather liquidity and shake out weak hands.
I also want to point out the large wicks in this zone - a characteristic pattern for accumulation points and subsequent reversals.
______
📌 Not financial advice. Observing structure and recurring phases.
Operate within your strategy and with an awareness of risks.

FIL USDT LONG SIGNAL---
📢 Signal Alert
🔹 Pair: FIL / USDT
📈 Trade Type: Long
💰 Entry Price: 2.370
🎯 Take-Profit Targets (Partial Management):
▫️ TP1 = 2.588
▫️ TP2 = 2.890
▫️ TP3 = 3.129
▫️ TP4 = 3.380
▫️ TP5 = 3.693
🛑 Stop-Loss: 2.280
📊 Timeframe: 1H
⚖️ Risk/Reward Ratio: 16.0
📌 Suggested Leverage: 5x – 10x
⚠️ Capital management is mandatory.
💬 Please review the chart before entering the trade.
---
🧠 Technical Analysis Summary:
FIL is showing a bullish reversal from the 2.28–2.35 demand zone, with strong volume and a break above short-term resistance.
If the price holds above 2.37, momentum could carry toward the 3.12–3.38 zone, where the next major resistance lies.
RSI is rebounding from oversold territory and EMA 20 is crossing upward, confirming early bullish strength.
---
⚙️ Trade Management Tip:
• Secure partial profit at TP1, move SL to entry after breakout confirmation.
• Trail stop after TP2 for optimal profit capture.
• Avoid new entries if price drops below 2.28.
---
⚠️ Disclaimer:
This signal is for educational purposes only and not financial advice.
Always DYOR and follow proper risk management.
---

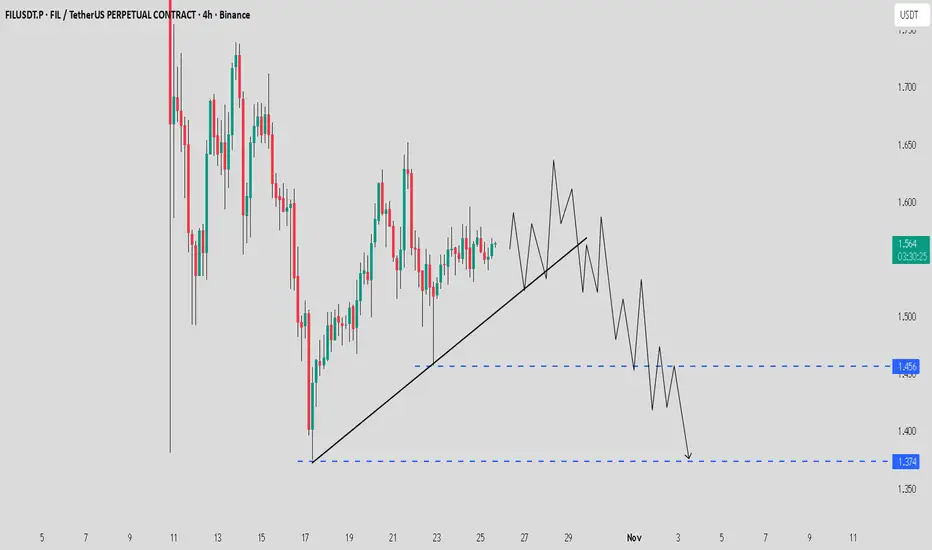
FIL / USDT: Breaking down from channel,10-20% downside potentialFIL / USDT is breaking down from the parallel channel.
Watch for clear confirmation to catch a 10–20% downside move.
⚠ Manage risk wisely and don’t enter without proper confirmation.

FILUSDT - Massive bullish patternIt broke the main trendline with a massive daily candle.
A Golden Cross pattern is forming — the 25 EMA is about to cross above the 50 EMA, as you can see.
The coin has been in accumulation for 276 days, initially breaking down to sweep liquidity, and now it’s trading back near that range.
If it breaks upward, it could easily rally 300% or more from here.
Best Regards:
Ceciliones🎯

FIL USDT SHORT SIGNAL---
📢 Signal Alert
🔹 Pair: FIL / USDT
📉 Trade Type: Short
💰 Entry Zone: 3.264 – 3.351
🎯 Take-Profit Targets:
TP1 = 3.032
TP2 = 2.809
TP3 = 2.627
🛑 Stop-Loss: 3.510
📊 Timeframe: 1H
⚖️ Risk/Reward Ratio: 2.77
📌 Suggested Leverage: 3x – 5x
⚠️ Capital management is mandatory.
Please analyze the chart carefully before entering the trade.
---
🧠 Technical Analysis Summary:
FIL shows bearish momentum after testing a strong supply zone around 3.35, where multiple rejections occurred.
The price has formed a Lower High (LH) structure, confirming a downtrend continuation setup.
🔸 Key Points:
Market structure indicates clear rejection at resistance.
Volume decreasing on retracement, showing weak buyers.
RSI turned below 50, aligning with short momentum.
First target aligns with recent support zone (3.03), while TP3 extends to major demand at 2.62.
Stop-loss is placed slightly above local swing high (3.51) to avoid manipulation wicks.
---
⚙️ Trade Management Tip:
After TP1 is reached, move Stop-Loss to Entry and secure partial profits.
Allow the rest of the position to run toward TP2–TP3 for maximum efficiency.
---
⚠️ Disclaimer:
This analysis is for educational and informational purposes only and is not financial advice.
Always Do Your Own Research (DYOR) and use proper risk management when trading.
---

FILUSDTBINANCE:FILUSDT is now for breakout trendline but should pullback to 1.720$ and start up-trend to 3$.
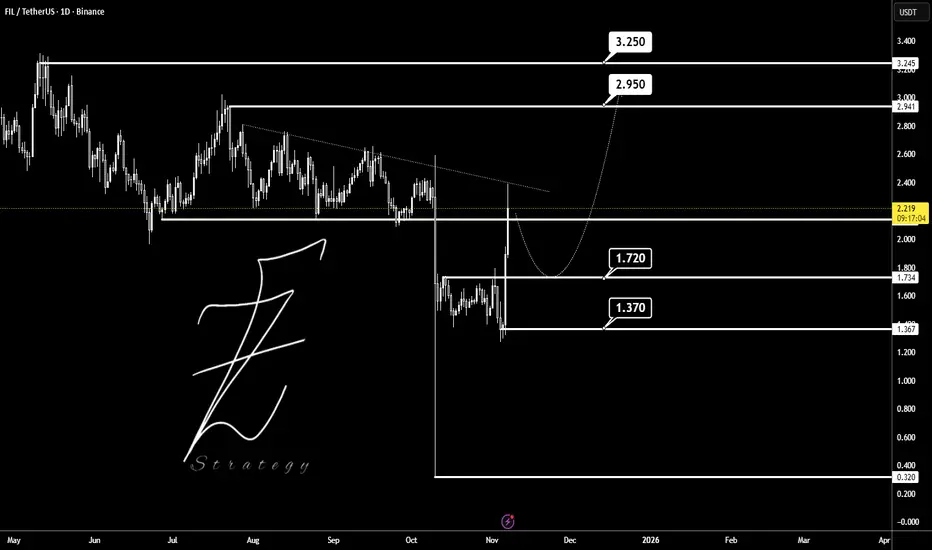
FIL / USDT Eyeing liquidity zone- Possible Reversal setup AheadFIL is showing signs of weakness and appears to be seeking liquidity below the $1.45 – $1.37 zone. If price dips into this area and absorbs liquidity, a potential reversal and trend shift to the upside could follow.
Stay patient, manage risk wisely, and watch how price reacts around the key liquidity zone.
FILUSDT Forming Falling WedgeFILUSDT is forming a clear falling wedge pattern, a classic bullish reversal signal that often indicates an upcoming breakout. The price has been consolidating within a narrowing range around $2.40 USDT, suggesting that selling pressure is weakening while buyers are beginning to regain control. With consistent volume confirming accumulation at lower levels, the setup hints at a potential bullish breakout soon. The projected move could lead to an impressive gain of 90% to 100%+ once the price breaks above the wedge resistance, drawing attention to FILUSDT price prediction in the decentralized storage sector.
This falling wedge pattern is typically seen at the end of downtrends or corrective phases, and it represents a potential shift in market sentiment from bearish to bullish. Traders closely watching FILUSDT are noting the strengthening momentum as it nears a breakout zone near $2.75. The good trading volume adds confidence to this pattern, showing that market participants are positioning early in anticipation of a reversal, especially with recent 67% daily surges signaling renewed interest.
Investors’ growing interest in FILUSDT reflects rising confidence in the project’s long-term fundamentals and current technical strength, particularly its role in powering scalable data storage for AI and DeFi applications. If the breakout confirms with sustained volume, this could mark the start of a fresh bullish leg. Traders might find this a valuable setup for medium-term gains, especially as the wedge pattern completes and buying momentum accelerates in falling wedge breakout crypto opportunities.
✅ Show your support by hitting the like button and ✅ Leaving a comment below! (What is You opinion about this Coin) Your feedback and engagement keep me inspired to share more insightful market analysis with you!


FIL WILL FOLLOW ICPFIL is ready for massive bounce with strong momentum and technicals. Keep an eye on it. Use proper risk management
