#FIL/USDT Ready for a Breakout? Analysis of a Long Accumulatio#FIL
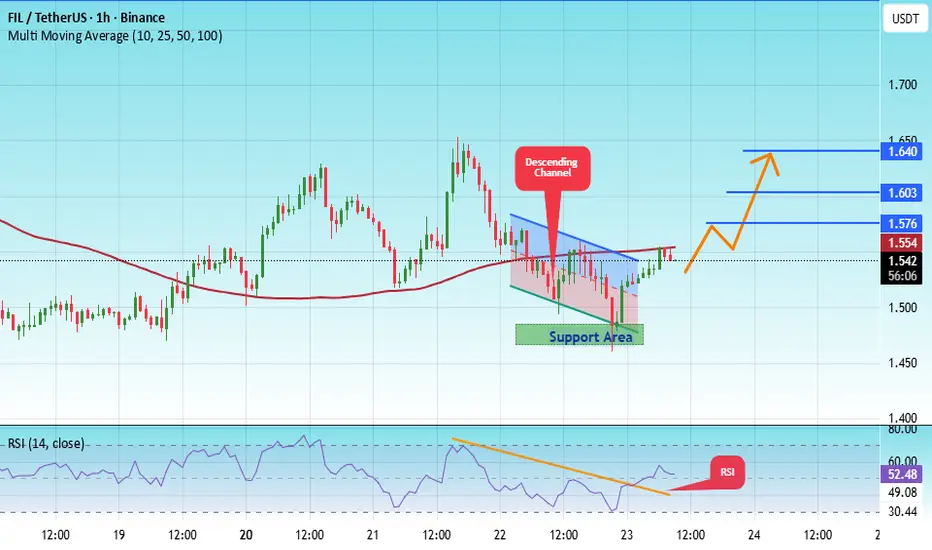
The price is moving within a descending channel on the 1-hour frame, adhering well to it, and is heading for a strong breakout and retest.
We have a bearish trend on the RSI indicator that is about to be broken and retested, which supports the upward breakout.
There is a major support area in green at 1.47, representing a strong support point.
We are heading for consolidation above the 100 moving average.
Entry price: 1.54.
First target: 1.57.
Second target: 1.60.
Third target: 1.64.
Don't forget a simple matter: capital management.
When you reach the first target, save some money and then change your stop-loss order to an entry order.
For inquiries, please leave a comment.
Thank you.
Trade ideas

FILUSDT - Massive bullish patternIt broke the main trendline with a massive daily candle.
A Golden Cross pattern is forming — the 25 EMA is about to cross above the 50 EMA, as you can see.
The coin has been in accumulation for 276 days, initially breaking down to sweep liquidity, and now it’s trading back near that range.
If it breaks upward, it could easily rally 300% or more from here.
Best Regards:
Ceciliones🎯

Short Squeeze doing its thingBINANCE:FILUSDT See that Major Change of Character (CHoCH)? That's where the market flipped its intent.
Volume is still holding strong, and no clear sign of distribution yet. The market is cooling slightly after the squeeze, but the trend structure looks intact, higher lows, higher highs, and plenty of momentum – the thing is, Filecoin still sounds pretty strong to me, and I don’t mind a minor correction here to shake out the paper hands.

FIL WILL FOLLOW ICPFIL is ready for massive bounce with strong momentum and technicals. Keep an eye on it. Use proper risk management

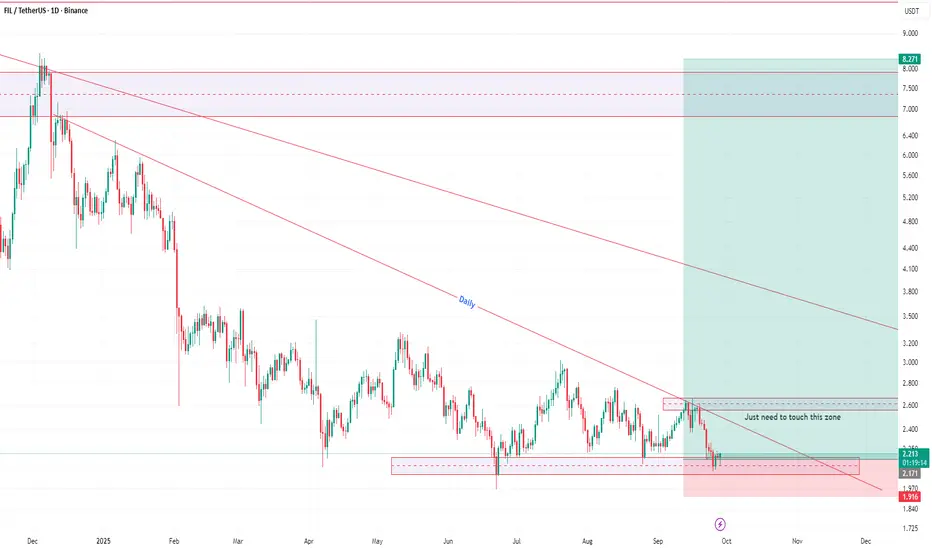
FIL/USDT — The Big Test: Real Breakout or Just Another Trap?After months of being trapped under a strong descending trendline, Filecoin (FIL) is finally showing signs of awakening. A strong bullish candle on the 2D timeframe has pierced through the long-term downtrend line — but the question remains: is this the beginning of a true reversal, or just a fake breakout before another drop?
---
🔹 Overview
Current price around $2.24, testing the descending trendline (yellow).
Key resistance levels: $2.65 → $3.27 → $4.875 → $6.07 → $7.88 (High $8.42).
Major support zones sit at $1.25–$1.50, with psychological support near $1.05.
---
🔸 Technical Pattern Analysis
The chart shows a prolonged accumulation phase beneath a descending trendline — a typical setup before a major directional shift.
The latest breakout candle signals possible momentum change, yet the market hasn’t given full confirmation.
If the next 2D close holds above the trendline and the $2.65 level, that would strongly suggest the end of the long-term downtrend, opening the door for a new bullish expansion phase.
---
🚀 Bullish Scenario
Confirmation Signs:
2D close above $2.65 with strong volume and a clean retest.
RSI and MACD showing momentum shift to the buyers.
Upside Targets:
First target: $3.27 (initial breakout zone).
Next targets: $4.875 → $6.07 → $7.88, if momentum continues.
Strategy:
Conservative entry after retest on trendline / $2.65.
Stop loss below $1.95.
Risk-to-Reward: 2:1 up to 3:1 if breakout holds.
Bullish Narrative:
“If the retest holds, FIL could be entering a new accumulation breakout phase — signaling the end of the long-term downtrend and the start of a mid-term rally toward $4–6.”
---
⚠️ Bearish Scenario
Conditions:
Failure to close above the trendline and fall back below $2.00–$2.20.
Rising sell volume confirming a false breakout or bull trap.
Implications:
Price could revisit the consolidation range $1.50–$1.25,
or even drop to $1.05 if bearish momentum strengthens.
Strategy:
Short entries only on clear rejection candles (strong red 2D + high volume).
Downside targets: $1.50 → $1.25, Stop Loss above $2.65.
Bearish Narrative:
“A failed breakout would indicate the market isn’t ready for a trend reversal — FIL may return to deeper consolidation before any sustainable move up.”
---
🔍 Key Takeaways
Breakout vs Breakdown — the chart is at a critical crossroads.
2D close above $2.65 = bullish confirmation.
Rejection from the trendline = potential for another false rally and continuation of the downtrend.
Momentum suggests something big is approaching — patience and confirmation are key.
---
🧭 Conclusion
The FIL/USDT chart currently represents a classic battle between bulls and bears.
A breakout of a long-term descending trendline doesn’t happen often — and its confirmation will decide the direction for months ahead.
If buyers manage to hold above the breakout level and print a new higher high, FIL could enter a significant recovery phase.
But if momentum fades and sellers regain control, the correction may deepen before any true reversal.
#FIL #FILUSDT #Filecoin #CryptoAnalysis #BreakoutWatch #TrendlineBreak #CryptoTrading #AltcoinAnalysis #TechnicalAnalysis

Fil usdt short signal---
⚠️ Disclaimer:
This analysis represents personal market research and not financial advice.
Always do your own chart analysis (DYOR) and use strict risk management before trading.
---
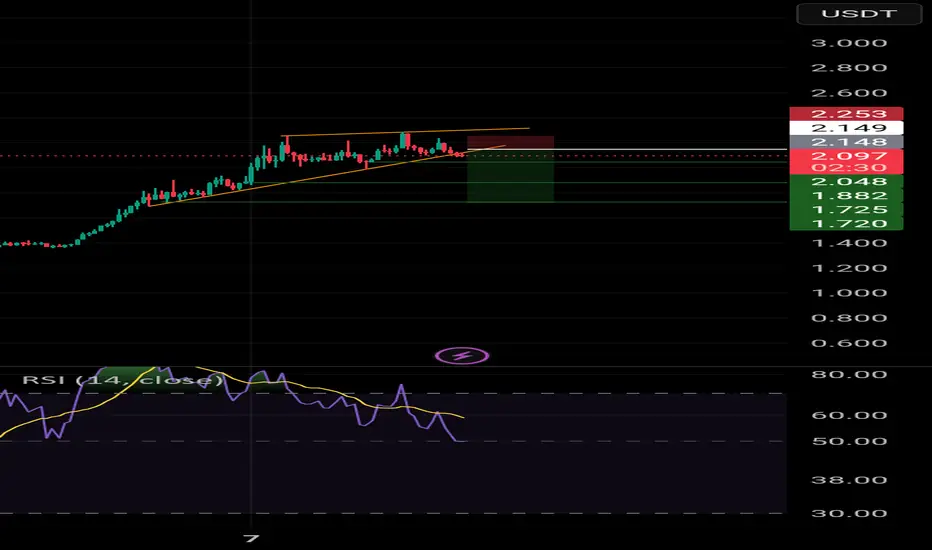
📉 FIL / USDT – Short Setup (15m)
💰 Entry: 2.150
🛑 Stop-Loss: 2.255
🎯 Take-Profit Targets:
TP1: 2.048
TP2: 1.882
TP3: 1.720
⚖️ Risk/Reward Ratio: ≈ 4.84 : 1
📊 Timeframe: 15m
📌 Suggested Leverage: 5x–10x
💥 Risk Level: Moderate–High
---
🧠 Technical Analysis Summary:
FIL is showing signs of bearish reversal after testing resistance at 2.25–2.26, forming a lower high structure.
Price is currently retesting the ascending support line, with bearish candles confirming loss of momentum.
RSI has crossed below 50, signaling strength in sellers, and volume confirms short-term distribution near the highs.
Break below 2.14 confirms downside continuation toward 2.04 (TP1), 1.88 (TP2), and 1.72 (TP3).
Stop-loss at 2.255 protects against false breakouts above the wedge resistance.
🔄 Trade Management Tip:
Once TP1 is reached, move Stop-Loss to Entry (2.150) to secure profits.
For safer execution, wait for a bearish 15m candle close below 2.14 before entering the short.
FIL USDT LONG SIGNAL---
⚠️ Disclaimer:
This analysis reflects my personal opinion only and is not a financial advice or buy/sell signal.
Please analyze the chart carefully and always apply proper risk management before entering any trade.
📢 Signal Alert
🔹 Pair: FIL / USDT
📈 Trade Type: Long
💰 Entry Price: 1.420
🎯 Take-Profit Targets:
TP1 = 1.483
TP2 = 1.547
TP3 = 1.628
🛑 Stop-Loss: 1.387
📊 Timeframe: 1H
⚖️ Risk/Reward Ratio: 6.53
📌 Suggested Leverage: 5x–10x
🔄 After TP1 is reached, move Stop-Loss to Entry to secure profits.
---
🧠 Technical Analysis Explanation:
FIL is showing a strong bullish reversal setup after retesting the 1.38–1.40 demand zone, where previous buying activity pushed the price upward.
The market has printed a higher low structure, confirming renewed bullish control and suggesting the beginning of an upward impulse.
The EMA 50 is acting as dynamic support and is curving upward, while the RSI is recovering above the 50-level — indicating a momentum shift to buyers.
Additionally, volume analysis suggests accumulation in this area, increasing the likelihood of a sustained move toward upper resistance zones.
The entry at 1.420 is positioned at a technical retracement level, providing a low-risk, high-reward opportunity.
Stop-loss at 1.387 is placed below structural support to guard against any short-term shakeouts before continuation.
⚙️ Trade Management Tip:
Wait for bullish confirmation (1H engulfing or hammer pattern) before entering.
Secure profits at TP1, move SL to entry, and trail your remaining position toward TP2 and TP3 for maximum gains.
--

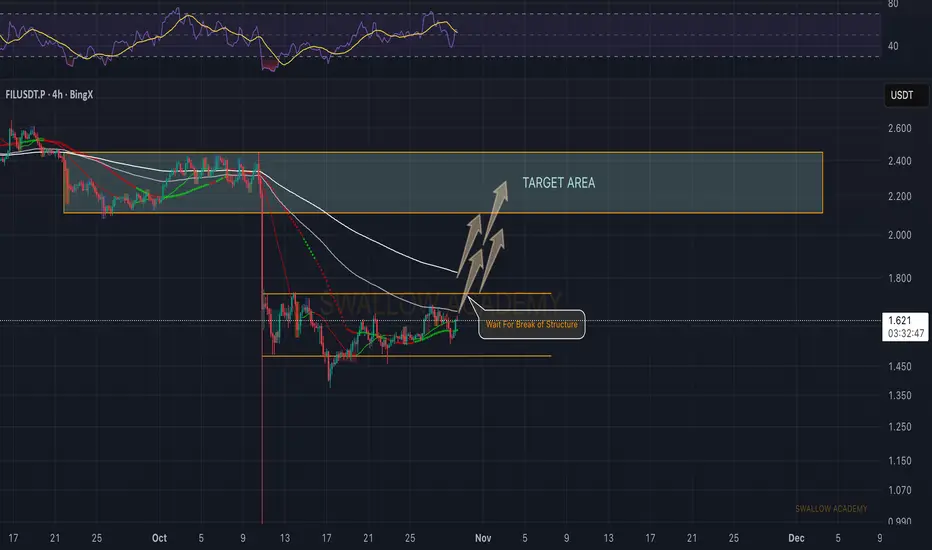
Filecoin (FIL): Expecting Price To Reach $2.2-$2-4FIL is slowly building momentum again. We’re sitting right below a key structure, and what we want to see next is a proper BOS — that’s where the move can really start to develop. Once buyers manage to break above and hold, it opens the door for a clean push toward the upper target area. Good R:R potential here, but patience first — we want that confirmation before anything else.
Swallow Academy
last chance for filLSE:FIL This is the last time that you may see Filecoin at this price, Volume is regaining, bullish absorption, bullish indicator, and a good project in the long run, you can be a millionaire if you are patiently waiting.

FILUSDT 1D#FIL is moving inside a descending channel on the daily timeframe chart and it's time for an upward move. Both the RSI and MACD are showing bullish momentum. The potential targets are:
🎯 $1.974
🎯 $2.286
🎯 $2.537
🎯 $2.789
🎯 $3.148
🎯 $3.605
⚠️ Always remember to use a tight stop-loss and maintain proper risk management.

LongAccording to the analysis of the waves and the help of the Gann method, it can be expected that the price will return to the green zone again.
This is my personal opinion. Please don't use it as your trading criteria. Good luck

FIL/USDT – Bullish Reversal Setup
Price held strong at the key demand zone with a falling wedge breakout.
📍 Entry Zone: ~$1.50–$1.60
🟢 Breakout Signal Confirmed
🔁 Expected Retrace: Back to 0.618–0.5 Fibo before next leg up
🎯 Target Range: Above $2.00+

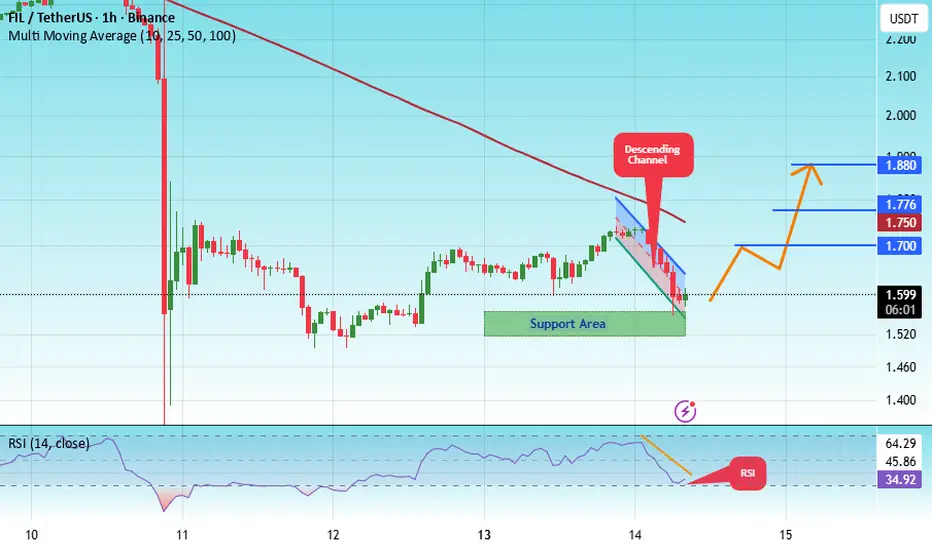
#FIL/USDT Ready for a Breakout? Analysis of a Long Accumulatio#FIL
The price is moving within a descending channel on the 1-hour frame, adhering well to it, and is heading for a strong breakout and retest.
We have a bearish trend on the RSI indicator that is about to be broken and retested, which supports the upward breakout.
There is a major support area in green at 1.54, representing a strong support point.
We are heading for consolidation above the 100 moving average.
Entry price: 1.60
First target: 1.70
Second target: 1.77
Third target: 1.80
Don't forget a simple matter: capital management.
When you reach the first target, save some money and then change your stop-loss order to an entry order.
For inquiries, please leave a comment.
Thank you.
Filecoin: Ready for a Breakout? Analysis of a Long AccumulationFilecoin has been consolidating around its all-time lows for about two years now, marking a very long accumulation period that, in my opinion, will lead to an inevitable upward explosion once the main resistances are broken. At this moment, the first thing the price should do is break the trendline that has been suppressing it since the beginning of the year. Once this is broken and the price consolidates above $3, it should move toward $8, which is the last significant resistance where a reversal occurred. Once that resistance is broken, the bull market for FIL will truly begin. Given the project's fundamentals, I believe it is absolutely the most undervalued coin. Thank you all for your attention.

FIL can touch 1$ in the coming weeksFIL / USDT
The price just brokedown the Huge trading range (2022-2025) on weekly chart and price still find difficulty to restore the broken support
Our view for this coin in mid term is bearish and few weeks we can see FIL hits 1$ 📉
This is my macro view for FILUSD as long as price doesn’t reclaim the support with strong volume
Best of wishes

FILUSDT trading ideaFILUSDT broke down from a bearish formation and has since been trading within a descending channel, carving out what appears to be a 3-wave corrective structure (ABC) to complete wave W of a broader corrective pattern.
Price is now approaching a critical zone where wave X is expected to develop. If price manages to break above the projected sell-off zone, bullish momentum could reclaim control, opening the path toward the next major target at $18.308.
However, a rejection at this key resistance would likely trigger another downward leg, pushing the price back into the immediate demand zone. A failure to hold this support would significantly increase the risk of a deeper breakdown toward the projected wave Y target around $0.995, completing the extensive correction structure.
This is a pivotal moment for FILUSDT, We should closely monitor price action around the sell-off zone for clues on whether bulls can reclaim dominance or if the correction will deepen further.

FIL breakout incomingBuying FIL to FILL my pockets.
LSE:FIL preparing for a breakout, and it will be fast upside move after doing so.
DYOR
NFA

FILmonitoring FIL and looks very very interesting, if you see clearly the chart you will define the target
nfa
dyor

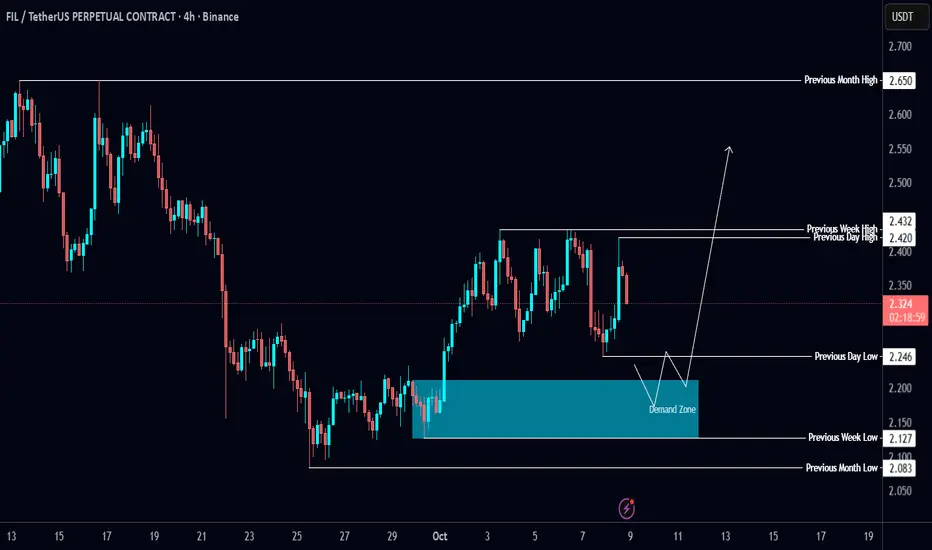
FIL Analysis 🚨 LSE:FIL Analysis 🚨
There’s a clean draw on liquidity sitting above those equal highs (PWH & PDH) 👀
📉 I’d like to see a sweep of the PDL and a tap into the demand zone first — that’s where things get interesting before any run toward those highs.
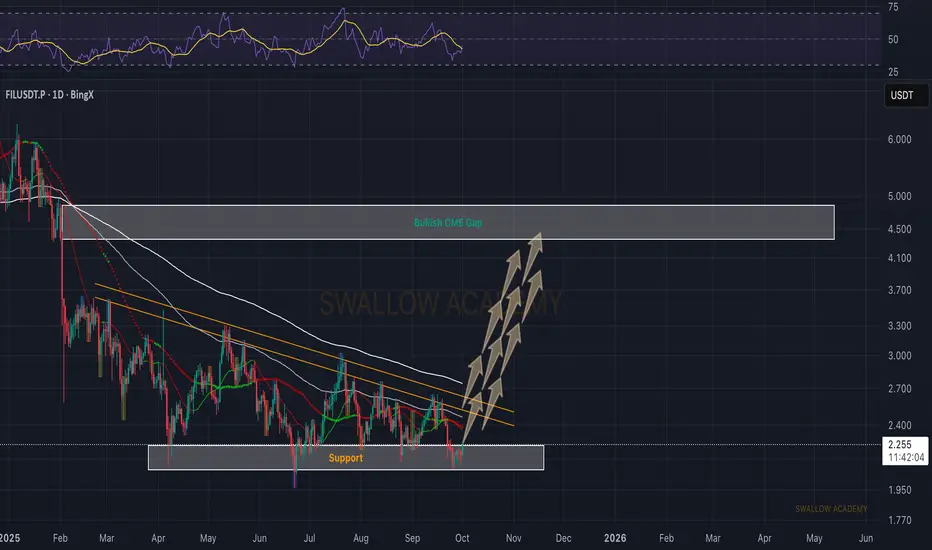
Filecoin (FIL): Expecting Good Bounce From Here | Good R:R TradeFIL is sitting right at the support zone, where buyers continue to defend the level. As long as this zone holds, we are looking at the possibility of a bounce toward higher targets. The key for continuation will be breaking above the trendline resistance and reclaiming the EMAs, which would open the way toward filling the bullish CME gap around $4.5–5.
Swallow Academy
First TP 280%We need to address all the items in the chart. First, the target price is 280%, and after that, it should exceed 800%.
Filecoin (FIL): Easiest Prediction So Far | Risk:Reward 1:7 Our entry got triggered from last time when we were looking for the last liquidity sweep, which indicated that upcoming bullish movement might follow up, and that's exactly what has happened so far.
Buyers are dominating, and we are seeing good chances for our target to be filled; it is just a repeat of history...
Swallow Academy
