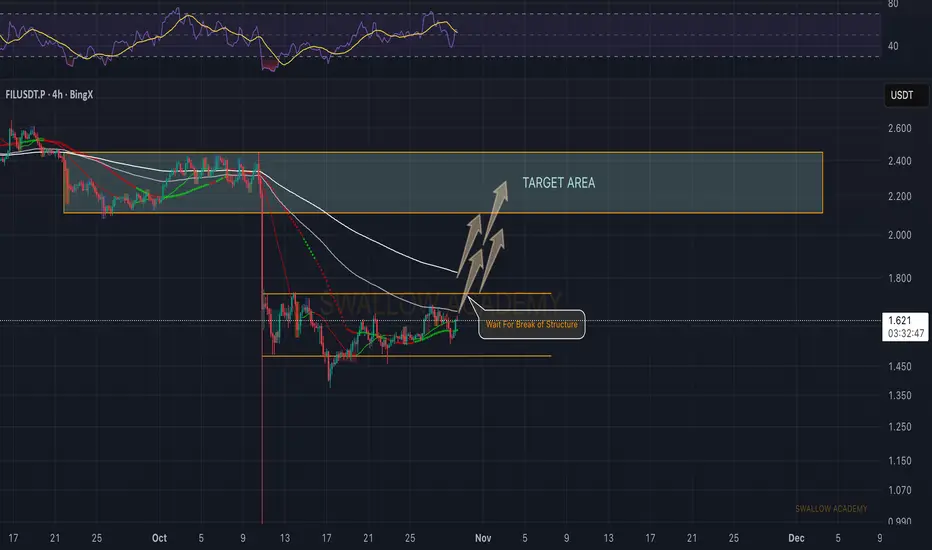
Filecoin (FIL): Expecting Price To Reach $2.2-$2-4FIL is slowly building momentum again. We’re sitting right below a key structure, and what we want to see next is a proper BOS — that’s where the move can really start to develop. Once buyers manage to break above and hold, it opens the door for a clean push toward the upper target area. Good R:R po
last chance for filLSE:FIL This is the last time that you may see Filecoin at this price, Volume is regaining, bullish absorption, bullish indicator, and a good project in the long run, you can be a millionaire if you are patiently waiting.

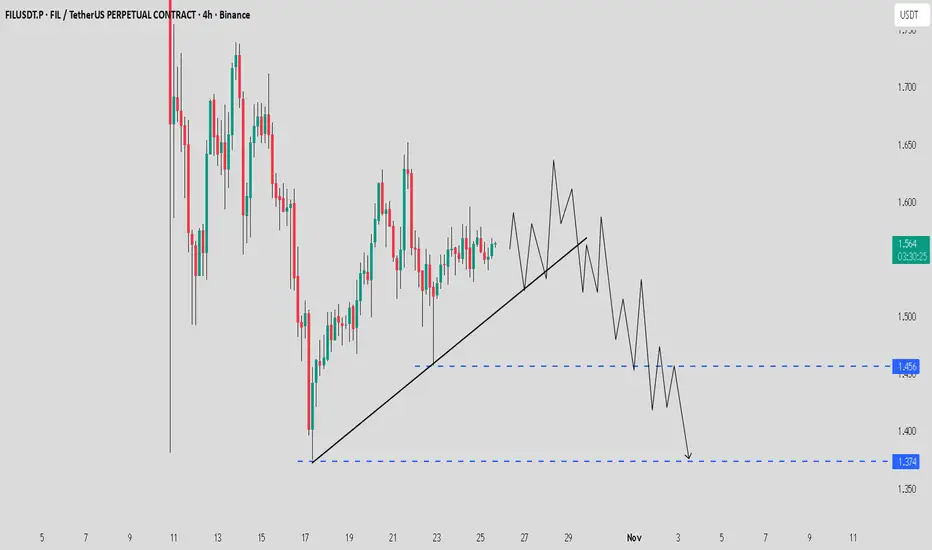
FIL / USDT Eyeing liquidity zone- Possible Reversal setup AheadFIL is showing signs of weakness and appears to be seeking liquidity below the $1.45 – $1.37 zone. If price dips into this area and absorbs liquidity, a potential reversal and trend shift to the upside could follow.
Stay patient, manage risk wisely, and watch how price reacts around the key liquidit
FILUSDT 1D#FIL is moving inside a descending channel on the daily timeframe chart and it's time for an upward move. Both the RSI and MACD are showing bullish momentum. The potential targets are:
🎯 $1.974
🎯 $2.286
🎯 $2.537
🎯 $2.789
🎯 $3.148
🎯 $3.605
⚠️ Always remember to use a tight stop-loss and maintain pr

LongAccording to the analysis of the waves and the help of the Gann method, it can be expected that the price will return to the green zone again.
This is my personal opinion. Please don't use it as your trading criteria. Good luck

FIL/USDT – Bullish Reversal Setup
Price held strong at the key demand zone with a falling wedge breakout.
📍 Entry Zone: ~$1.50–$1.60
🟢 Breakout Signal Confirmed
🔁 Expected Retrace: Back to 0.618–0.5 Fibo before next leg up
🎯 Target Range: Above $2.00+

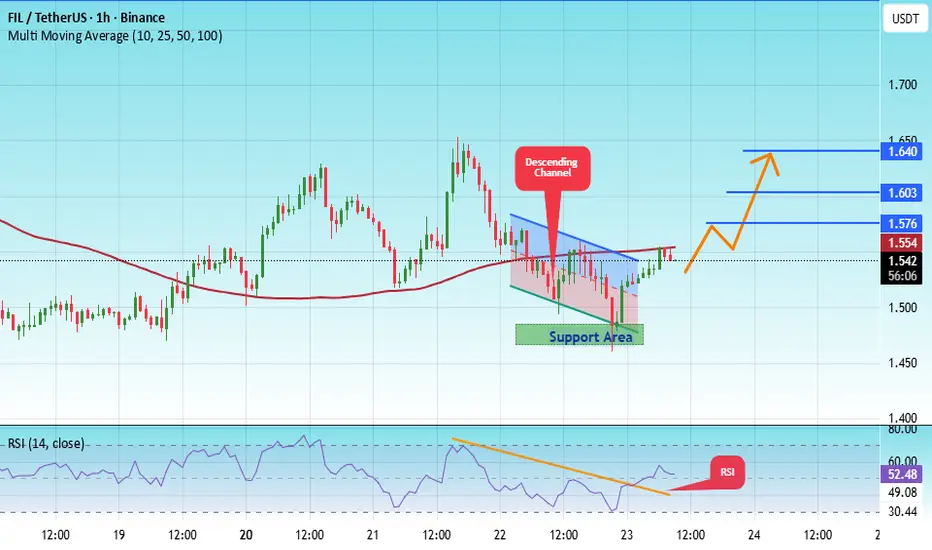
#FIL/USDT Ready for a Breakout? Analysis of a Long Accumulatio#FIL
The price is moving within a descending channel on the 1-hour frame, adhering well to it, and is heading for a strong breakout and retest.
We have a bearish trend on the RSI indicator that is about to be broken and retested, which supports the upward breakout.
There is a major support area i
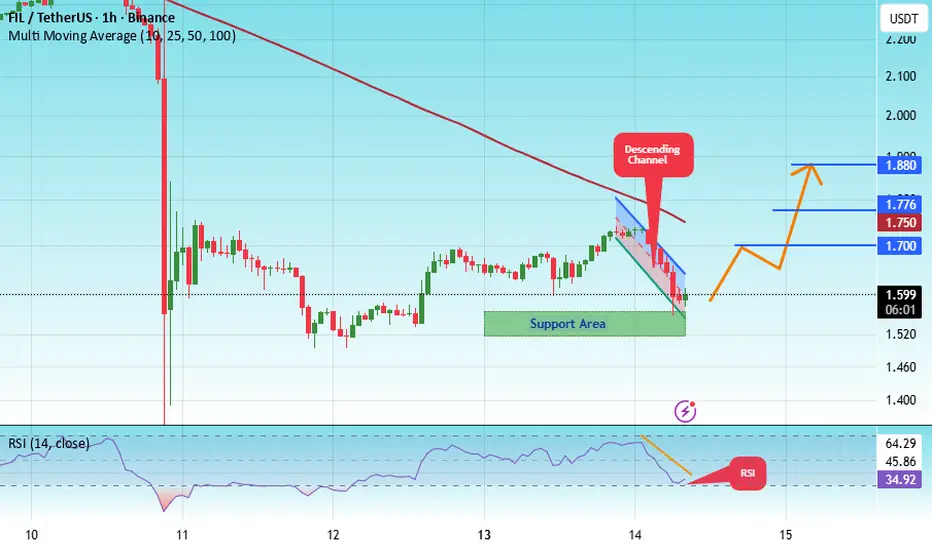
Filecoin: Ready for a Breakout? Analysis of a Long AccumulationFilecoin has been consolidating around its all-time lows for about two years now, marking a very long accumulation period that, in my opinion, will lead to an inevitable upward explosion once the main resistances are broken. At this moment, the first thing the price should do is break the trendline

FIL can touch 1$ in the coming weeksFIL / USDT
The price just brokedown the Huge trading range (2022-2025) on weekly chart and price still find difficulty to restore the broken support
Our view for this coin in mid term is bearish and few weeks we can see FIL hits 1$ 📉
This is my macro view for FILUSD as long as price doesn’t rec

See all ideas
Summarizing what the indicators are suggesting.
Oscillators
Neutral
SellBuy
Strong sellStrong buy
Strong sellSellNeutralBuyStrong buy
Oscillators
Neutral
SellBuy
Strong sellStrong buy
Strong sellSellNeutralBuyStrong buy
Summary
Neutral
SellBuy
Strong sellStrong buy
Strong sellSellNeutralBuyStrong buy
Summary
Neutral
SellBuy
Strong sellStrong buy
Strong sellSellNeutralBuyStrong buy
Summary
Neutral
SellBuy
Strong sellStrong buy
Strong sellSellNeutralBuyStrong buy
Moving Averages
Neutral
SellBuy
Strong sellStrong buy
Strong sellSellNeutralBuyStrong buy
Moving Averages
Neutral
SellBuy
Strong sellStrong buy
Strong sellSellNeutralBuyStrong buy
Displays a symbol's price movements over previous years to identify recurring trends.