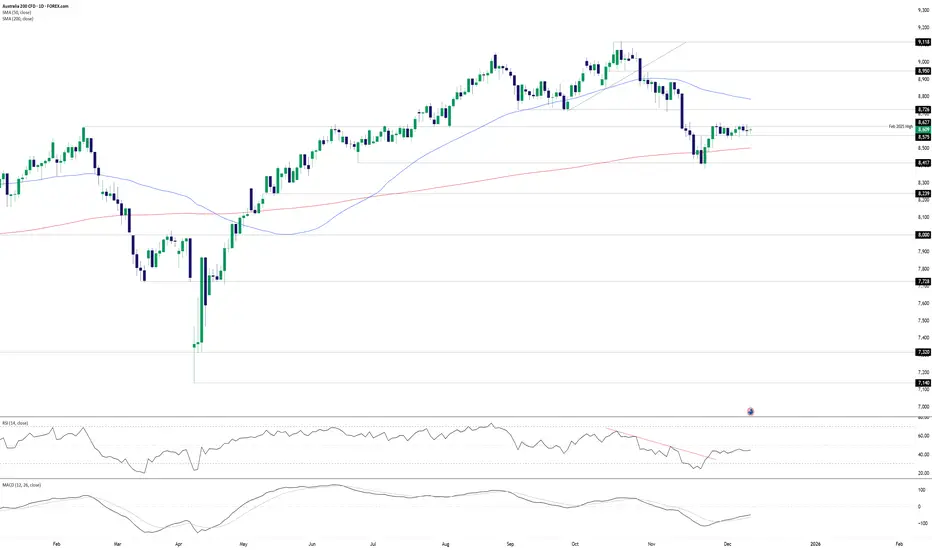
Breakout Risk Builds Before RBAOur ASX 200 contract continues to trade within a narrow range heading into the RBA’s December rate decision, with sellers active above the February high of 8,627 while buyers are lurking on dips below 8,575. Despite multiple probes through both levels over the past fortnight, there has been no close beyond them since 25 November—and that attempt failed.
While there’s no guarantee the RBA decision will deliver a range break, it does present a risk event with the potential to do so. With a well-defined range in play, a sustained breakout in either direction would allow trades to be set targeting a retest of higher or lower levels.
Should the price break and close above 8,627, longs could be established with a stop beneath the level, initially targeting 8,726 given it previously acted as support earlier this year. Conviction in the setup would be bolstered by a close above 8,650.
Conversely, a sustained break beneath 8,575 would flip the setup, with shorts established below the level and a stop above. The 200DMA or 8,417 screen as potential targets. Conviction would grow should the price close beneath the December MTD lows.
Momentum indicators lean marginally bearish on directional bias, though the overall signal is more neutral, placing emphasis on price action. Also note we’re approaching what is traditionally a strong seasonal period for Australian stocks in the second half of December.
Good luck!
DS
Trade ideas
ASX200 to continue in the downward move?AU200AUD - 24h expiry
8649 has been pivotal.
20 1day EMA is at 8657.
Daily signals are bullish.
Our short term bias remains negative.
Price action continued to range between key support & resistance (8560 - 8640) although we expect a break of this range soon.
We look to Sell at 8643 (stop at 8711)
Our profit targets will be 8443 and 8403
Resistance: 8620 / 8649 / 8700
Support: 8556 / 8500 / 8410
Risk Disclaimer
The trade ideas beyond this page are for informational purposes only and do not constitute investment advice or a solicitation to trade. This information is provided by Signal Centre, a third-party unaffiliated with OANDA, and is intended for general circulation only. OANDA does not guarantee the accuracy of this information and assumes no responsibilities for the information provided by the third party. The information does not take into account the specific investment objectives, financial situation, or particular needs of any particular person. You should take into account your specific investment objectives, financial situation, and particular needs before making a commitment to trade, including seeking, under a separate engagement, as you deem fit.
You accept that you assume all risks in independently viewing the contents and selecting a chosen strategy.
Where the research is distributed in Singapore to a person who is not an Accredited Investor, Expert Investor or an Institutional Investor, Oanda Asia Pacific Pte Ltd (“OAP“) accepts legal responsibility for the contents of the report to such persons only to the extent required by law. Singapore customers should contact OAP at 6579 8289 for matters arising from, or in connection with, the information/research distributed.
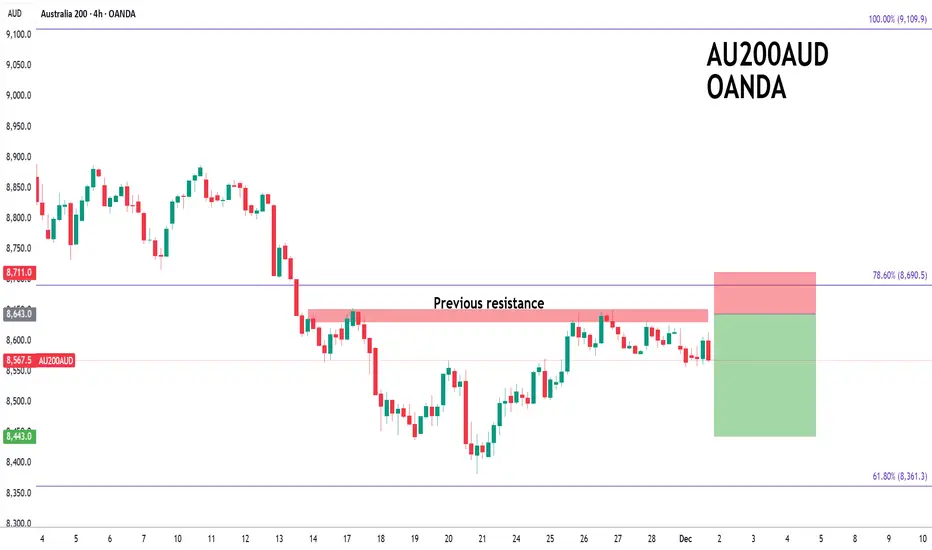
ASX200 to find buyers at previous support?AU200AUD - 24h expiry
Although the bears are in control, the stalling negative momentum indicates a turnaround is possible.
Short term oscillators have turned positive.
Previous support located at 8570.
50 4hour EMA is at 8572.
Dip buying offers good risk/reward.
We look to Buy at 8571 (stop at 8499)
Our profit targets will be 8771 and 8791
Resistance: 8653 / 8700 / 8750
Support: 8574 / 8500 / 8447
Risk Disclaimer
The trade ideas beyond this page are for informational purposes only and do not constitute investment advice or a solicitation to trade. This information is provided by Signal Centre, a third-party unaffiliated with OANDA, and is intended for general circulation only. OANDA does not guarantee the accuracy of this information and assumes no responsibilities for the information provided by the third party. The information does not take into account the specific investment objectives, financial situation, or particular needs of any particular person. You should take into account your specific investment objectives, financial situation, and particular needs before making a commitment to trade, including seeking, under a separate engagement, as you deem fit.
You accept that you assume all risks in independently viewing the contents and selecting a chosen strategy.
Where the research is distributed in Singapore to a person who is not an Accredited Investor, Expert Investor or an Institutional Investor, Oanda Asia Pacific Pte Ltd (“OAP“) accepts legal responsibility for the contents of the report to such persons only to the extent required by law. Singapore customers should contact OAP at 6579 8289 for matters arising from, or in connection with, the information/research distributed.

AUS200 Turning Higher? Key Buy Zones and Profit RoadmapAUS200 (Australia 200) 🚀 BULLISH SWING LAYER Strategy | "The Thief" Entry Method
🥳 Greetings, Traders & "Thief OG's"! 🥳
Get ready for a deep dive into a high-probability BULLISH swing trade setup on the $AUS200. This plan uses a sophisticated entry method to maximize opportunities. Likes & Follows are highly appreciated if you find this valuable! ✅
📈 Trade Thesis & Market Context
The AUS200 is showing strength, and we are anticipating a continued upward move. Our strategy is to enter on any potential pullbacks using a layered approach, ensuring we get a favorable average entry price.
⚔️ Trading Plan: "The Thief" Layered Entries
This strategy uses multiple limit orders to "steal" good prices from the market.
Direction: 🟢 BULLISH (Swing Trade)
Asset: AUS200 (Australia 200 Index)
🎯 Entry Zone (Layered Limit Orders)
We are setting buy limits at key support levels:
▶️ Layer 1: 8480.0
▶️ Layer 2: 8520.0
▶️ Layer 3: 8560.0
▶️ Layer 4: 8600.0
💡 Pro Tip: You can increase or adjust the number of layers and levels based on your own capital and risk appetite. The goal is to build a position at a good average cost.
🛑 Stop Loss (RISK MANAGEMENT)
Initial Hard Stop: 8440.0 (Below the deepest entry layer).
⚠️ IMPORTANT NOTE FOR THIEF OG'S: This is MY strategic stop loss. You MUST adjust your SL based on your personal risk tolerance and account size. Protect your capital at all costs! This is not financial advice.
🎯 Profit Target
Primary Target: 8850.0
This target is based on:
📍 Previous major resistance zones.
📉 Potential for Moving Averages to act as dynamic resistance.
🚨 Overbought conditions that may trap late buyers – we plan to exit before the crowd.
💰 Take Profit Reminder: You are free to take profits earlier! Scale out as price moves in your favor. "Make money, then take money" at your own discretion.
🔍 Related Pairs & Key Correlations (Must Watch!)
Understanding these relationships is crucial for this trade:
OANDA:AUDUSD 📉 (Inverse Correlation): A weaker AUD is often BULLISH for the AUS200, as it benefits the large export companies in the index. Watch for USD strength.
OANDA:XAUUSD (Gold) 📈: Australia is a major gold producer. A strong gold price can boost mining stocks and provide a tailwind for the AUS200.
US30 / SPX500 🇺🇸: Global risk sentiment is often led by US indices. A strong or stable US market generally supports bullish moves in the AUS200.
CN50 🇨🇳 (China A50): China is Australia's largest trading partner. Strength in the Chinese economy and its stock market is a positive signal for the AUS200.
✅ Final Checklist Before Entering:
✅ Confirm overall BULLISH market structure on the 4H/Daily chart.
✅ Check OANDA:AUDUSD for weakness (positive for this trade).
✅ Monitor US indices for positive risk sentiment.
✅ Set your LAYERED LIMIT ORDERS.
✅ Define your PERSONAL Stop Loss and Position Size.
Let's get this bread! 🍞
Like, Follow, and Comment with your thoughts or questions below! Let's build a community of smart traders.
Disclaimer: This is my personal trading idea, not financial advice. Trade at your own risk. You are solely responsible for your trading decisions.
#AUS200 #ASX #TradingView #SwingTrade #Bullish #TradingStrategy #ThiefStrategy #LayerEntry #TechnicalAnalysis #AUD

ASX 200: Momentum shift sparks opportunityA bullish engulfing candle following a failed breakout beneath the 200DMA set the tone for what’s been seen so far this week in our ASX 200 contract, with the price surging higher to trade above the key 8726 level. As shown on the chart, this level acted as support and resistance for long periods earlier this year, making it an ideal reference point for building trades depending on how near-term price action evolves.
If the price holds above the level, longs could be considered with a stop beneath for protection, targeting 8726 initially, with the 50DMA and 8950 as further upside options.
Alternatively, if the breakout fails, the setup could flip, with shorts established beneath 8627 and a stop above for protection. The 8500 zone screens as an initial target, marking an area where the price consolidated heavily over the past fortnight. A push beyond that would bring the 200DMA and 8417 support into play.
Momentum indicators suggest shifting strength, with once-dominant downside pressure now diminishing rapidly. RSI (14) and MACD remain in bearish territory, but trend changes in both hint that a neutral bias may be the best approach for now. That puts more emphasis on price action to guide decision-making—so keep a close eye on 8627!
Good luck!
DS

AU200 to find buyers at 61.8% pullback?AU200AUD - 24h expiry
Early pessimism is likely to lead to losses although extended attempts lower are expected to fail.
Trading volume is increasing.
We look for a temporary move lower.
We have a 61.8% Fibonacci pullback level of 8362 from 7151 to 9110.
Dip buying offers good risk/reward.
We look to Buy at 8365 (stop at 8265)
Our profit targets will be 8665 and 8715
Resistance: 8519 / 8580 / 8653
Support: 8437 / 8400 / 8362
Risk Disclaimer
The trade ideas beyond this page are for informational purposes only and do not constitute investment advice or a solicitation to trade. This information is provided by Signal Centre, a third-party unaffiliated with OANDA, and is intended for general circulation only. OANDA does not guarantee the accuracy of this information and assumes no responsibilities for the information provided by the third party. The information does not take into account the specific investment objectives, financial situation, or particular needs of any particular person. You should take into account your specific investment objectives, financial situation, and particular needs before making a commitment to trade, including seeking, under a separate engagement, as you deem fit.
You accept that you assume all risks in independently viewing the contents and selecting a chosen strategy.
Where the research is distributed in Singapore to a person who is not an Accredited Investor, Expert Investor or an Institutional Investor, Oanda Asia Pacific Pte Ltd (“OAP“) accepts legal responsibility for the contents of the report to such persons only to the extent required by law. Singapore customers should contact OAP at 6579 8289 for matters arising from, or in connection with, the information/research distributed.


Break or Fade? 8627 Is the BattlegroundOur Australia 200 contract is testing a key level on the charts, providing a decent area to build trade setups around.
8627 is the focal point, coinciding with the Valentine’s Day swing high from February this year. Since then, it has acted as resistance and support on multiple occasions, so it’s no surprise the price now finds itself interacting with the level.
Right now, it’s sitting beneath 8627 after failing to sustain a probe above earlier today. That mirrors what we saw late last week, suggesting bears are selling into strength and have the ascendency. RSI (14) and MACD back this up, both sitting in bearish territory and favouring short setups over long.
If the price remains capped beneath 8627, shorts could be set at or below the level with a tight stop above for protection, targeting either 8565, 8500, or the 200DMA depending on desired risk-reward.
Alternatively, if we see a break and close above 8627, the setup could be flipped with longs placed above with a stop below, targeting 8726 initially given it previously acted as support. As mentioned above, given recent price and momentum signals, this setup goes against the prevailing grain, emphasising the need to see any bullish reversal stick before considering long trades.
Good luck!
DS

AUS200 - OPPORTUNITY ARISETeam, earlier today as I mentioned that AUS200 could go down to 8700
current price is 8711 - good for entry ranges
unemployment data is great - from 4.5 down to 4.2
Inflation is 3%
NOT A chance for rate cut this month.
STOP LOSS at 8660
Target 1 at 8730-45 - DO NOT FORGET TO TAKE PARTIAL AND BRING STOP LOSS TO BREAK EVEN
target 2 at 8765-80
lets GO

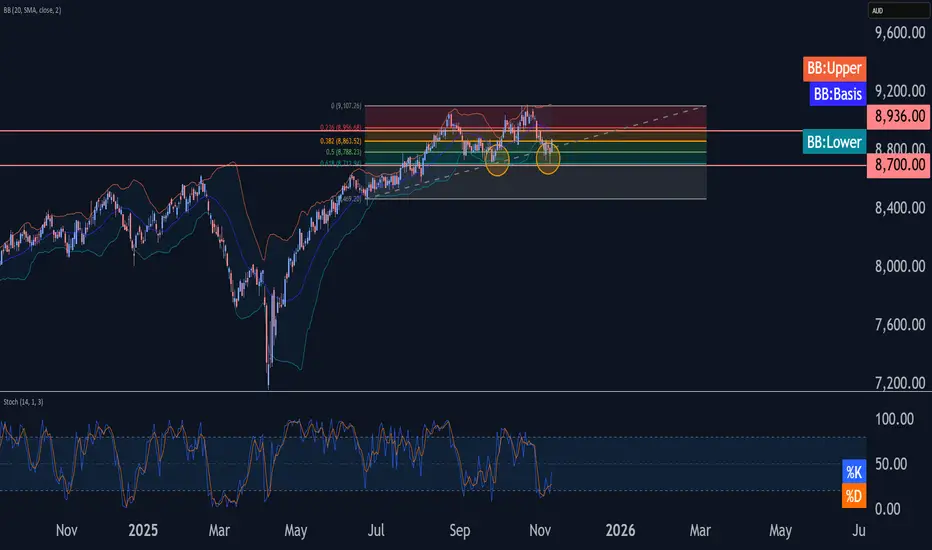
AUS200 Wave Analysis – 10 November 2025
- AUS200 reversed from support level 8700.00
- Likely to rise to resistance level 8936.00
AUS200 index recently reversed up with the daily Hammer candlesticks reversal pattern from the support area between the key support level 8700.00 (which has been reversing the price from September), lower daily Bollinger Band and the 61.8% Fibonacci correction of the sharp upward impulse from June.
The upward reversal from this support zone stopped the previous short-term impulse wave iii of the C-wave from October.
Given the clear daily trend, AUS200 index can be expected to rise to the next resistance level 8936.00 (top of the previous correction ii).
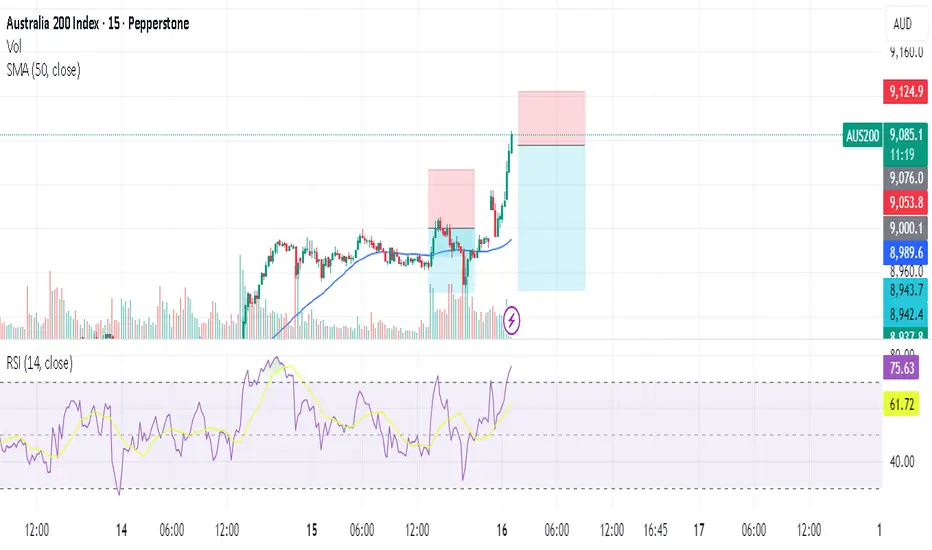
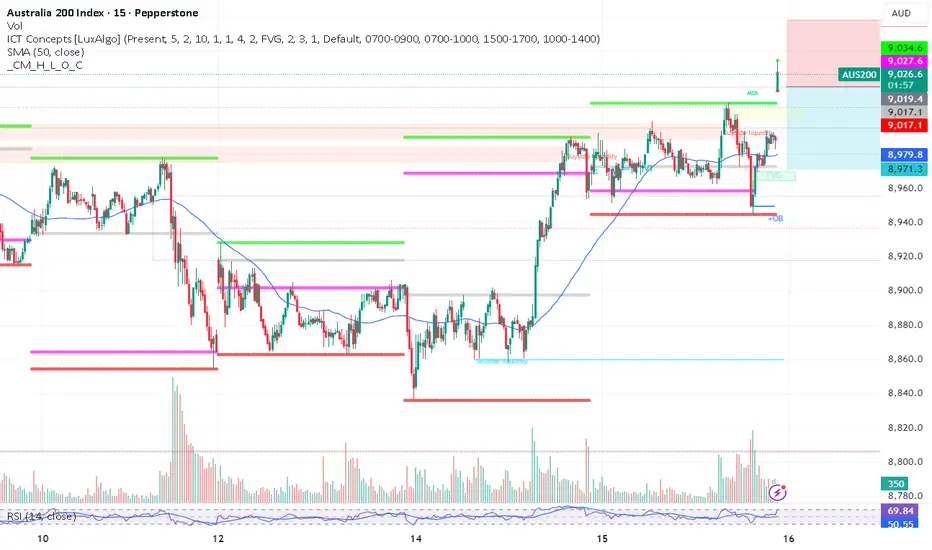
AU200AUD LONGPrice pushed away from value area, we then have had momentum and looking for continuation to go higher, took a risk entry on the 15m candle to play long.

AUSSIE To Go Under? With only 5 trading days left before the monthly close; 7000 will be an important psychological level to watch. A strong break and close below 7000 could potentially trigger shorts and the resumption of the overall down-trend which could see the Aussie sink lower between today`s session into early next week?
Bears Make Money; Bulls Make Money; Pigs Get Slaughtered!

7000 Break or Bounce?In our previous analysis we mentioned how 7000 was an important level in the ASX market and how the breach of the level could trigger a shift in the market sentiment to bearish and signal continuation of the overall downtrend. Round numbers are of significant psychological importance and act as areas of interest attracting a lot of liquidity including stop and limit orders. As price now approaches 7000, the question now becomes, what happens next? As we know, it takes a "large candle to break a large psychological number". Break or Bounce?....
Bears Make Money, Bulls Make Money, Pigs Get Slaughtered!

BREAKOUT CONFIRMEDBreaking Lower. Eyes on 7500 for first target. Break of 7500 could open doors for a lower, weaker AUX over the next few weeks.

ASX200/AUS200 LETS RIDE THE WAVETeam
LONG aus200 at current market 8830, STOP LOSS at 8780,
Target 1 at 8845-65
Target 2 at 8872-86
Once it break above 8845, bring stop loss to BE
LETS GO

ASX200 to find buyers at market price?AU200AUD - 24h expiry
The primary trend remains bullish.
The overnight dip has been bought into and there is scope for further bullish pressure going into this morning.
50 1day EMA is at 8904.
Setbacks should be limited to yesterday's low.
Offers ample risk/reward to buy at the market.
We look to Buy at 8904 (stop at 8849)
Our profit targets will be 9069 and 9099
Resistance: 8931 / 8970 / 9000
Support: 8865 / 8829 / 8800
Risk Disclaimer
The trade ideas beyond this page are for informational purposes only and do not constitute investment advice or a solicitation to trade. This information is provided by Signal Centre, a third-party unaffiliated with OANDA, and is intended for general circulation only. OANDA does not guarantee the accuracy of this information and assumes no responsibilities for the information provided by the third party. The information does not take into account the specific investment objectives, financial situation, or particular needs of any particular person. You should take into account your specific investment objectives, financial situation, and particular needs before making a commitment to trade, including seeking, under a separate engagement, as you deem fit.
You accept that you assume all risks in independently viewing the contents and selecting a chosen strategy.
Where the research is distributed in Singapore to a person who is not an Accredited Investor, Expert Investor or an Institutional Investor, Oanda Asia Pacific Pte Ltd (“OAP“) accepts legal responsibility for the contents of the report to such persons only to the extent required by law. Singapore customers should contact OAP at 6579 8289 for matters arising from, or in connection with, the information/research distributed.

AUS200/ASX200 - RETEST OLD HIGH, TIME FOR A SHORTTeam , last week we short the AUS200 at this level and it drop almost 200 points
But we pocket at 9000 ranges only
Time to reshort at 9110-9120 ranges
STOP LOSS at 9160
Target 1 at 9080-67 - take partial and bring stop loss to BE
Target 2 at 9032-26
NOTE: The DOW rate announce next week, and Chinese tariff apply on 1st of November. Trump is meeting Xi next two weeks at South Korean.. market will likely volatile.
LETS GO - KILL THE BEAST

AUS200 Long Trade PEPPERSTONE:AUS200 Long Trade
Entry: 8816-8858
TP-1: 8900
TP-2: 8967
This is good trade.
Don't overload your risk like Greedy gambler!!!
Be Disciplined Trader, risk what you can afford.
Use proper risk management.
Disclaimer: Trading is risky, only idea, not advice.

AUS200 Long Trade to hit 9100PEPPERSTONE:AUS200 Long Trade
Entry: 8910 - 9000
TP: 9100
This is good trade.
Don't overload your risk like Greedy gambler!!!
Be Disciplined Trader, risk what you can afford.
Use proper risk management.
Disclaimer: Trading is risky, only idea, not advice.

AUS200/ASX200 - NEW ATHTeam
The Australian unemployment rate increased from 4.3 to 4.5 but the market is speculating and pumping
also reach new high
we are shorting at 9075-85 -
for Scalping you can target at 9036-28 - take 70% partial and bring stop loss to BE
SECOND Target at 9015-08
For SWING trade, i suggest you hold until it drop between 120-180 points
LETS GO
AUS200 / ASX200 - ANOTHER OPPORTUNITY TO SHORTTeam, yesterday we short the AUS200 and target hit
today we have much better price at 9026-9035 to short at the current price range
Target at 9002-8996 - take partial and bring stop loss to BE
Target 2 at 8986-8972
LETS go
ASX to continue in the upward move?AU200AUD - 24h expiry
Short term bias has turned positive.
The primary trend remains bullish.
8910 has been pivotal.
20 1day EMA is at 8905.
Dip buying offers good risk/reward.
Risk/Reward would be poor to call a buy from current levels.
We look to Buy at 8913 (stop at 8863)
Our profit targets will be 9063 and 9093
Resistance: 9011 / 9046 / 9075
Support: 9842 / 8910 / 8829
Risk Disclaimer
The trade ideas beyond this page are for informational purposes only and do not constitute investment advice or a solicitation to trade. This information is provided by Signal Centre, a third-party unaffiliated with OANDA, and is intended for general circulation only. OANDA does not guarantee the accuracy of this information and assumes no responsibilities for the information provided by the third party. The information does not take into account the specific investment objectives, financial situation, or particular needs of any particular person. You should take into account your specific investment objectives, financial situation, and particular needs before making a commitment to trade, including seeking, under a separate engagement, as you deem fit.
You accept that you assume all risks in independently viewing the contents and selecting a chosen strategy.
Where the research is distributed in Singapore to a person who is not an Accredited Investor, Expert Investor or an Institutional Investor, Oanda Asia Pacific Pte Ltd (“OAP“) accepts legal responsibility for the contents of the report to such persons only to the extent required by law. Singapore customers should contact OAP at 6579 8289 for matters arising from, or in connection with, the information/research distributed.

SHORT AUS200Entry: 8,872.50 (current price)
Stop Loss (SL): 8,926.59
Take Profit (TP): 8,769.59
Set up: bearish rejection below EMA
