US100 Will target now 25800 Nasdaq is now targeting 25,800, where there are areas of liquidity and also negative order blocks
Trade ideas

NAS100 Berish FlagThere is a double top rejection currently at play on H1 and a bearish flag on M15.
A break out and retest of this flag will provide safer and a higher probability setup.

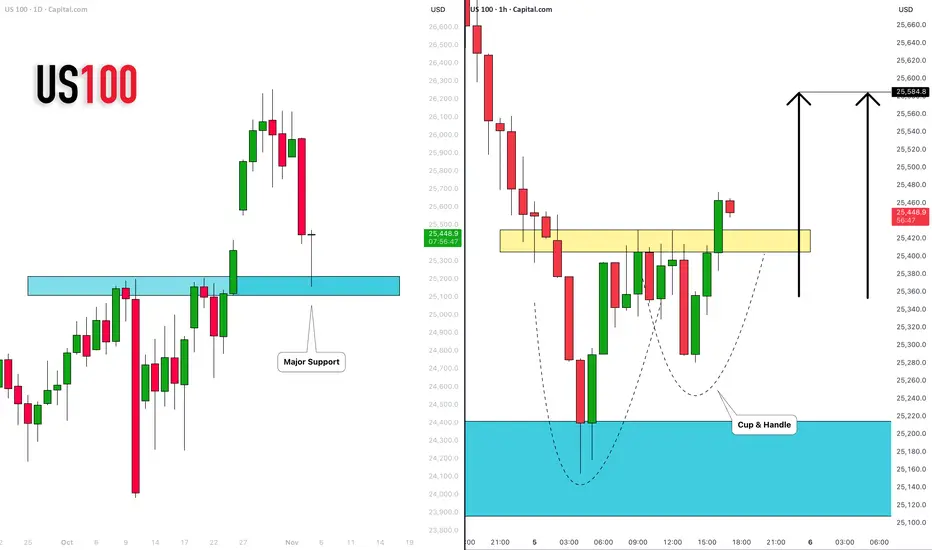
NASDAQ INDEX (US100): Time to Recover
US100 index dropped yesterday, as I predicted.
The market is recovering now, after a test of a major daily support cluster.
A formation of a cup & handle pattern on that and a breakout of its neckline
indicate a strong buying pressure.
With a high probability, the market will rise and reach 25580 level soon.
❤️Please, support my work with like, thank you!❤️
I am part of Trade Nation's Influencer program and receive a monthly fee for using their TradingView charts in my analysis.
NAS100 Trade Set Up Nov 5 2025Price remains under bearish pressure as long as price respects this 4h FVG i will look for internal bearish structure on the 1m-5m to take sells to SSL/Asia lows

NSDQ100 overbought pullback - dip buying opportunity? Equities saw a sharp reversal yesterday, led by weakness in tech and AI-related names. While it was only a single day’s selloff, sentiment has clearly shifted toward caution, with growing talk of a potential equity correction.
Market Dynamics
The Magnificent 7 stocks fell -2.28%, driving the Nasdaq 100 lower as investors reassessed stretched valuations.
Palantir (-7.9%) and Nvidia (-4.0%) were key drags, emblematic of overextended tech momentum — even positive earnings guidance wasn’t enough to support prices.
Broader weakness spread across the market: S&P 500 -1.17% (worst day since Oct 10), equal-weight S&P -0.63%, and Russell 2000 -1.78%.
The S&P ex-Mag-7 was down -0.75%, underscoring the narrowness of recent gains and rising concern over market concentration.
Macro & Other Drivers
The risk-off tone boosted Treasuries: 2yr yield fell to 3.58%, 10yr to 4.09%.
Broader sentiment was pressured by a prolonged U.S. government shutdown (now 36 days, the longest ever) with growing economic cost estimates ($10–30bn/week).
Bitcoin briefly recovered above $100k, but large holders sold ~400,000 coins (~$45bn), adding to the risk-aversion tone.
Political Context
Zohran Mamdani’s election as New York’s first democratic socialist mayor and new housing initiatives grabbed headlines but had limited market impact.
Takeaway for Nasdaq 100
The Nasdaq 100 faces renewed selling pressure as investors rotate out of AI-heavy leaders and take profits after a long rally.
Focus today will be on whether dip-buyers step in or if the correction broadens.
Key near-term catalysts: U.S. ISM Services and ADP employment data, plus earnings from Qualcomm, ARM, and DoorDash later today — all potential volatility triggers for tech sentiment.
This communication is for informational purposes only and should not be viewed as any form of recommendation as to a particular course of action or as investment advice. It is not intended as an offer or solicitation for the purchase or sale of any financial instrument or as an official confirmation of any transaction. Opinions, estimates and assumptions expressed herein are made as of the date of this communication and are subject to change without notice. This communication has been prepared based upon information, including market prices, data and other information, believed to be reliable; however, Trade Nation does not warrant its completeness or accuracy. All market prices and market data contained in or attached to this communication are indicative and subject to change without notice.

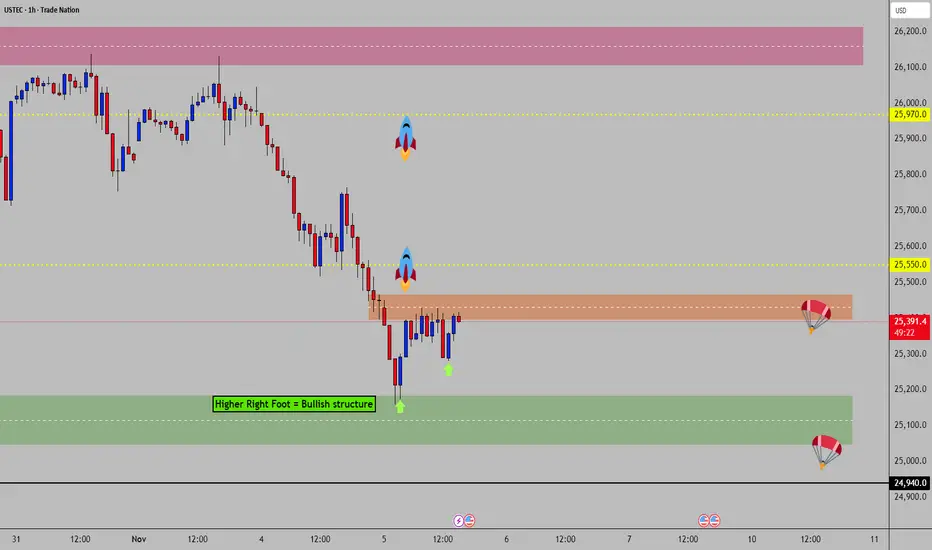
NAS100 - Bullish Structure in Progress @ Demand AreaDear friends in trading,
🎯Bullish structure in progress...
🎯If price breach and hold above 25470 it can potentially launch a rally to 25970.
❌ It can also fail and fall back to demand area - watch 25300 (2HR candle)
🔑Kindly see our profile for your exclusive weekly updates.⚜️⚜️
🙏🏻Thank you in advance for your continued support.
USNAS100 | Bearish Bias Holds Below 26,180 Ahead of Key DataUSNAS100 – MARKET OUTLOOK | Testing Pivot Zone, Awaiting Breakout 🇺🇸
The NASDAQ 100 is testing the pivot zone at 26,095–26,180, with momentum still bearish as long as it trades below this range.
🔽 Below 26,180: Bearish bias toward 25,890 → 25,700 → 25,340.
🔼 Above 26,180: Bullish reversal toward 26,500 → 26,850.
Pivot Zone: 26,095–26,180
Support: 25,890 · 25,700 · 25,350
Resistance: 26,320 · 26,500 · 26,850
USNAS100 remains bearish below 26,180, but a confirmed break above this level could signal the start of a new bullish leg.

NASDAQ BullishThe NASDAQ is currently reacting at a key daily market structure level.
Heading into the New York session, I’m anticipating a potential sweep of sell-side liquidity levels before price shifts upward, possibly targeting new all-time highs
#NASDAQ #US100 #Indices #TechnicalAnalysis #TradingView

NAS100 LongMarket Structure
Clear bearish displacement from the previous highs (~25 850–25 900).
Market made a strong lower low, then broke short-term structure (10 m BOS) to the upside.
That BOS signals a potential short-term reversal or at least a retracement toward a supply zone.
🔹 Key Zones
Demand zone (orange)
Origin of the BOS; clean mitigation of previous imbalance.
This area around 25 330–25 380 is holding as short-term demand.
Supply zone (gray box at top right)
Target zone between 25 550–25 580.
This is the most recent bearish order block before the impulse down, so it’s your liquidity target for longs and potential reversal point for shorts.
Liquidity zones
Equal highs around 25 480 → buy-side liquidity resting above.
Equal lows near 25 340 → sell-side liquidity, which price already swept during the last mitigation.

4 NOV 2025: HTF US100 MARKET RECAPDISCLAIMER:
The owner of this page is an authorised Representative under supervision of TD MARKETS (PTY) LTD, an authorised Financial Services Provider (FSP No. 49128) licensed by the Financial Sector Conduct Authority (FSCA) under the Financial Advisory and Intermediary Services Act (FAIS).
The FSP is licensed to provide advice and intermediary services in respect of Category I financial products, including but not limited to derivative instruments, long-term deposits, and short-term deposits.
All investment ideas are provided in accordance with the scope of the FSP's license and applicable regulatory requirements. Derivative instruments is a leveraged products that carry high risks and could result in losing all of your capital, and past performance is not indicative of future results.
This idea and any attachments are informational/education and does not constitute a recommendation to buy/sell.
No guarantee is made regarding the accuracy or outcome of this trade idea.
If you choose to accept this idea, please do so at your own risk.

Nasdaq: Sharp tech drop sets up critical support testNasdaq slid 2% yesterday in its sharpest tech-led drop since late summer—are we looking at a healthy correction, or could there be a deeper move ahead?
Caution returned to tech stocks as AI valuations and a handful of Big Tech earnings disappointed. The broader market also retreated, with traders watching for the next move from both the Fed and the earnings calendar.
Key drivers:
AI and semiconductor leaders like Nvidia, AMD, and Palantir led the selloff as investors questioned how much further the AI trade can run.
Hawkish remarks from multiple Fed officials raised doubts about any imminent rate cuts, even after the recent 25bp cut, fuelling profit-taking in volatile growth names.
Top Wall Street banks cautioned about stretched valuations, warning a 10–20% correction was possible as positioning remains crowded in mega caps.
Technically, the Nasdaq is pulling back from historic highs, testing median channel support with RSI retreating toward neutral. Key resistances are near 25500 and 25750, with support showing at 25200 and then under 25k.
Stay nimble and respect the potential range between 25450 and 25870 as pivotal for the next Nasdaq swing. Wait for strong resistance confirmation, but don’t ignore bounce risk if earnings and data surprise to the upside.
This content is not directed to residents of the EU or UK. Any opinions, news, research, analyses, prices or other information contained on this website is provided as general market commentary and does not constitute investment advice. ThinkMarkets will not accept liability for any loss or damage including, without limitation, to any loss of profit which may arise directly or indirectly from use of or reliance on such information.

US100 MARKET OUTLOOK!US100 had a sharp drop in price recently from in yesterday’s trading session. From the H4 perspective , we’re beginning to see a bearish momentum kick in. I’m looking forward to seeing more price drops. Therefore, a sell opportunity is envisaged.

NAS BEARISH SETUP Price has broken the ascending channel after rejecting new highs clearly on D1 chart. A fall towards 24.500 is forecast. Early entries a valid now but price might test 25.718 first before it falls

US100 – 1H Demand Zone Bounce | Bullish Reversal SetupTechnical Outlook
Price tapped into a clean 1H demand block.
Early bullish reaction from intraday support.
Potential retracement targets: 25,800 → 26,200
Setup invalid if price closes below 25,270
💰 Trade Plan (Example)
Entry: 25,380–25,400
Stop Loss: Below 25,270
Take Profit: 26,200
🧠 Bias: Bullish (Short-term bounce expected)
🎯 Focus on confirmation candle or structure break above 25,600 for momentum continuation.
#US100 #NASDAQ100 #Indices #TradingView #TechnicalAnalysis #PriceAction #SmartMoneyConcepts #SwingTrade #StockMarket #IndexTrading

Buy Nas 100 to 26000I am buying Nas100. A lot of traders are selling Nas100 to the gap level and the market is aware that sellers intend holding sells towards the Gap at 25400 - hence I am going opposite direction. The market is not stupid.
I am trading 1HR TF in conjunction with US30. US30 is bullish hence I am convinced that the bull run for NAS100 is also starting now.
Good luck.

NAS100 Forecast: A Fresh Bullish Impulse Toward New HighsThe NAS100 index is currently moving within a classic Elliott Wave structure. After completing wave (3), the market entered a correction phase that formed wave (4). This correction appears to have ended in the highlighted support zone, where buyers stepped in strongly. The five-wave pattern before wave (4) confirms a solid bullish trend. Now, the index seems to be preparing for the final upward move wave (5). This wave often represents the last push of a rally before a larger correction starts. As long as the price stays above the recent support near 24,400 , the next targets could be seen around 25,200–25,600 . In simple terms, the market is expected to continue its uptrend after a short pullback, following the typical Elliott Wave sequence of five upward waves and three corrective ones.


NAS100 | Bearish Momentum Extends The Nasdaq 100 fell about 2.1% (~500 points) as projected, maintaining a bearish outlook while technology stocks continued to weigh on market sentiment.
Below 25,700: Bearish continuation towards 25,340 → 25,230 → 25,000.
Above 25,700: Short-term recovery towards 25,820 → 26,170.

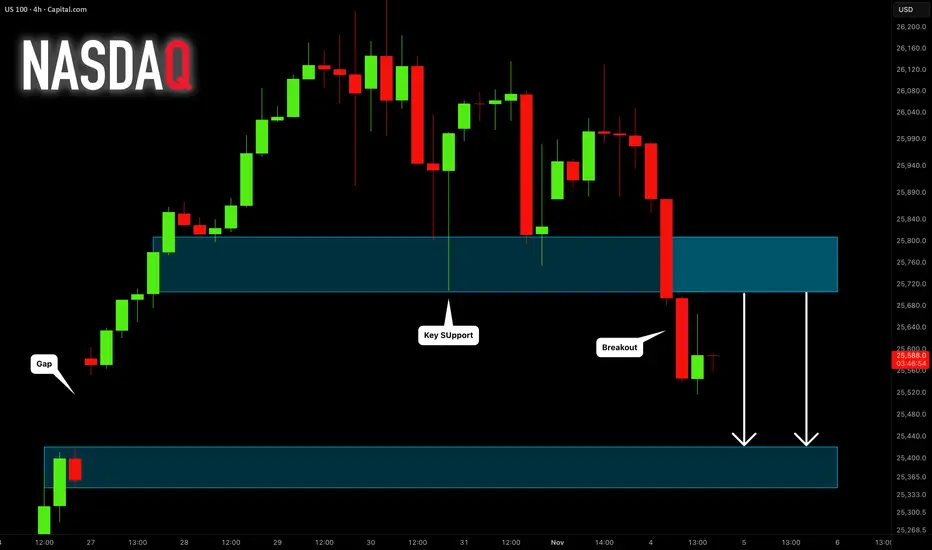
NASDAQ INDEX (US100): Forgotten Gap
A week ago, US100 formed a gap up opening.
It looks like the index is finally ready to fill it.
A breakout of a major horizontal support is a strong bearish signal.
Expect a bearish continuation to 25420.
❤️Please, support my work with like, thank you!❤️
I am part of Trade Nation's Influencer program and receive a monthly fee for using their TradingView charts in my analysis.
NAS100 Trade Set Up Nov 4 2025Price is bearish making LH/LL on the 1h and 15m, has already swept BSL/London highs and inverted 15m FVG so i will be looking for sells down to SSL/London lows


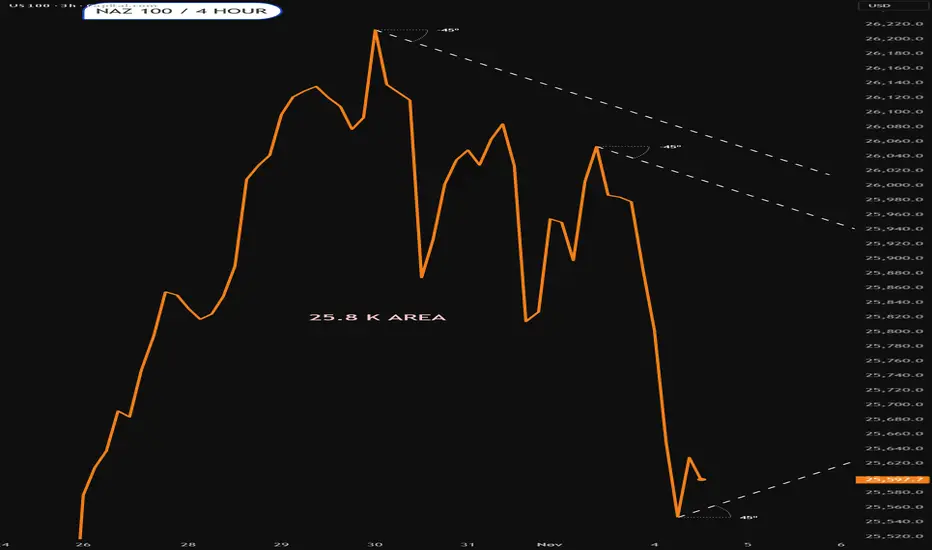
US NAS 100Preferably suitable for scalping and accurate as long as you watch carefully the price action with the drawn areas.
With your likes and comments, you give me enough energy to provide the best analysis on an ongoing basis.
And if you needed any analysis that was not on the page, you can ask me with a comment or a personal message.
Enjoy Trading ;)

Naz 100.Tuesday 4th NovemberSome might say it looks a tad oversold.Deviation from the trendline.trying to bounce now.lets see if it is succesful