Will NAS100 Sustain Its Bullish Momentum After the Pullback?NAS100 🚀 Bullish Swing Setup | SuperTrend Pullback & Layered Entry Strategy
🎯 TRADE IDEA: NAS100 (US100) BULLISH SWING
Capitalize on a structured pullback in the NASDAQ 100! This plan leverages a proven indicator confluence for a high-probability long opportunity.
📊 ANALYSIS & CONFIRMATION:
Trend: Primary Bullish Trend is intact. ✅
Trigger: Price is pulling back into a demand zone, offering a favorable risk-to-reward entry.
Indicator: The SuperTrend ATR Line is acting as dynamic support on the 4H/Daily timeframe. A bounce from this level confirms our bullish bias.
⚡ STRATEGY: "THE THIEF" LAYERED ENTRY
This method uses multiple limit orders to average into a position, perfect for volatile markets like the NASDAQ.
Entry Zone: Look for entries between 25,200 - 25,600
Layer Example:
🟢 Limit Order 1: 25,600
🟢 Limit Order 2: 25,400
🟢 Limit Order 3: 25,200
👉 You can adjust the number of layers and prices based on your capital and risk appetite.
❗ RISK MANAGEMENT:
Stop Loss (SL): A decisive break below 24,800 would invalidate the bullish structure.
⚠️ IMPORTANT NOTE: This is MY protective stop. Dear Thief OG's 👑, you MUST adjust your position size and SL based on your personal risk management strategy. Protect your capital first!
🎯 PROFIT TARGETS:
Primary Target: 25,600 (Initial resistance & profit-taking zone).
Key Reasoning: We anticipate a reaction here due to:
Moving Average resistance.
Potential overbought conditions on lower timeframes.
A "trap" for late buyers.
👉 Smart Move: Consider taking partial profits at 25,600 and trailing your stop for the remainder. Escape the trap with your profits! 💰
⚠️ REMINDER: Dear Thief OG's 👑, your Take Profit (TP) is your own decision. Secure gains based on your trading plan and market behavior.
🔍 RELATED ASSETS & MARKET CORRELATION:
Watching these related instruments can provide confirmation and a broader market view.
TVC:DXY (U.S. Dollar Index): 🟡 NEGATIVE CORRELATION
A weakening Dollar ( TVC:DXY DOWN) is generally bullish for Nasdaq. If the Dollar is falling, it adds confidence to this long thesis.
USTECH (CFD on Nasdaq 100): 🟢 DIRECT CORRELATION
Moves in sync with NAS100. Perfect for cross-verifying price action and volume.
NASDAQ:AAPL , NASDAQ:MSFT , NASDAQ:TSLA (Mega-Caps): 🟢 HIGH IMPACT
These heavily weighted Nasdaq components drive the index. Bullish momentum in these stocks supports a rising NAS100.
FOREXCOM:SPX500 (S&P 500): 🟢 POSITIVE CORRELATION
A strong S&P 500 often lifts the Nasdaq. Monitor for overall U.S. market strength.
💬 Let me know your thoughts in the comments!
What's your entry strategy for the NAS100 this week?
#NAS100 #US100 #TradingView #SwingTrading #Bullish #SuperTrend #TradingStrategy #IndexTrading #LayeredEntry #ThiefStrategy
Trade ideas

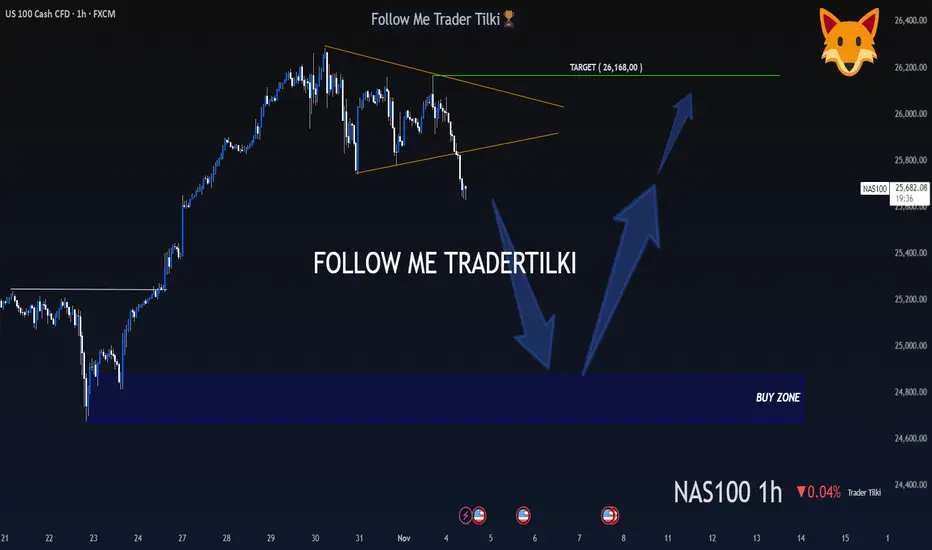
A Hunter Waits Patiently, Then Strikes Like a Lion - US100 - 1HMy dear friends, greetings,
My friends, I have set the buy levels for US100 at 24,872 and 24,677.
I will never enter a trade or put myself at unnecessary risk before these levels are reached.
My friends, in order to consistently win in this market and to become a successful trader, patience is essential.
If you act with patience and strategy, you will always be a winning trader, just like me.
I would also like you to know that my target is set at the 26,168 level.
My friends, every single like from you is my greatest motivation to share these analyses.
I sincerely thank everyone who supports me with their appreciation.
With my respect and love.
US NAS 100Preferably suitable for scalping and accurate as long as you watch carefully the price action with the drawn areas.
With your likes and comments, you give me enough energy to provide the best analysis on an ongoing basis.
And if you needed any analysis that was not on the page, you can ask me with a comment or a personal message.
Enjoy Trading ;)

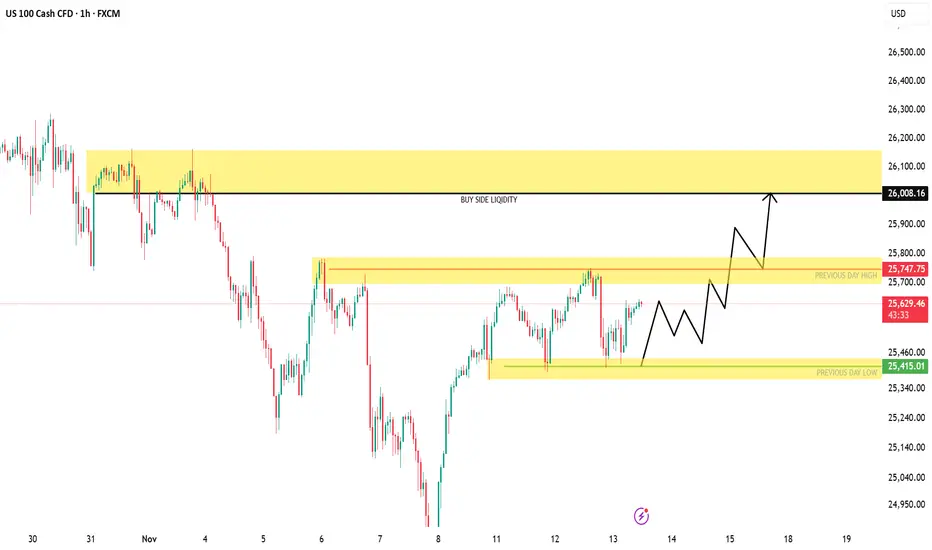
US100 | Building Liquidity for a Potential Push Toward 26,000NASDAQ (US100) is consolidating between 25,400–25,750, forming a potential accumulation zone below short-term liquidity. A clean break and retest above 25,750 could trigger a bullish expansion toward the 26,000–26,200 range, where major buy-side liquidity sits.
Market Structure:
Bias: Bullish (HTF structure shifting higher)
Key Demand Zone: 25,400 – 25,450
Breakout Zone: 25,750
Target Zone: 26,000 – 26,200
Invalidation: Below 25,400
Concepts: Liquidity Grab | Market Structure Shift | Demand Zone | Breaker Block | Smart Money Flow
NASDAQ is Nearing an Important Resistance Line.Hey traders, in tomorrow's trading session we are monitoring NAS100 for a selling opportunity around 25,500 zone, NASDAQ is trading in a downtrend and currently is in a correction phase in which it is approaching the trend at 25,500 support and resistance area.
Trade safe, Joe.

US100 Reversal Map – Hull MA + Heikin Ashi Confirmation🧠 US100 / NASDAQ100 Profit Pathway Setup — The Thief’s Bullish Escape Plan! 💰🚀
📊 Market Bias: Bullish (Day Trade Setup)
The Thief Trader has spotted a golden pathway in the NASDAQ100 (US100)!
Here’s the breakdown of the plan — straight from the thief’s vault 🕵️♂️📈
🎯 Plan Overview
Bias: Bullish continuation confirmed
Technical Confirmation:
✅ Double Pullback on Hull Moving Average
✅ Retest Zone successfully defended
✅ Heikin Ashi Bullish Doji signaled a trend reversal confirmation
💡 Momentum is shifting upward — the trend has officially changed!
💎 Entry Strategy (Layered Thief Style)
The Thief Strategy applies a layered entry method — multiple buy limits to average into strength.
📥 Buy Limit Layers:
25,300
25,400
25,500
25,600
(Traders can adjust or add more layers based on risk appetite and confirmation zones.)
🛡️ Stop-Loss Setup
This is the Thief SL @ 25,100
⚠️ Note to Thief OG’s:
I’m not recommending my SL as your SL — always customize risk and secure your own bag. Manage your position with discipline and independence! 💼
🎯 Take-Profit Zone
Target: 26,200
🚨 The Police Barricade Zone acts as a strong resistance — overbought levels spotted and potential bull trap alert!
Kindly exit with profit before the officers arrive. 😎
⚠️ Note: Profit-taking is at your discretion. Book and Run!
📈 Related Pairs to Watch (Correlation Insight)
NASDAQ:NDX / CAPITALCOM:US100 / NASDAQ:QQQ : All mirror NASDAQ movement.
SP:SPX / AMEX:SPY : Often correlate with NASDAQ’s momentum (watch divergence for clues).
TVC:VIX : If volatility spikes, expect pullbacks on tech-heavy indices.
TVC:DXY : A weak dollar often fuels US100 bullish legs — keep an eye on it.
NASDAQ:AAPL / NASDAQ:MSFT / NASDAQ:NVDA : Leading drivers of NASDAQ — if they pump, the index follows. 💪
🧩 Key Insights
Hull MA alignment confirms momentum shift.
Retest + bullish Heikin Ashi Doji = market reversal confirmation.
Layered entries give flexibility in volatile intraday conditions.
Dynamic risk management is key — never marry a position.
✨ “If you find value in my analysis, a 👍 and 🚀 boost is much appreciated — it helps me share more setups with the community!”
#US100 #NASDAQ100 #ThiefTrader #DayTrading #IndexTrading #HullMA #HeikinAshi #LayeredEntries #TechnicalAnalysis #TradingSetup #PriceAction #MarketReversal #TradingCommunity #BullishPlan #SmartMoneyFlow #TradeIdeas #ThiefStrategy

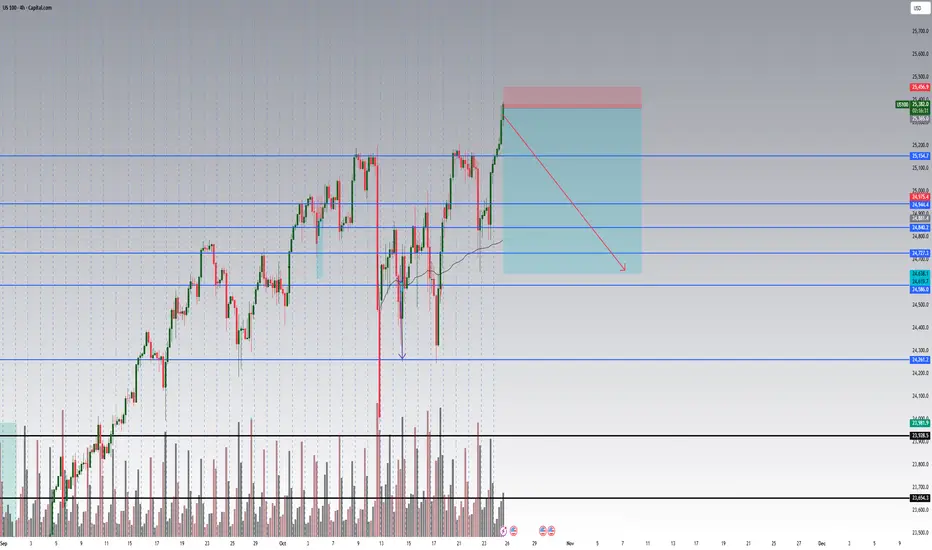
US100 (NASDAQ 100) – Short TradeSetup Type: Short Position
Entry: Around 25,650 (Resistance zone)
Stop Loss: 25,787
Target: 24,850
Analysis:
Price is retesting a key resistance zone after a strong impulsive move upward. A rejection from this level could indicate the start of a short-term correction. If bearish confirmation appears (e.g., lower high formation or bearish engulfing candle), short positions could be valid toward 24,850 support.
Bias: Bearish below 25,787
Invalidation: Break and close above 25,787
Hashtags:
#US100 #NASDAQ100 #PriceAction #TradingSetup #BearishSetup #TechnicalAnalysis #TradingView #SmartMoney #ShortTrade #Indices

US100 PRICE MAY DECLINE!The H4 chart shows there could be a good probability for a sell as price just reacted off 25,705 a sell opportunity is envisaged. I anticipate price to decline. I’m selling short US100

NAS100 Trade Set Up Nov 12 2025Price trading above PDH and has a daily gab above to fill but first i would want to see a sweep of London lows/SSL before looking for 1m-5m IFVG/CISD to continue higher to sweep BSL and fill the daily imbalance

US100 – Bullish Reversal Setup-H4: Turning bullish with a new high at 25,667.
Pullback: Formed a lower high, now H1 shifting bullish again.
Plan: Looking for buys above 25,542, SL below last H1 LH.
Adjustment: If another H1 LH forms and breaks upward, trail SL for tighter risk.
-Fundamental: Shutdown-end hopes , supporting the bullish scenario.

NQ1 high probable shortsNas should be on a correction today for the H1 and H4 sells. I anticipate nas either breaking its bullish level where sellers sit in the next 2-3 days or continuing down for the next week or two.

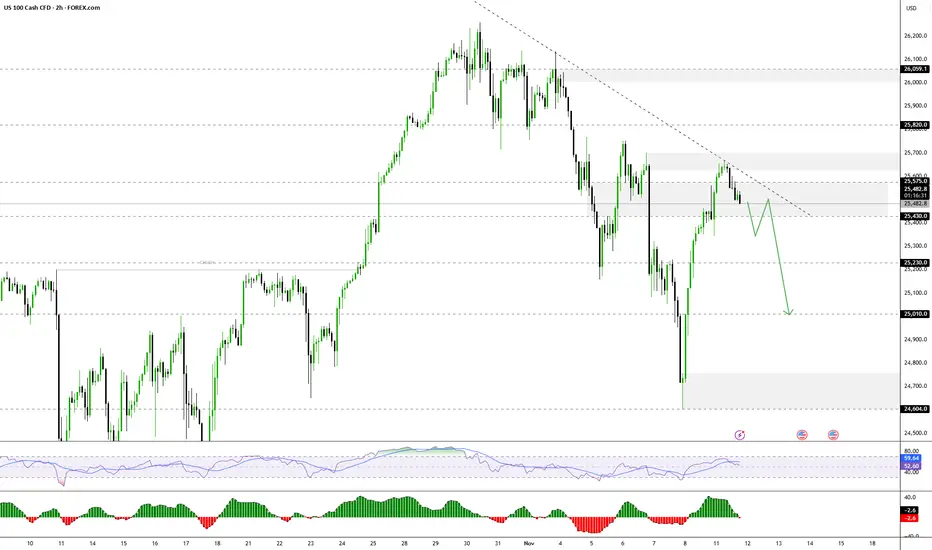
Nasdaq Potential for Further CorrectionThe NASDAQ index currently appears to be in a short-term correction, with the price likely to retest 25430 from 25570 before further movement.
- Above 25430–25575: Bullish continuation towards 25700 → 25820 → 25960.
- Below 25430: Bearish momentum is likely towards 25230 → 25010.
Wall Street Tech Rally Resumes | USNAS100 Holds Firm Above 25440USNAS100 – MARKET OUTLOOK | Bullish Bias Above 25440
The Nasdaq continues to trade with bullish momentum after stabilizing above 25440, supported by strength in tech stocks and improving market sentiment.
Above 25440: Bullish continuation toward 25700 → 25820 → 26170 (ATH).
Below 25430: Bearish correction possible toward 25230 → 25000 → 24760.
Pivot: 25440
Support: 25230 · 25000 · 24760
Resistance: 25570 · 25700 · 25820
USNAS100 remains bullish while above 25440, but a confirmed 1H close below 25430 could trigger a short-term bearish correction toward 25230–25000.

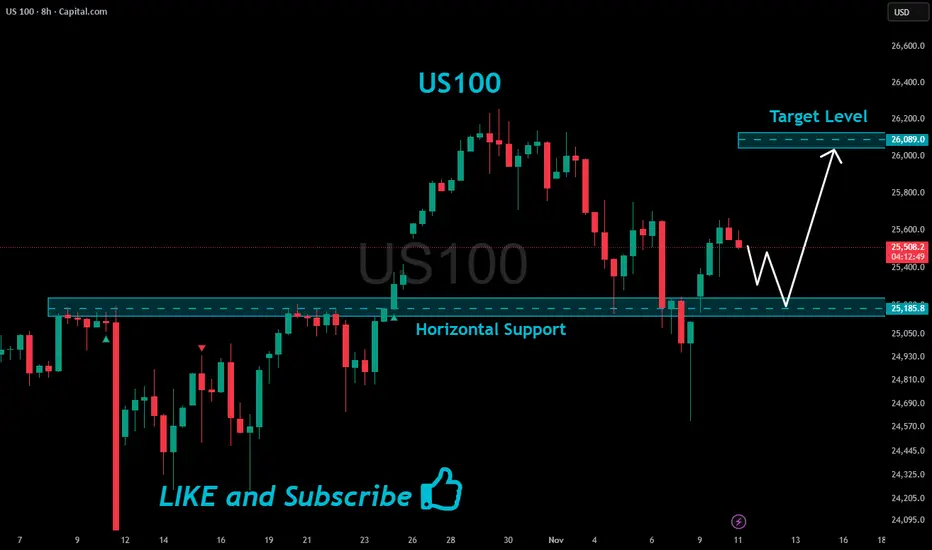
US100 Support Ahead!
HI,Traders !
#US100 is making a local
Bearish correction but
We are bullish biased mid-term
So after the pair hits the horizontal
Support of 25185.8 we will be
Expecting a local bullish rebound !
Comment and subscribe to help us grow !
Sellin Zone Nas1001. Daily is bearish
2. 4HR is bearish
3. 2HR is bearish
4. 1HR is bearish
Therefore, we looking for sells. I will enter a sell in the internal supply zone.

Lower CPI Data – But Don’t Be Fooled by “Good” Inflation Numbers
Summary:
Markets cheered on lower CPI data, but the optimism might be misplaced. A softer inflation print gives the FED more flexibility, yet it also reduces the urgency for two rate cuts this year — something traders had already priced in.
Logic:
CPI came in weaker → short-term bullish sentiment.
But the real driver of rates is not CPI alone — it’s the balance between inflation and growth.
With inflation easing and economic activity still stable, the FED doesn’t need to cut twice in 2025.
Futures market (CME FedWatch) was pricing two cuts, which means that optimism is already priced into NASDAQ valuations.
Scenario Outlook:
If CPI remains stable and growth holds → only one cut or delay, not two.
That means tech valuations might need to reprice lower, especially high beta names.
NASDAQ could revisit support around 17,000–17,200 before finding balance again.
Trading View:
Watch for rejection near 18,000–18,200 (overextension after CPI rally).
Short-term bias: bearish / correction mode.
Long-term bias: still bullish, but needs valuation reset.
NASDAQ Double Top Rejection Still At PlayI do not believe the bears are quite done yet in this market. What I am seeing currently is a bullish correction or retest of this double top rejection.
Momentum to the downside will resume soon enough. For now however, enjoy the ride to the upside - cautiously.
This is a buy to sell setup. My overall bias is bearish.

NasdaqBullish nasdaq as price went to restest the strong demand zone ans respected the price zone. Now more bullish momentum expected till our initial resistance.

Nasdaq Battle between correction & innovationNASDAQ 100 (NDX)
Nasdaq 100 Index (NDX) currently sits at a crucial inflection point, defined by the overwhelming dominance of the technology sector's structural growth against a backdrop of increasing macroeconomic and technical vulnerability. After a historic rally driven by Artificial Intelligence (AI) euphoria, the market is undergoing a necessary and sharp correction, testing key support levels established during the latest bullish surge.
The Durable Foundation: AI, Earnings, and Profitability
The core bullish case for the NDX remains robust, fundamentally driven by the "Magnificent Seven" and the pervasive, non-negotiable surge in AI infrastructure spending. Unlike the speculative rallies of previous cycles, today's leaders are characterized by deep profitability, substantial cash flow, and diverse revenue streams.
Recent corporate earnings reaffirm this strength, with the technology sector posting strong double digit growth. This profitability suggests that investment in AI is being funded through internal cash flow, making the rally more sustainable than the debt fuelled expansion seen two decades ago. The long term trajectory is further supported by an accommodative Federal Reserve pivot, which is now in rate cutting mode a supportive contrast to the tightening cycle that ended the 2000 rally. The secular trend of technological innovation is accelerating, transforming AI from a growth narrative into an essential business imperative.
Macroeconomic and Sentiment Headwinds
Despite underlying corporate strength, recent market action signals a decisive sentiment shift rooted in macro uncertainty and high valuations. The index has experienced its steepest weekly decline since March, indicating heavy profit taking and a collective "reality check" among traders.
Several factors are contributing to this sentiment reversal:
1. Concentration Risk: The sheer weight of the largest components now represents an extraordinary percentage of the overall market capitalization, making the NDX acutely sensitive to volatility in just a few key names.
2. Labor Market Cooling: Data showing a significant spike in job cuts (particularly in the tech and warehousing sectors) has unsettled investors, suggesting that economic cooling is accelerating faster than anticipated.
3. Consumer Confidence: A sharp drop in consumer sentiment reflects heightened anxiety related to economic uncertainty and political instability, which historically dampens forward looking market optimism.
4. Valuation Concerns: While not at 2000 extremes, valuations remain elevated, shifting the market’s focus entirely from multiple expansion to demanding flawless execution and continuous earnings growth.
Technical Outlook: The Critical 25,000 Support Test
From a technical perspective, the NDX has been in a clear, rising trend channel over the medium to long term, confirming a persistent buy the dip mentality. However, the recent sell off has introduced significant short term caution.
The index is currently testing a non negotiable support zone around 25,000. This level is psychologically important and corresponds to a previous major breakout point. A decisive breakdown below this support could trigger a cascading sell off as automated stop loss orders are activated, potentially paving the way toward the next major supports at 24,500 and, more critically, 23,980.
Key Technical Levels:
• Immediate Support: 25,000
• Secondary Supports: 24,500, then 23,980
• Immediate Resistance: 25,200, followed by 25,500 and 25,700
Conclusion: Navigating the Volatility
Nasdaq 100 remains an index of unparalleled innovation and long term potential, yet its short term path is fraught with risk. The outlook hinges on the NDX's ability to hold the critical 25,000 support level. A bounce from this zone would confirm the resilience of the dip buyers and maintain the medium term bullish structure. Failure to hold this level, however, would signal a deeper technical correction is underway, shifting the focus to the lower support zones as the market cleanses its excessive exuberance. Traders should remain nimble, respecting the clear shift in short term momentum while maintaining conviction in the long term, secular growth of the technology giants.

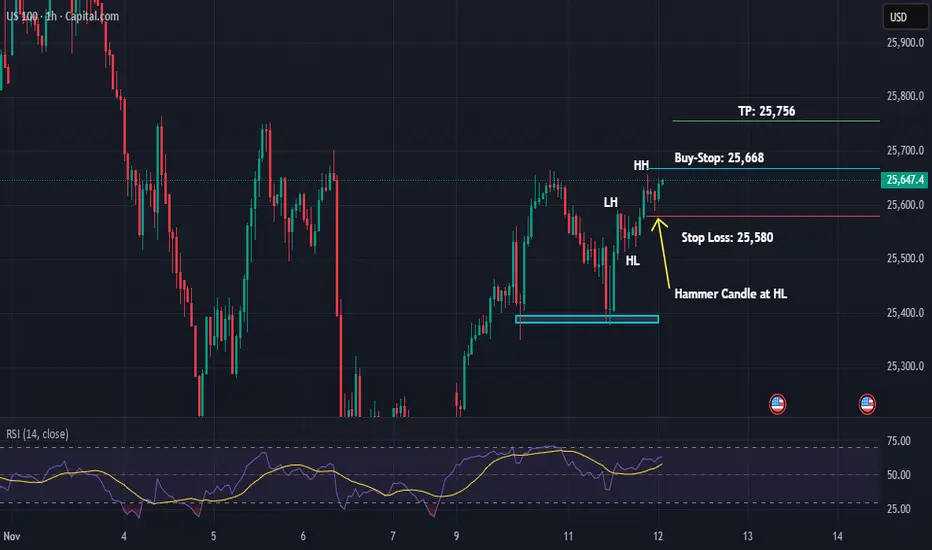
US100 Buy-Stop Setup on 1HNasdaq is in a Bullish Trend on 1H timeframe... It looks like it can go further up.
Let's take a 1:1 Long Trade here.
US NAS 100With your likes and comments, you give me enough energy to provide the best analysis on an ongoing basis.
And if you needed any analysis that was not on the page, you can ask me with a comment or a personal message.
Enjoy Trading ;)

US NAS 100Preferably suitable for scalping and accurate as long as you watch carefully the price action with the drawn areas.
With your likes and comments, you give me enough energy to provide the best analysis on an ongoing basis.
And if you needed any analysis that was not on the page, you can ask me with a comment or a personal message.
Enjoy Trading ;)

buy to sellLooking to buy from demand zone → targeting imbalance fill at 25,900.
Will look for short opportunities once price reaches IMB/supply zone.
