Nasdaq - The most important structure!💰Nasdaq ( TVC:NDQ ) perfectly respects structure:
🔎Analysis summary:
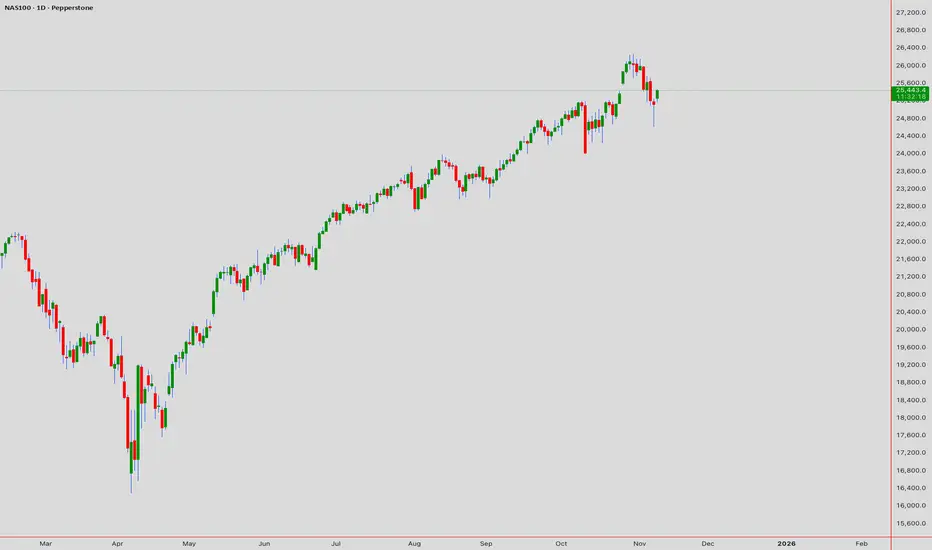
Over the course of the past couple of months, the Nasdaq has been rallying an expected +50%. Still, until the Nasdaq will retest the upper channel resistance trendline, this rally won't be over. Therefore, we can still see a rally of another +10% in the very near future.
📝Levels to watch:
$25,000 and $30,000
SwingTraderPhil
SwingTrading.Simplified. | Investing.Simplified. | #LONGTERMVISION
Trade ideas

NAS100 CONTINUE TO BULLISH RALLYTechnically:
1) Trendline broke and then retest
2) Support becane resistance
3) no bearish divergence

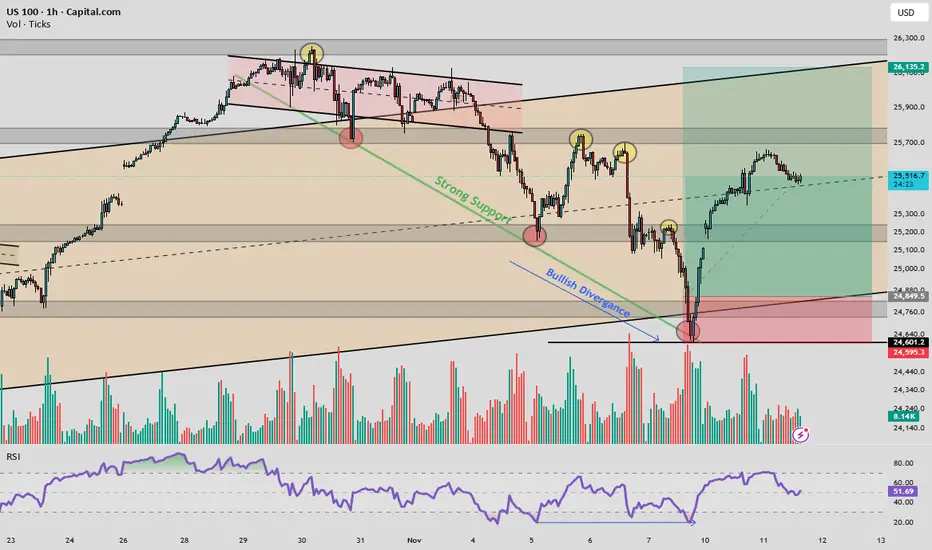
US100: Bullish Divergence Meets Institutional SupportUS100 1H Analysis – Bullish Divergence at Strong Support
Price is compressing within a descending channel, currently testing a multi-touch support zone around 24,730–24,490. Volume shows signs of accumulation, and RSI reveals bullish divergence, hinting at potential reversal. If support holds, a bounce toward 25,900–26,250 is likely. Breakdown below 24,490 invalidates the setup.
Follow @GoldenZoneFX for more content and valuable insights.
US NAS 100Preferably suitable for scalping and accurate as long as you watch carefully the price action with the drawn areas.
With your likes and comments, you give me enough energy to provide the best analysis on an ongoing basis.
And if you needed any analysis that was not on the page, you can ask me with a comment or a personal message.
Enjoy Trading ;)

NAS100 Trade Set Up Nov 11 2025Price swept PDH and inverted a 4h FVG plus broke structure to the downside on the 1h so i will want to see a internal BSL sweep to then see a continuation lower to SSL and possibly 1h FVG

NASDAQ 100 — Key Intraday Reaction Zone (11 Nov)NASDAQ 100 (NDX) is currently trading inside a crucial intraday reaction zone around 25,550–25,650.
This area marks the intersection of previous structural resistance and short-term order flow buildup.
A clear break above this zone could signal continuation of bullish momentum, while failure to sustain may invite a short-term pullback.
Keeping an eye on how price behaves here during the U.S. session — this zone is likely to define the next directional move.
#NDX #NASDAQ100 #USMarket #PriceAction #TradingView #MarketAnalysis

US100 Resistance Ahead!
HI,Traders !
US100 is making a
Nice bullish correction
After a sharp local flash-crash
But a local horizontal resistance
Level is ahead at 25185.8
So after the retest we will
Be expecting a local
Bearish correction !
Comment and subscribe to help us grow !

NAS100 Trade Set Up 1500 pips secured!Price manipulated first above London highs to then come down and sweep SSL/London lows then CISD on the 15m with a retest to buy up to full tp5 1500 pips

Nasdaq-100 Wave Analysis – 10 November 2025- Nasdaq-100 reversed from support level 25000.00
- Likely to rise to resistance level 26250.00
Nasdaq-100 index recently reversed up with the daily Hammer from the support zone between the round support level 25000.00 and the support trendline of the daily up channel from May.
This support zone was strengthened by the 61.8% Fibonacci correction of the sharp upward impulse from October.
Given the clear daily trend, Nasdaq-100 index can be expected to rise to the next resistance level 26250.00 (top of the previous impulse wave i).

NAS100 SELL SIGNALWait for price to reach AOI & wait for rejection. Go on lower timeframes to confirm CHOCH. Wait for a signal of sellers coming in (bearish engulfing - maybe) then enter SELLS.

NAS100 Trade Set Up Nov 10 2025Price has shifted to bullish structure on the 1h so i will wait for price to sweep SSL or tap into bullish 1h FVG before looking for buys to target higher BSL

NAS100 Intraday Technical AnalysisNAS100 Intraday Technical Analysis - 10 Nov 2025
Nasdaq 100 at 25,454 (2:05 PM UTC+4) — multi-chart confluences signal breakout setup.
📌 Market Context: Wyckoff Phase D re-accumulation; Dow Theory primary uptrend intact; Gann Square-of-9 vibration levels 25,520/25,320.
🗺️ Multi-Timeframe Breakdown:
1D: Broadening wedge; RSI 63 (mild bearish divergence); Ichimoku cloud support 25,180; bullish engulfing pattern intact.
4H: Rising wedge 25,280-25,520; Elliott Wave (3) mid-extension; anchored VWAP from Oct 29 = 25,180 (buy anchor).
1H: Cup-and-handle breakout base at 25,360; BB expanding; VWAP reclaimed post-morning dip.
30M: Symmetrical triangle; hidden bull divergence (RSI higher lows); volume contracting pre-breakout.
15M: Bull flag over 25,340; Tenkan>Kijun bullish; stochastic RSI reset—ready for push.
5M: Falling wedge retest 25,420; hammer candlestick confirms demand; watch bull trap on volume weakness.
🎯 PRIMARY LONG SETUP
Entry: 25,360-25,390 (VWAP + flag support) — wait for bullish 15M close above 25,380.
Stop Loss: 25,300 (below symmetrical triangle base).
Target 1: 25,480 (+26 pips).
Target 2: 25,540 (+86 pips).
Target 3: 25,620 (+166 pips — harmonic alt bat PRZ).
Confirmation: RSI >55, volume >20% of 20-day avg, VWAP slope upward.
⚡ MOMENTUM ADD-ON: Scale above 25,520 ONLY if RSI>65 & volume surge confirmed; trail stop to 25,460 once first target prints.
🔻 REVERSAL SHORT SETUP
Entry: 25,600-25,640 (supply zone) — trigger on bearish engulfing + RSI divergence.
Stop Loss: 25,700 (above rising wedge).
Targets: 25,500 → 25,420 → 25,320 (Gann support).
Confirmation: 5M/15M RSI bearish divergence; BB upper band rejection.
🚨 BREAKOUT & BREAKDOWN ALERTS:
BULL: 1H close >25,540 confirms Wave (3) extension; target 25,720; move stop to BE+20.
BEAR: 1H close <25,300 with volume expansion opens 25,180 cloud base test; watch VWAP support.
📊 INDICATOR SNAPSHOT: BB squeeze (30M) expanding; MACD histogram positive; VWAP slope UP; EMA21>EMA50>EMA200 (bullish stack).
⚠️ PATTERN ALERTS: Harmonic bat completes 25,620; rising wedge failure <25,320 = Wyckoff UTAD signal; H&S only valid if neckline 25,260 breaks.
📈 TIMING & RISK: Gann 90° window 15:30 UTC; ATR(14)=90 pts; CPI whispers & Fed speakers elevate volatility. Risk ≤1% per setup; lock partials; avoid sub-average volume chases.
Educational purposes only. Align with your plan, manage risk, adapt to real-time action.
NAS100 – Bullish Setup Alert (Inverse Head & Shoulders on 30min)#NAS100 has been moving sideways on the higher time frames, showing consolidation after recent volatility. However, on the 30-minute chart, it’s now forming a clean Inverse Head & Shoulders pattern, which is a classic bullish reversal signal.
Key Levels to Watch:
Neckline Breakout Zone: Watch for a breakout above the neckline for confirmation of bullish momentum.
Entry Plan: Wait for a break and retest of the neckline before entering a long position.
Targets: Short-term resistance zones and Fibonacci extensions can be used for profit booking.
Risk Management: Always use a tight stop-loss below the right shoulder to protect capital.
Technical Outlook:
Once the neckline is broken with volume confirmation, it may trigger a strong bullish continuation move — aligning with broader market momentum.
What’s your view on this setup?
Do you see a breakout coming soon, or another fakeout before the move? Share your thoughts below
#NAS100 #Trading #PriceAction #ChartAnalysis #TechnicalAnalysis #HeadAndShoulders #Forex #Indices #DayTrading

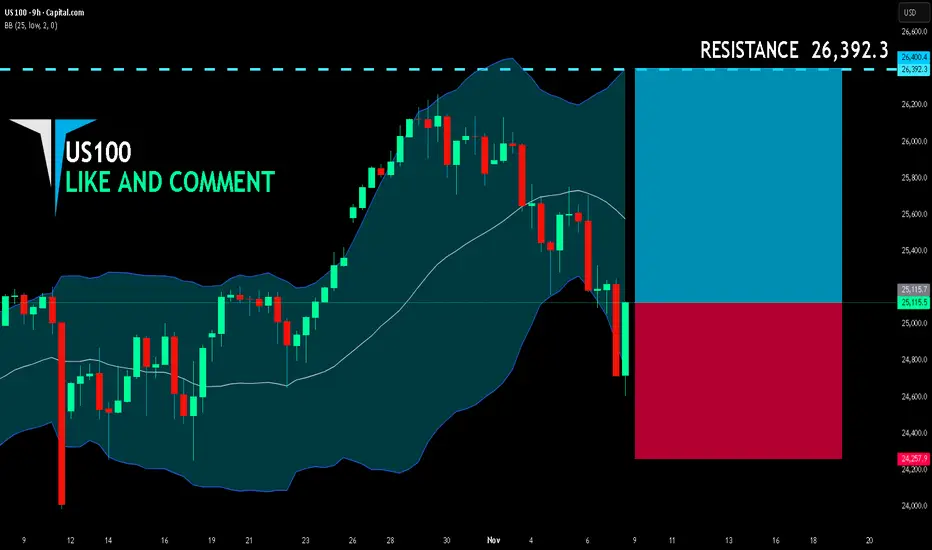
US100 LONG FROM SUPPORT
US100 SIGNAL
Trade Direction: long
Entry Level: 25,115.7
Target Level: 26,392.3
Stop Loss: 24,257.9
RISK PROFILE
Risk level: medium
Suggested risk: 1%
Timeframe: 9h
Disclosure: I am part of Trade Nation's Influencer program and receive a monthly fee for using their TradingView charts in my analysis.
✅LIKE AND COMMENT MY IDEAS✅
US NAS 100 BIG FALLPreferably suitable for scalping and accurate as long as you watch carefully the price action with the drawn areas.
With your likes and comments, you give me enough energy to provide the best analysis on an ongoing basis.
And if you needed any analysis that was not on the page, you can ask me with a comment or a personal message.
Enjoy Trading ;)

Nasdaq slides as volatility growsNasdaq was pushed down to the local support area, as the sentiment for the stock market has worsened due to a certain degree of deleveraging for stocks and investors moving to safety.
VIX (S&P 500 volatility index) has climbed above 20, which pushes the market’s volatility expectations higher and may trigger nervous reactions for tech stocks. The longest duration of downswings for Nasdaq is about 15-17 days, which allows us to project the downward move to a longer time period, with a further development of the bullish pullback, as shown at the chart.
Don't forget - this is just the idea, always do your own research and never forget to manage your risk!

NAS100 Bullish divergence on 1HNAS100 is showing a Bullish divergence in RSI in a 1H chart. This can be confirmed if the neckline breaks the LH at around 25270 points.

Is this OTE or the beginning of a bear market?Is this OTE or the beginning of a bear market?
ICT OTE Theory defines the .62 retracement of a given range as the Optimum entry for the continuation of the bullish trend. Seeking Liquidity above the previous high.
We can compare this to the supply and demand theory using SMA 10 20 50. The moving averages indicate. Price currently sits below the value area between the 10 and 20 and has reacted off the 50.
Which put us in No mans land.
the 10 & 20 being above the 50 indicate the a bullish Bias.
If we are going bearish then we want to see the 10 & 20 below or crossing the 50 and price below the 50. This would be a strong setup and signal to go short. with price targets of 24224 & 22683.
HTF analysis : The M,W,D charts are still extremely bullish.
Current Sentiment: You tube videos and News reports are warning of a reversal and/or short term bearish move lower.
My Conclusion: WE are Bullish until proven differently. Next week will either support my conclusion or prove otherwise. So Stay flat and/or hedge your current positions to protect yourself the market response.

USNAS100 – Bearish Bias Below 25230 | Targeting 24850–24350USNAS100 | Overview
Wall Street futures struggled for traction at the end of a wobbly week, as optimism around artificial intelligence—which helped drive markets to all-time highs earlier this year—has been tempered by growing concerns over monetization challenges and circular spending within the tech sector.
Technically:
The index maintains a bearish momentum while trading below the pivot line at 25230.
Currently, price action suggests a possible break below 25010, which would confirm a continuation toward 24850, with an extended downside target near 24350.
However, a 1H close above 25230 would indicate renewed bullish momentum, signaling a potential recovery toward 25430 and 25700.
Pivot Line: 25180
Resistance: 25430 · 25700
Support: 24860 · 24760 · 24350
Outlook:
USNAS100 remains bearish while below 25230, targeting 24850–24350 in the short term.
A confirmed 1H close above 25230 would shift bias to bullish continuation, eyeing 25430–25700.

NAS100 1500 pips secured!Set up played out perfectly, breaking structure to during London session, sweep BSL, followed by internal IFVG to target 1500 pips

NAS100 Trade Set Up Nov 7 2025Price remains bearish so i will only looking for sells either after price sweeps internal BSL or London highs BSL before looking for 1m-5m IFVG/CISD to take sells to lower SSL levels

Nasdaq’s Battle at the Golden Support!On the NASDAQ 100 (NDX) chart, the index has pulled back after a strong rally to around 26,000, now testing a critical support zone near 25,000–25,200. This area is technically significant because it aligns with three key factors:
1. The main ascending trendline (blue line)
2. The 50-day moving average
3. A previous horizontal support level
In the short term, if the index holds above 25,000 and forms a bullish reversal candle, it could rebound toward the next resistance around 26,200–26,500. The stop loss for this bullish scenario would be a confirmed breakdown below 24,800.
However, if the price drops below 24,800 and stays there, a deeper correction toward 23,800–24,000 becomes likely — which aligns with the lower boundary of the medium-term channel.
From a long-term perspective, as long as the index trades above its 50-day moving average (currently around 20,300), the primary trend remains bullish, with potential upside targets between 27,000 and 28,000.
In short, this current zone represents the dividing line between trend continuation and a medium-term correction for the Nasdaq 100.

Nasdaq Towards New All Time High, Buy-Stop TradeNasdaq bounced back upward after testing its support. Now going up, likely to make a new ATH.
We can take a 1:1 Buy trade here.
