nas100🔹 Overall Outlook and Potential Price Movements
In the charts above, we have outlined the overall outlook and possible price movement paths.
As shown, each analysis highlights a key support or resistance zone near the current market price. The market’s reaction to these zones — whether a breakout or rejection — will likely determine the next direction of the price toward the specified levels.
⚠️ Important Note:
The purpose of these trading perspectives is to identify key upcoming price levels and assess potential market reactions. The provided analyses are not trading signals in any way.
✅ Recommendation for Use:
To make effective use of these analyses, it is advised to manually draw the marked zones on your chart. Then, on the 15-minute time frame, monitor the candlestick behavior and look for valid entry triggers before making any trading decisions.
Trade ideas

NAS100 Rejection last 4H candle# 📊 NAS100 (SPOT NASDAQ100) Rejection TECHNICAL ANALYSIS 🎯
## Week of November 10-14, 2025 | Intraday & Swing Trade Setup
Close Price: 25,121 | Entry Point: November 8, 2025, 12:54 AM UTC+4 💹
---
## 🔍 EXECUTIVE SUMMARY - MULTI-TIMEFRAME PERSPECTIVE
The Nasdaq-100 index exhibits a compelling convergence of technical signals across all analyzed timeframes. Elliott Wave structure suggests we're navigating wave cycles with potential breakout scenarios emerging through harmonic pattern confirmations. Bollinger Bands are contracting, indicating volatility consolidation before directional expansion. RSI readings across 5M-1H timeframes show overbought extremes transitioning to neutral zones, creating premium entry opportunities for disciplined traders. Volume analysis reveals institutional interest patterns correlating with Ichimoku Cloud positioning.
---
## 📈 TIMEFRAME-BY-TIMEFRAME ANALYSIS
### 5-MINUTE (Intraday Scalping) ⚡
Candle Pattern: Japanese candlesticks reveal micro-trend reversals with consecutive hammer formations suggesting buyer rejection zones. Evening Star patterns detected at resistance levels.
Elliott Wave: Sub-wave completion suggests wave 4 consolidation before wave 5 impulse move. Wave structure favors breakout traders targeting 25,280-25,420 resistance confluence.
Bollinger Bands: Middle band acts as dynamic support; lower band rejection patterns create high-probability short setups. Band squeeze indicating imminent volatility breakout.
RSI (14): Oscillating between 35-65 range—avoiding extremes. Divergences between price highs and RSI highs signal potential reversals at 25,180 and 25,240 levels.
Support & Resistance: Micro S/R zones at 25,095 | 25,140 | 25,180 | 25,220 | 25,280. Volume nodes clustered around 25,150.
VWAP: Price oscillating around session VWAP—each touch generates scalp opportunity. Aggressive traders fade upper band extremes.
### 15-MINUTE (Quick Swing) 🎢
Candlestick Analysis: Three-candle patterns emerging—flag continuation structures with potential for 60-80 pip breakouts. Engulfing bars confirming directional bias shifts.
Harmonic Patterns: Gartley Pattern formation detected—potential reversal zone (PRZ) at 25,165-25,195. Risk-reward ratio favorable at 1:2.5 for harmonic traders.
Wyckoff Theory: Accumulation phase evident with volume concentration and price consolidation. Distribution signs emerging—caution at resistance clusters.
Bollinger Bands: Band squeeze tightening—historical data shows 40-120 pip moves follow. Upper band resistance at 25,285; lower band support at 25,085.
Volume Analysis: Volume profile reveals point of control (POC) at 25,140—high-probability rejection zone. Volume surge required for breakout confirmation above 25,250.
Ichimoku Cloud: Price above cloud (bullish). Tenkan-sen at 25,205 acts as dynamic support. Kijun-sen (25,160) provides secondary support for pullback traders.
### 30-MINUTE (Intraday Swing) 🔄
Pattern Formation: Symmetrical Triangle formation with apex target at 25,290. Ascending triangle variant shows bullish bias—breakout above 25,270 targets 25,380-25,420 extension.
Dow Theory: Confirming higher highs & higher lows structure. Secondary trend remains bullish; pullbacks to moving average (EMA 20) present optimal entry zones.
RSI Divergence: Positive RSI divergence confirmed—price making lower lows while RSI forms higher lows at 42 level. Classic reversal setup targeting 25,260 minimum.
Exponential Moving Average: EMA 9 above EMA 21—bullish alignment. Price hugging EMA 9 (25,125) indicates strong intraday uptrend. EMA 50 (25,080) provides stop-loss anchor.
Support Zones: 25,080 (EMA 50) | 25,120 (EMA 9) | 25,160 (Kijun-sen) | 25,200 (Demand Zone)
Resistance Zones: 25,250 (Breakout trigger) | 25,290 (Triangle apex) | 25,350 (Weekly resistance)
### 1-HOUR (Core Swing Trade) 🎯
Elliott Wave Complete Picture: Primary trend shows potential Wave 3 completion near 25,350. Wave 4 correction (current consolidation) targeting 25,140-25,180 support zone. Wave 5 breakout anticipated—target: 25,450-25,520.
Pennant Pattern: Bullish Pennant formation within consolidation—breakout confirmation above 25,280 validates pattern. Minimum target: 25,450 (measured move from pole).
Bollinger Bands (1H): Upper band at 25,380 represents squeeze breakout target. Middle band (25,200) = bullish support. Lower band rejection creates risk-reward optimization point.
VWAP Daily: Price trading above VWAP—bullish gradient confirmed. Each hourly candle close above VWAP strengthens trend continuation probability. Rejection below VWAP = caution signal.
Volume Profile: Heavily traded at 25,150-25,180 (support) and 25,240-25,280 (resistance). Imbalances favor upside—low volume zone above 25,300 suggesting vacuum to fill.
Ichimoku Alignment: Price above Senkou Span A & B—cloud thickness indicates strong support. Chikou Span lag above candles = bullish confirmation. Cloud color shift (bullish green) reinforces uptrend.
Gann Theory: 45-degree angle trendline from swing low confirms rally angle. Resistance at 38.2% Fibonacci extension (25,280) precedes aggressive breakout phase.
### 4-HOUR (Swing Trade Foundation) 💼
Daily Chart Alignment: 4H timeframe shows potential Inverse Head & Shoulders pattern—right shoulder completing (current zone: 25,120-25,180). Breakout above 25,280 neckline targets 25,450-25,520 extension.
Wyckoff Accumulation: Institutional buying evident—small barometer move (SBM) triggers accumulation phase. Spring tests below support anticipated 25,080-25,100 zone.
RSI 4H: RSI at 54-60 range—neutral bullish. Still room for upside extension without extreme overbought. RSI above 70 targets 25,350+. Below 30 requires defensive posturing.
Cup & Handle Pattern: Potential bullish Cup formation completing—handle stabilization near 25,150-25,200. Breakout above handle (25,280) targets cup depth extension = 25,420.
EMA Ribbon: EMA 8, 13, 21, 50, 200 = bullish alignment. Compression and expansion cycles indicate momentum phases. Ribbon support at 25,120 = critical hold level.
Support Tiers 4H: 25,050 (structural) | 25,120 (EMA 8) | 25,160 (EMA 21) | 25,200 (demand cluster)
Resistance Tiers 4H: 25,280 (key breakout) | 25,350 (extension) | 25,420 (major target) | 25,500 (weekly projection)
### DAILY CHART (Swing Trade Thesis) 📅
Macro Elliott Wave: We're potentially in Wave 3 of a larger cycle—still room for aggressive expansion. Wave structure favors break of 25,350 targeting 25,500-25,650 daily close.
Double Bottom Recognition: Historical pattern shows Double Bottom formation near 25,000 support—confirmed breakthrough above 25,250 neckline triggered. Second target near 25,450-25,500.
Bollinger Bands Daily: Upper band at 25,480 = realistic daily target. Mean (25,200) = healthy pullback support. Band slope indicates volatility expansion—expect 250-400 pip daily ranges.
Volume Signature: Daily volume profile shows strong buying volume bar at 25,050-25,100 zone (institutional accumulation marker). Selling volume decreasing—demand controlling.
Ichimoku Daily: Cloud thickness growing—bullish trend strengthening. Cloud support around 25,150-25,200. Kumo Breakout anticipated—targets cloud top edge at 25,350-25,420.
Harmonic Analysis: Butterfly Pattern potential completion—PRZ at 25,280-25,320 suggests reversal zone OR breakout confirmation. Confluence amplifies probability.
Gann Angles & Fibonacci: 50% retracement (25,100) + 61.8% extension (25,420) = key reversal zones. Gann fan angles suggest 25,350-25,400 as structural resistance before continuation.
Key Daily Support: 25,000 (psychological/structural) | 25,050 (accumulation) | 25,140 (weekly midpoint) | 25,200 (demand zone)
Key Daily Resistance: 25,280 (breakout trigger) | 25,350 (extension) | 25,420 (measured move) | 25,500 (weekly target)
---
## 🎪 TRADING SETUP PLAYBOOK - NOV 10-14
### BULLISH SCENARIO (Probability: 72%) ✅
Trigger: 4H candle close above 25,280 + volume surge + RSI above 55
Entry Zone: 25,200-25,250 (with breakout confirmation)
Target 1: 25,350 | Target 2: 25,420 | Target 3: 25,500
Stop Loss: 25,120 (below EMA support)
Risk/Reward: 1:2.8 (excellent entry)
### BEARISH SCENARIO (Probability: 28%) ⚠️
Trigger: Daily close below 25,200 + volume increase + RSI divergence
Entry Zone: 25,280-25,300 (short setup)
Target 1: 25,200 | Target 2: 25,140 | Target 3: 25,050
Stop Loss: 25,350 (above resistance)
Risk/Reward: 1:2.1 (acceptable but lower probability)
---
## ⚠️ VOLATILITY & OVERBOUGHT/OVERSOLD CONDITIONS
Current Volatility Status: Moderate compression → Expect expansion soon
5M/15M: RSI in 40-65 range (neutral)—room for 25-40 pip moves
30M/1H: RSI near 55-60 (bullish bias, not extreme)
4H: RSI 54-62 range—still room to run without overbought
Daily: RSI 58-68 (approaching caution zone)—be defensive if daily RSI>75
Overbought Recognition Points:
Watch for RSI>75 combined with Band upper rejection + Ichimoku cloud top break fails. Take profits on technical extremes.
Oversold Setups:
RSI<30 on 1H + price below EMA 50 = high-probability bounce back to 25,200-25,250.
---
## 🎯 ENTRY & EXIT OPTIMIZATION
### OPTIMAL ENTRY TIMING
For Bullish Scalpers (5M): RSI bounce from 40-45 zone after Band lower touch = 15-25 pip scalp target
For Swing Traders (15M-30M): 15M candle close above 25,250 with 4H alignment = 60-120 pip swing target
For Core Swings (1H-4H): 4H pennant breakout above 25,280 on volume = 150-300+ pip target (hold 24-48 hours)
For Position Traders (Daily): Daily close above 25,350 = continuation play targeting 25,500-25,650 (hold 5-7 days)
### EXIT STRATEGIES
Take Profit Levels: 1. Fibonacci 38.2% = 25,280 | 2. Harmonic PRZ = 25,320 | 3. Daily Band upper = 25,420 | 4. Weekly target = 25,500
Stop Loss Placement: Below most recent swing low + 10 pips (risk management priority)
Trailing Stops: Activate at 25,350—trail with 40-50 pip buffer for 4H+ trades
Breakeven Exit: Move stops to entry after 1:1 risk/reward achieved—reduce emotional trading
---
## 🔔 REVERSAL & BREAKOUT RECOGNITION CHECKLIST
### REVERSAL SIGNALS TO WATCH:
RSI divergence (lower highs on price, higher lows on indicator)
Candlestick engulfing patterns at resistance/support zones
Volume breakdown (declining volume on breakout attempts)
Ichimoku Cloud rejection (price fails to penetrate cloud layer)
Harmonic pattern completion (Gartley/Butterfly PRZ exact hit)
Elliott Wave 5th wave failure (truncation pattern)
### BREAKOUT CONFIRMATION RULES:
Close beyond resistance on high volume (>20% volume increase)
RSI confirms breakout direction (above 55 for bullish, below 45 for bearish)
VWAP crosses align with directional move
Bollinger Band breakout with band expansion (squeeze release)
Multiple timeframe confluence (5M + 15M + 1H aligned)
Ichimoku Cloud break (price clears all clouds smoothly)
---
## 💡 WEEK FORECAST SUMMARY - NOV 10-14
Monday (10th): Consolidation continuation—watch for range break direction. European open volatility catalyst expected.
Tuesday-Wednesday: Breakout window opens—25,280 represents key decision point. Expect 150-250 pip daily moves.
Thursday: Potential pullback/consolidation after breakout (profit-taking). Support retest of 25,250-25,200.
Friday (14th): Weekly close pattern formation—extension run anticipated if above 25,350. Week target: 25,420-25,500.
---
## 📍 CRITICAL CONFLUENCE ZONES
25,080-25,100: Major support (accumulation zone, Wyckoff spring testing area)
25,140-25,180: Secondary support (EMA 9, Ichimoku, volume POC)
25,200-25,250: Entry zone (demand cluster, Cup handle support)
25,280-25,320: KEY BREAKOUT ZONE (all timeframe resistance, harmonic confluence)
25,350-25,420: Primary upside target (Elliott Wave 5, daily Band, measured move extension)
25,500+: Weekly resistance/extension target
---
## 🏆 RISK MANAGEMENT SUMMARY
✅ Never risk >2% account per trade
✅ Use 1:2+ risk/reward minimum on all entries
✅ Scale profits at 1:1 and 1:2 levels
✅ Maintain tight stops (10-15 pips on 1H trades)
✅ Avoid breakout FOMO—wait for close confirmation
✅ Respect daily support zones—psychological holds matter
---
## #TRADINGSETUP #NAS100 #TECHNICALANALYSIS #NASDAQ100
#ELLIOTTWAVE #HARMONICPATTERN #BREAKOUTTRADING #SWINGTRADER
#DAYTRADING #INTRADAY #FOREX #TRADING #ANALYSIS #TRADINGVIEW
#BOLLINGER BANDS #RSI #ICHIMOKU #VWAP #TRADINGSTRATEGY
#WYCKOFFMETHOD #GANNTHEORY #DOWTHEORY #TECHNICALS
#SUPPORTANDRESISTANCE #VOLUMEANALYSIS #OVERBOUGHT #OVERSOLD
---
Disclaimer: This analysis is educational only. Always conduct your own research and use appropriate risk management. Past performance ≠ future results. Trade at your own risk.
Analysis Created: November 8, 2025 | Valid Through: November 14, 2025

Nasdaq completed market cycle and bounced back from supportNasdaq completed market cycle and bounced back from support.

NAS100 - BullishNAS100 is bullish on 4H timeframe is currently bouncing from trendline support. Buying at current market price.

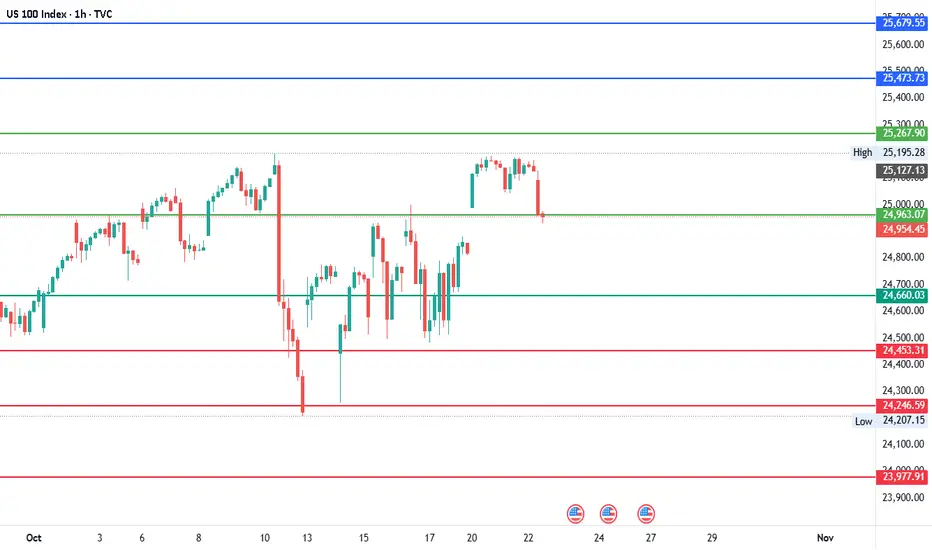
#NDQ - Short-term Range $26,216 - $23,709 | 1000 Points Move?Date: 22-10-2025
#NDQ - Current Price: $24,963.00
Pivot Point: $24,963.07 Support: $24,660.03 Resistance: $25,267.90
Upside Levels:
L1: $25,473.73 L2: $25,679.55 L3: $25,948.23 L4: $26,216.91
Downside Levels:
L1: $24,453.31 L2: $24,246.59 L3: $23,977.91 L4: $23,709.23
#TradingView #Nifty #BankNifty #DJI #NDQ #SENSEX #DAX #USOIL #GOLD #SILVER
NAS100 H1 | Bullish Bounce off Key SupportNAS100 is falling towards our buy entry at 24,841, which is a swing low support level that aligns with the 161.8% Fibonacci extension level.
The stop loss is at 24,664, which is a swing low support level, while the take profit is at 25,102, which is a pullback resistance level.
Stratos Markets Limited (tradu.com/uk ):
CFDs are complex instruments and come with a high risk of losing money rapidly due to leverage. 68% of retail investor accounts lose money when trading CFDs with this provider. You should consider whether you understand how CFDs work and whether you can afford to take the high risk of losing your money.
Stratos Europe Ltd (tradu.com/eu ):
CFDs are complex instruments and come with a high risk of losing money rapidly due to leverage. 70% of retail investor accounts lose money when trading CFDs with this provider. You should consider whether you understand how CFDs work and whether you can afford to take the high risk of losing your money.

Nasdaq Swing bullish setup4 hour
fibonacci Retracement 50% and 60%
1 hour
Wait for trend reversal
RRR 1:3 and hold for 1:5

NAS100 Trade Set Up Nov 6 2025Price is bullish making HH/HL on the 1h and BOS of the Asia range so i will wait for price to sweep internal SSL and/or tap into 1h FVG to then look for 1m-5m IFVG/CISD to take buys to PDH and daily FVG to fill the imbalance

NAS100 H4 | Bearish Reaction off FVGNAS100 is now rising towards our sell entry at 25,883, which aligns with the H4 Fair Value Gap and 71% Fibonacci retracement. We shall see how price reacts to this area after it breaks through the previous 2 swing high resistance levels.
The stop loss is at 26,167, which is a swing high resistance level, while the take profit is at 25,313, which is a swing low support level.
Once price reacts bearishly, do take note of the above swing low support level at 25,581 as well.
Stratos Markets Limited (tradu.com/uk ):
CFDs are complex instruments and come with a high risk of losing money rapidly due to leverage. 68% of retail investor accounts lose money when trading CFDs with this provider. You should consider whether you understand how CFDs work and whether you can afford to take the high risk of losing your money.
Stratos Europe Ltd (tradu.com/eu ):
CFDs are complex instruments and come with a high risk of losing money rapidly due to leverage. 70% of retail investor accounts lose money when trading CFDs with this provider. You should consider whether you understand how CFDs work and whether you can afford to take the high risk of losing your money.

nas longim looking for this,best look at 1m chart. if price on 1m holds, looking to long this.
we broken previous high already. if holds looking to enter this trade. best around usa opening timezone

NASDAQ - Signal#NASDAQ - Signal
H4 - Formation of the 3rd wave + trend line breakout. Stop at the low of the 1st wave.
Entry: 25758.3
TP: 26252.9 - 26916.2 - 27341.2 - 28019.1
Stop: 25142.7

USNAS100 | Buyers Hold Control Above 25440USNAS100 | Overview
The price reached the resistance zone after stabilizing above 25440.
Currently, it appears to be retesting 25440 before attempting another push higher toward 25700 – 25820.
A 1H close above 25820 would confirm further bullish momentum toward the all-time high (ATH) at 26170.
However, a move below 25440 would indicate renewed bearish pressure toward 25220, with a confirmed break below 25220 activating a broader downward trend.
Pivot Line: 25700
Resistance: 25820 · 25960 · 26170
Support: 25440 · 25230 · 25010
Outlook:
Bullish while above 25440, targeting 25700–25820.
Bearish scenario activates only below 25220.

US100 - BULLISH POSSIBILITYPrice constantly forming higher lows which indicate a strong uptrend tendency. Possibility of stronger confirmation if you decide to wait for price to break above 25,750. This is purely ideas purpose only and should not be used alone to take on a trade. Good profits traders.

bullish or bearish continuation Idea for todaygoing down
Based on 1 hour trend reversal
Im only writing this because trading view wants more of a description

Nasdaq NAS100 Bulls Regain Control: What I’m Watching Next📈 On the 4-hour NASDAQ chart, we can clearly see a break in structure to the upside, signaling strong bullish momentum entering the market. 🟩 The buyers are showing strength, and I’ll be looking to capitalize on this momentum — but only if we see a confirmed break of the current swing high, followed by a retracement into the retest zone. 🔁
However, patience is key. ⏳ I’ll only look to engage if today’s New York session data release aligns with and supports the bullish bias. Fundamentals and technicals must work together before I take a position.
As mentioned in the video, if the anticipated price action fails to materialize, we’ll simply abandon this setup and move on — staying disciplined is crucial. 🚫
⚠️ Disclaimer: This analysis is for educational purposes only and not financial advice.

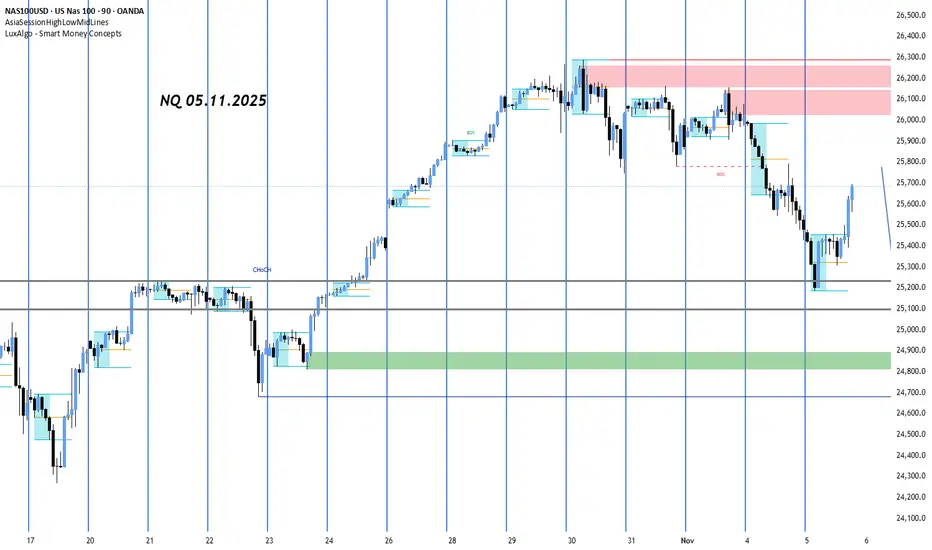
Nasdaq 100 – A Quiet Accumulation Before the Next PushThe Nasdaq 100 (US100) is showing early signs of a structural rebalancing after the recent correction. Price is currently hovering near 25,600, retracing modestly after a short-term rebound from the 25,280 demand zone — a level where Smart Money seems to have re-entered quietly.
💭 1️⃣ Market Structure – A Story of Displacement and Repricing
The current chart reveals a clear Break of Structure (BOS) followed by a corrective pullback.
After the previous sell-off, price found support at the 25,280 – 25,300 range — a discount zone aligning with both an order block and a trendline confluence.
This zone likely served as institutional demand, where Smart Money began accumulating long positions before the upward displacement.
The recent retracement, however, remains within a corrective structure, meaning we could still see one more liquidity sweep before the market decides its next major leg.
🩶 2️⃣ Supply & Demand Zones – The Footprints of Institutions
Karina is currently tracking three zones that matter most to the structure:
Demand Zone:
25,280 – 25,300: The base of institutional accumulation and current structural support.
Supply Zones:
25,970 – 26,160: A major bearish order block where Smart Money previously distributed positions — likely the next liquidity target.
The most probable scenario: a retest of the lower demand → a liquidity grab → bullish displacement toward 25,970 – 26,160 → reversal back to equilibrium.
🧭 3️⃣ Liquidity Flow – The Path of Least Resistance
Above the current range lies buy-side liquidity resting at 26,000+, while below, sell-side liquidity has already been swept near 25,280.
This suggests that the next move could be an engineered push upward — designed to collect liquidity above 25,970 – 26,160 before potential continuation back into the demand zone.
Such a move would mirror the classic SMC liquidity cycle:
Accumulate → Displace → Manipulate → Distribute.
🌙 4️⃣ Trading Outlook – Patience Before Precision
Karina’s bias for the day is moderately bullish, anticipating a short-term expansion toward the upper liquidity pool.
However, she remains cautious — waiting for confirmation near the demand zone before entering long.
Buy Idea:
Entry: 25,280 – 25,300
Stop Loss: below 25,200
Target 1: 25,970
Target 2: 26,160
If the liquidity sweep at 26,160 completes, Karina expects a controlled retracement — a potential short setup back into equilibrium around 25,400.
🌷 5️⃣ Reflection – When the Market Whispers, Smart Money Listens
The chart right now feels calm, methodical — like the quiet before a decisive wave.
Smart Money rarely rushes. It absorbs, manipulates, and moves when most traders stop paying attention.
For Karina, this is one of those moments where patience becomes the most powerful strategy.
The next move will not be random — it will be precise, intentional, and elegant, just like the rhythm of liquidity itself 🌙
This analysis reflects Karina’s personal perspective and is not financial advice.
How do you see the US100’s next move? Is Smart Money gearing up for another liquidity sweep above 26k? Let’s discuss below 💬

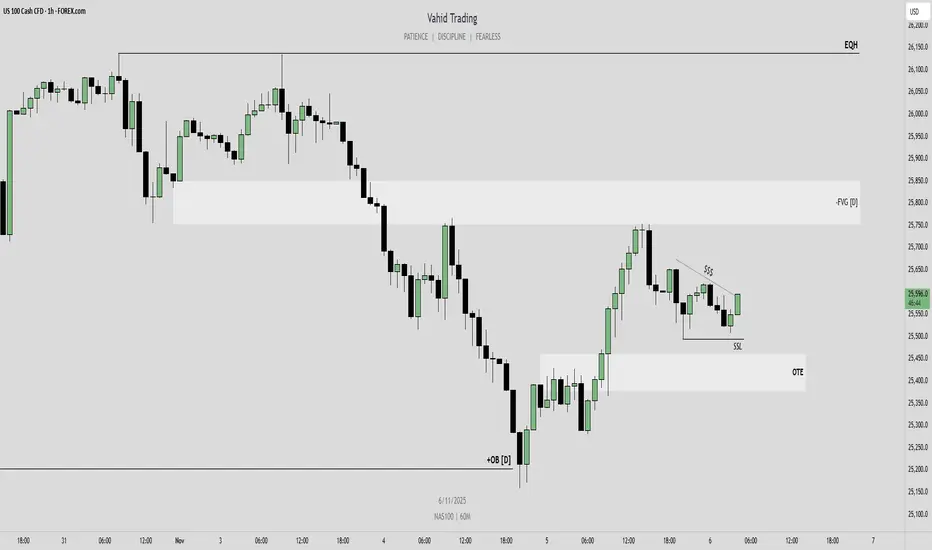
US100 – Bullish Continuation in Play After Daily OB ReactionHello traders,
On the 1-hour chart, NASDAQ (US100) has reacted strongly from the bullish Daily Order Block, showing clear signs of higher-timeframe strength. This reaction suggests that the bullish order flow is still intact.
With this structure in mind, I expect the upward move to continue toward the bearish Daily Fair Value Gap, which serves as my first target.
My final target for this bullish leg is the equal highs around 26,136, where a significant liquidity pool rests.
However, before the next expansion higher, I would prefer to see price move lower to sweep the liquidity below the recent lows and trade into an Optimal Trade Entry (OTE) zone. From there, I’ll look for lower-timeframe confirmation to catch the next leg up.
Staying bullish unless higher-timeframe invalidation occurs.
💌It is my honor to share your comments with me💌
🔎 DYOR
💡Wait for the update!

5 NOV 2025: US100 MARKET RECAPBREAD & BUTTER SETUP
DISCLAIMER:
The owner of this page is an authorised Representative under supervision of TD MARKETS (PTY) LTD, an authorised Financial Services Provider (FSP No. 49128) licensed by the Financial Sector Conduct Authority (FSCA) under the Financial Advisory and Intermediary Services Act (FAIS).
The FSP is licensed to provide advice and intermediary services in respect of Category I financial products, including but not limited to derivative instruments, long-term deposits, and short-term deposits.
All investment ideas are provided in accordance with the scope of the FSP's license and applicable regulatory requirements. Derivative instruments is a leveraged products that carry high risks and could result in losing all of your capital, and past performance is not indicative of future results.
This idea and any attachments are informational/education and does not constitute a recommendation to buy/sell.
No guarantee is made regarding the accuracy or outcome of this trade idea.
If you choose to accept this idea, please do so at your own risk.

Weakness PersistsI'm loathe to make a prediction here since I've been wrong so many times but I feel that today might be a bull trap. I still feel strongly the NASDAQ is in a bubble and I do hold a short in SNAS.AX. I'm thinking a close today below the rising blue trend line implies the breakdown is still in effect.

US100 Free Signal! Sell!
Hello,Traders!
US100 is expected to soon retest the horizontal supply area before continuing its bearish move toward the target zone.
---------------------
Stop Loss: 25,877$
Take Profit: 25,607$
Entry: 25,728$
Time Frame: 2H
---------------------
Sell!
Comment and subscribe to help us grow!
Check out other forecasts below too!
Disclosure: I am part of Trade Nation's Influencer program and receive a monthly fee for using their TradingView charts in my analysis.

NASDAQ POTENTIAL LONG 2 NOV 2025SWING TRADE
4H structure remains BULLISH
Waiting for the swing PB to look for longs at marked potential entry areas if 15m structure shifts BULLISH in either of these zones.
15m structure is currently BEARISH and will wait for MSS before looking for longs.
I am not interested in shorting the PB but instead going with the trend.
Currently up +-2000 points on NSDQ for SEP and OCT.
Follow me TRADINGVIEW
Insta garethxsavage

NQ is in a reversal mood, non-reversal traders, go cautiously!
NQ is in a reversal mood and a support area. non reversal traders, it is better to wait until thursday shows a clear direction of the market to uptrend or break low retest and then down trend. Such bumpy locations are when we stay put and wait until when this brief storm is over.