FTSE uptrend resistance at 9285The FTSE remains in a bullish trend, with recent price action showing signs of a corrective pullback within the broader uptrend.
Support Zone: 9195 – a key level from previous consolidation. Price is currently testing or approaching this level.
A bullish rebound from 9195 would confirm ongoing ups
About FTSE 100 Index
The UK Financial Times Stock Exchange 100, more commonly known as the FTSE 100 or 'Footsie', is an index of share prices of the largest 100 companies listed on the London Stock Exchange (LSE) by market capitalization. The index was launched on January 3, 1984 at a base value of 1000, and the index level is calculated in real-time. The FTSE 100 represents approximately 81% of the entire market capitalization of the LSE, and even though it doesn't encompass the whole market, it is widely viewed as the best indicator of the heath of UK stocks. In recent years, however, given the uptick in international companies counted in the FTSE 100, this particular market index is no longer viewed as the best health indicator of the UK economy - that goes to the FTSE 250, which has a smaller proportion of multinationals among its constituents.

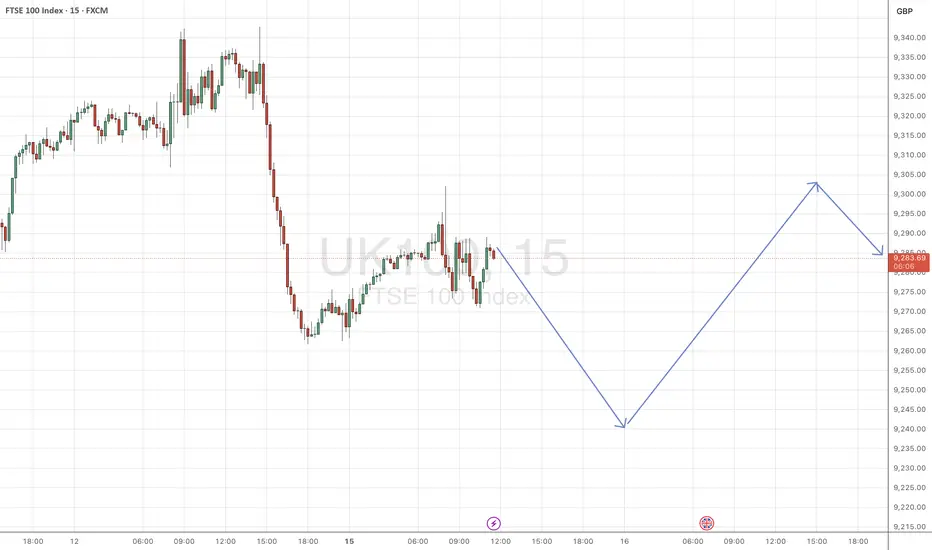
Heading into 38.2% Fibonacci resistance?UK100 is rising towards the pivot which acts as an overlap resistance that lines up with the 38.2% Fibonacci retracement and could reverse to the multi swing low support.
Pivot: 9,240.23
1st Support: 9,128.22
1st Resistance: 9,327.92
Disclaimer:
The above opinions given constitute general market

UK100 ShortLooks like the index might tumble from the golden Fibonacci level, confirmed by a price correction at the previous golden level and the mid-golden level at the 1.276 Fibonacci level, using the extended Fibonacci tool.

Rise and dip as bear Tuesday kicks in later30-Minute Chart Observations
Price is currently moving sideways around 9,274–9,278 (pivot level).
Very tight consolidation overnight with small candles (low volatility).
EMA cluster (10, 25, 200) is flat and converging — this often signals a larger directional move is coming.
Pivot points:

FTSE 100 uptrend remains intactThe FTSE 100 continues to trade above its multi-month rising trendline. The price has extended its recovery from the 9100 September low, rising above to a peak of 9340 last week, just shy of the 9360 record high.
Buyers will need to extend gains above 9360 to head towards fresh record highs. 9500 is

Key Observations from the Chart with 9310 resistancePrice Action & Trend
The FTSE is currently at 9,281.7, just below the daily pivot (9,289).
Price is trading within a rising trend channel (red lines).
Higher lows since early September suggest short-term bullish momentum.
Moving Averages (EMA 10, 25, 200)
EMA (10) and EMA (25) are pointing upward
Can Britain's Stock Market Survive Its Own Streets?The FTSE 100's recent 10.9% year-to-date outperformance against the S&P 500's 8.8% return masks deeper structural vulnerabilities that threaten the UK market's long-term viability. While this temporary surge appears to be driven by investor rotation away from overvalued US tech stocks toward traditi


UK100--LONG--monthly bullish
--weekly bullish
--daily bullish
--entry and tp levels are as shown on chart

Will The FTSE100 Breakout Trigger This Bullish Plan?🎯 Title: UK100/FTSE100 Money Heist Plan: Bullish Breakout Play (Swing Trade) 💰⚡
Asset: #UK100 #FTSE100 ( TVC:UKOIL , FX:GBPUSD , OANDA:EURGBP )
🗺️ The Heist Plan Overview
Ladies & Gentlemen, Thief OG's! 👋🕵️♂️ Welcome to the vault. Our plan is a calculated BULLISH swing trade on the UK100, trigge

See all ideas
Displays a symbol's price movements over previous years to identify recurring trends.
Frequently Asked Questions
FTSE 100 Index reached its highest quote on Aug 22, 2025 — 9,360.6 GBP. See more data on the FTSE 100 Index chart.
The lowest ever quote of FTSE 100 Index is 3,442.5 GBP. It was reached on Mar 9, 2009. See more data on the FTSE 100 Index chart.
FTSE 100 Index is just a number that lets you track performance of the instruments comprising the index, so you can't invest in it directly. But you can buy FTSE 100 Index futures or funds or invest in its components.