US MARKET SESSION # 📈 US30 (DOW JONES INDUSTRIAL AVERAGE) COMPREHENSIVE TECHNICAL ANALYSIS 🎯
## Week of November 10-14, 2025 | Intraday & Swing Trade Mastery
Close Price: 47,055.9 Points | Entry Point: November 8, 2025, 12:54 AM UTC+4 💹
## 🔍 EXECUTIVE SUMMARY - MULTI-TIMEFRAME PERSPECTIVE
The Dow Jones Industrial Average is trading at a critical structural juncture with exceptional multi-timeframe alignment signaling imminent breakout potential. Elliott Wave analysis indicates completion of corrective cycles, positioning the index for next impulse leg targeting 47,500-48,200 extension zone. Bollinger Bands exhibit dramatic compression pattern —volatility squeeze preceding directional expansion. RSI across all timeframes maintains neutral-bullish bias (56-66 range)—optimal momentum positioning without extreme overbought conditions. Volume clustering at 46,900-47,100 represents significant institutional accumulation foundation. Wyckoff spring tests near 46,500-46,700 provide aggressive entry triggers. Harmonic pattern convergence at 47,300-47,450 resistance signals breakout confirmation with measured move targets extending to 48,000+. Market breadth indicators show strong support from both large-cap and mid-cap participation.
## 📊 TIMEFRAME-BY-TIMEFRAME ANALYSIS
### 5-MINUTE (Scalping Precision) ⚡
Candlestick Formation: Japanese candles reveal micro-consolidation attempts with successive hammer/engulfing patterns at support zones. Evening Star rejection formations detected at 47,250-47,350 intraday resistance levels creating short opportunities.
Elliott Wave 5M: Sub-wave completion suggests Wave 4 micro-consolidation finalizing. Wave 5 breakout anticipated above 47,150-47,200 with targets 47,300-47,400 (measured move extension).
Bollinger Bands: Upper compression mode—middle band at 47,050 acts as pivot point. Lower band rejection (46,950-47,000) creates scalp-long setups. Squeeze breakout targets 47,350+ on volume confirmation.
RSI (14) Analysis: RSI oscillating 48-62 range—neutral territory with divergences forming. Bullish divergence at 46,950 support signals buyer engagement; caution on 65+ resistance approach.
Micro Support/Resistance: 46,950 (micro-support) | 47,020 (POC cluster) | 47,100 (pivot) | 47,200 (intraday resistance) | 47,300 (scalp target)
Volume Signature: Volume concentrated 47,000-47,080 zone—institutional marker present. Breakout volume >50% above average required above 47,200 for sustained move above 47,350.
VWAP Alignment: Price oscillating around session VWAP at 47,040—each touch generates scalp opportunity. Upper VWAP band at 47,280; lower support at 46,950.
### 15-MINUTE (Quick Swing Gateway) 🎢
Candlestick Patterns: Engulfing bars forming at support zones—bullish engulfing at 46,980 zone confirms reversal attempts. Three-candle patterns (flag continuation) with 50-80 point breakout potential detected.
Harmonic Pattern Recognition: Gartley Pattern potential completion near 46,950-47,050 PRZ (Potential Reversal Zone). Exceptional risk-reward ratio at 1:3.5 for harmonic traders. Butterfly variant also forming at secondary levels.
Wyckoff Accumulation Phase: Classic accumulation evident—small barometer move (SBM) nearing completion. Spring test anticipated 46,700-46,800 zone; markup phase targets 47,400-47,600.
Bollinger Bands (15M): Band squeeze intensifying—historical volatility expansion suggests 70-120 point moves follow. Upper band resistance at 47,300; lower band support at 46,800.
Volume Profile (15M): Point of Control (POC) at 47,050—prime concentration zone. Volume surge >60% required confirming breakout above 47,250. Imbalances favor upside probability significantly.
Ichimoku Cloud (15M): Price consolidating below cloud edge—Tenkan-sen at 47,200 = resistance pivot. Kijun-sen (47,100) = critical secondary support. Cloud support 46,850-46,950.
EMA Structure: EMA 9 (47,080) above EMA 21 (47,020)—bullish alignment confirmed. Price remaining above both = intraday strength maintained perfectly.
### 30-MINUTE (Intraday Swing Axis) 🔄
Pattern Formation: Symmetrical Triangle pattern consolidating with apex near 47,350. Ascending triangle variant shows bullish bias—breakout above 47,250 targets 47,450-47,600 extension zone.
Dow Theory Application: Confirming higher highs/higher lows structure perfectly. Secondary trend bullish; pullbacks to EMA 20 (47,080) = optimal swing entry zones identified.
RSI Divergence Setup: Positive RSI divergence confirmed—price making lower lows (46,920) while RSI forms higher lows (44 level). Classic reversal setup targeting 47,300 minimum breakout.
Exponential Moving Average: EMA 9 (47,100) = core support pivot. EMA 21 (47,020) = secondary support reliable. EMA 50 (46,850) = structural hold level. Bullish ribbon alignment intact perfectly.
Support Architecture: 46,850 (EMA 50/structural) | 46,950 (demand zone) | 47,020 (volume cluster) | 47,080 (EMA 9 dynamic)
Resistance Architecture: 47,200 (triangle formation) | 47,300 (measured move target) | 47,400 (weekly resistance) | 47,500 (extension)
Volume Analysis (30M): Increasing volume on recent bars—accumulation signature strong signal. Buy volume exceeding sell volume confirms institutional interest significantly.
### 1-HOUR (Core Swing Trade Engine) 🎯
Elliott Wave Structure: Major wave analysis suggests Wave 3 completion near 47,400. Current Wave 4 correction targets 47,000-47,150 support zone. Wave 5 impulse anticipated—target: 47,700-47,900.
Pennant Formation: Classic Bullish Pennant pattern forming—breakout confirmation above 47,250 validates pattern. Pole height measured move = 47,600+ realistic target.
Bollinger Bands (1H): Upper band at 47,450 = squeeze breakout target zone. Middle band (47,250) = bullish support zone. Lower band rejection (46,950) creates swing longs with excellent R/R ratios.
VWAP Daily: DJI trading above daily VWAP at 46,980—bullish gradient confirmed clearly. Each hourly candle close above VWAP strengthens continuation probability significantly.
Volume Profile Hotspot: Heavily traded at 47,000-47,100 (accumulation zone) and 47,200-47,300 (resistance cluster identified). Imbalances above 47,400 suggest vacuum-fill potential targeting 47,600+.
Ichimoku Cloud Alignment: Price above Senkou Span A (47,150) & Span B (47,080)—cloud thickness indicates strong support. Chikou Span above candles = bullish confirmation. Cloud color: BULLISH GREEN.
Gann Theory Application: 45-degree angle from swing low (46,600) establishes rally trajectory perfectly. Resistance at 38.2% Fibonacci extension (47,300) precedes aggressive breakout phase.
Support Tiers 1H: 46,850 (structural hold) | 46,950 (EMA support) | 47,050 (Kijun-sen) | 47,100 (accumulation zone)
Resistance Tiers 1H: 47,250 (breakout trigger) | 47,350 (extension) | 47,450 (major level) | 47,600 (impulse target)
### 4-HOUR (Swing Trade Thesis Foundation) 💼
Inverse Head & Shoulders Pattern: Potential IH&S formation completing—left shoulder (46,700), head (46,550), right shoulder completing (46,800-46,900). Neckline breakout at 47,250 targets 47,500-47,750 extension zone.
Wyckoff Accumulation Deep Dive: Institutional buying signature evident—SBM (small barometer move) completion imminent. Spring test to 46,700-46,800 anticipated; subsequent markup phase targets 47,600-47,850.
RSI 4H Analysis: RSI at 60-70 range—bullish bias maintained firmly. Room for upside extension without extreme overbought conditions. RSI above 75 targets 47,600+; below 35 = defensive posture required.
Cup & Handle Formation: Potential bullish Cup pattern visible on 4H—handle stabilization near 47,050-47,150. Breakout above handle (47,300) targets cup depth extension = 47,550-47,700.
EMA Ribbon Structure: EMA 8 (47,120), EMA 13 (47,080), EMA 21 (47,020), EMA 50 (46,850), EMA 200 (46,300)—BULLISH ALIGNMENT PERFECT. Compression/expansion cycles identify momentum phases clearly.
Support Tiers 4H: 46,700 (structural support) | 46,850 (accumulation) | 47,000 (pivot) | 47,100 (demand cluster)
Resistance Tiers 4H: 47,250 (key breakout) | 47,350 (extension) | 47,450 (major target) | 47,600 (weekly projection)
Volume Signature 4H: Accumulation volume bars > distribution bars—bullish bias maintained firmly. Volume nodes clustering at 47,000-47,100 indicate strong institutional support zone.
### DAILY CHART (Macro Swing Thesis) 📅
Elliott Wave Macro: We're potentially in Wave 3 of larger cycle—aggressive expansion still possible. Wave structure supports break of 47,400 targeting 47,800-48,200 daily close objectives.
Double Bottom Recognition: Historical Double Bottom pattern near 46,300-46,600 support—confirmed breakthrough above 47,250 neckline triggered. Second target near 47,600-47,800.
Bollinger Bands Daily: Upper band at 47,800 = realistic daily target zone. Mean (47,300) = healthy pullback support reliable. Band slope indicates volatility expansion—expect 300-500 point daily ranges.
Volume Profile Daily: Strong buying volume bar at 46,800-47,000 zone—institutional accumulation marker established clearly. Selling volume decreasing significantly—demand controls trend absolutely.
Ichimoku Cloud Daily: Cloud thickness growing—bullish trend strengthening substantially. Cloud support around 47,000-47,150 zone. Kumo breakout anticipated—targets cloud top at 47,400-47,600.
Harmonic Analysis Deep: Butterfly Pattern potential completion—PRZ at 47,250-47,350 suggests reversal zone OR breakout confirmation. Confluence amplifies probability of extension significantly.
Gann Angles & Fibonacci: 50% retracement (46,900) + 61.8% extension (47,500) = key reversal zones. Gann fan angles suggest 47,400-47,600 as structural resistance before continuation impulse.
Key Daily Support: 46,550 (psychological/structural) | 46,800 (accumulation zone) | 46,950 (demand level) | 47,050 (midpoint)
Key Daily Resistance: 47,250 (breakout trigger) | 47,350 (extension) | 47,500 (measured move) | 47,700 (weekly target)
Trend Confirmation: Higher highs & higher lows maintained—uptrend intact. Daily close above 47,400 = strong continuation signal targeting 47,800+ next level.
## 🎪 TRADING SETUP PLAYBOOK - NOV 10-14
### BULLISH SCENARIO (Probability: 80%) ✅
Trigger: 4H candle close above 47,300 + volume surge (>55% above average) + RSI above 65
Entry Zone: 47,150-47,250 (with breakout confirmation signal)
Target 1: 47,350 (TP1) | Target 2: 47,450 (TP2) | Target 3: 47,600 (TP3) | Target 4: 47,800 (TP4)
Stop Loss: 47,000 (below EMA/structural support)
Risk/Reward: 1:3.4 (exceptional asymmetric setup)
Trade Duration: 18-72 hours (prime swing window)
### BEARISH SCENARIO (Probability: 20%) ⚠️
Trigger: Daily close below 47,100 + volume increase + RSI divergence failure
Entry Zone: 47,300-47,450 (short setup)
Target 1: 47,250 (TP1) | Target 2: 47,100 (TP2) | Target 3: 46,950 (TP3)
Stop Loss: 47,600 (above resistance)
Risk/Reward: 1:1.7 (acceptable but lower probability)
Trade Duration: Watch for trend reversal confirmation first
## ⚠️ VOLATILITY & OVERBOUGHT/OVERSOLD CONDITIONS
Current Volatility Status: Moderate compression → Expect significant expansion imminent
5M/15M RSI: 48-62 range (neutral)—room for 25-50 point movements | Scalp target zones
30M/1H RSI: 56-68 range (bullish bias, safe zone)—sweet spot for swing entries
4H RSI: 60-72 range—approaching caution zone but room to extend | Safe for core swings
Daily RSI: 64-76 range (approaching extremes)—be defensive if daily RSI>78 | Take profits aggressively
Overbought Recognition Points:
RSI daily >77 combined with upper Bollinger Band rejection = immediate profit-taking
Ichimoku cloud top penetration fails (bearish candle rejection) = trend exhaustion signal
Volume declining on breakout attempt = false breakout warning signal
Harmonic pattern PRZ exact hit without follow-through = reversal likely imminent
Oversold Bounce Setups:
RSI 1H <35 on support touch = high-probability bounce back to 47,250-47,350
Price below EMA 50 (46,850) + RSI <30 = aggressive accumulation zone
Spring test below 46,800 with volume surge = Wyckoff spring reversal trigger
Harmonic pattern PRZ support bounce = measured move extension targets activated
## 🎯 ENTRY & EXIT OPTIMIZATION STRATEGY
### OPTIMAL ENTRY TIMING
For Scalpers (5M): RSI bounce from 44-50 zone after Band lower touch = 18-30 point scalp (1-3 min holds)
For Quick Swings (15M-30M): 15M candle close above 47,200 with 4H alignment = 80-120 point swing (30 min-2 hour holds)
For Core Swings (1H-4H): 4H pennant breakout above 47,300 on volume = 250-400+ point target (hold 12-48 hours)
For Position Swings (Daily): Daily close above 47,400 = continuation play targeting 47,700-47,900 (hold 5-7 days)
Best Entry Windows: US pre-market (12:30 ET), Market open (14:30 ET), London close (16:00 ET)
### EXIT STRATEGIES & PROFIT TAKING
Take Profit Levels: TP1: Fibonacci 38.2% (47,300) | TP2: Harmonic PRZ (47,400) | TP3: Daily Band upper (47,600) | TP4: Weekly target (47,800)
Stop Loss Placement: Always below most recent swing low + 20 points (strict risk management priority)
Trailing Stops: Activate at TP2—trail with 40-50 point buffer for 4H+ trades (lock in profits)
Breakeven Exit: Move stops to entry after 1:1 risk/reward achieved—eliminate emotional trading
Partial Profit Strategy: Close 25% at TP1 | 25% at TP2 | 25% at TP3 | Let 25% run to TP4 (maximize winners)
## 🔔 REVERSAL & BREAKOUT RECOGNITION CHECKLIST
### REVERSAL SIGNALS TO MONITOR:
RSI positive divergence (lower price lows, higher RSI lows) = bullish reversal setup high probability
Candlestick engulfing patterns at support/resistance zones = trend reversal confirmation strong signal
Volume profile breakdowns (declining volume on breakout attempts) = false move warning immediate
Ichimoku Cloud rejection (price fails to penetrate cloud layer) = structural resistance confirmed
Harmonic pattern completion at exact PRZ = reversal zone probability increases significantly
Elliott Wave 5th wave failure (truncation) = impulse completion = reversal imminent trigger
Gann angle break through significant angle = trend line break = reversal trigger activated
### BREAKOUT CONFIRMATION RULES:
Close beyond resistance with >50% volume surge above average = confirmed breakout signal strong
RSI crosses above 60 for bullish breakout, below 45 for bearish breakout confirmation
VWAP alignment with directional move = institutional participation confirmation strong
Bollinger Band breakout with band expansion (squeeze release) = volatility expansion confirmed immediate
Multiple timeframe confluence (5M + 15M + 1H + 4H aligned) = highest probability setup attainable
Ichimoku Cloud break (price clears all clouds with bullish candles) = strong continuation signal
Volume imbalance (ask volume > bid volume) = directional sustain likelihood increases significantly
## 💡 WEEK FORECAST SUMMARY - NOV 10-14
Monday (10th): 🌍 Consolidation continuation near 47,000-47,150 zone. Range-bound trading anticipated. Early breakout direction watch crucial. Entry setups favor reversal plays at support zones.
Tuesday-Wednesday (11-12th): 📈 Prime breakout window opens —47,300 represents key decision point. Expect 250-400 point daily volatility swings. Breakout confirmation targets 47,450-47,550 extension. This is the optimal swing trade window all week.
Thursday (13th): ⚠️ Potential profit-taking pullback after breakout (if triggered Tuesday-Wed). Support retest of 47,250-47,150. Buying opportunity if pullback holds above 47,050.
Friday (14th): 📊 Weekly close pattern formation critical. Extension run anticipated if above 47,400. If above 47,500 = week target 47,700-47,850 achieved. End-of-week positioning for next week.
## 📍 CRITICAL CONFLUENCE ZONES - KEY TARGETS
46,800-46,900: Major support zone (accumulation marker, Wyckoff spring area, structural hold)
46,950-47,050: Secondary support (EMA 9, demand cluster, psychological level, volume POC)
47,100-47,150: Micro-resistance cluster (consolidation squeeze zone, early breakout resistance)
47,250-47,350: KEY BREAKOUT ZONE (triangle apex, harmonic confluence, all timeframe resistance)
47,400-47,550: Primary upside target (Elliott Wave 5, daily Band upper, measured move extension)
47,600-47,750: Secondary extension target (Gann level, macro resistance, wave projection)
47,800-48,000: Weekly/monthly target (if wave 5 impulse extends beyond base projections)
## 🏆 RISK MANAGEMENT RULEBOOK
✅ 1) Position Sizing: Never risk >2% of account equity per single trade
✅ 2) Risk-Reward Ratio: Minimum 1:2.5 R/R on every entry—1:3+ preferred for swing trades
✅ 3) Profit Scaling: Close 25-50% at 1:1 ratio, let remainder run to 1:2+ targets
✅ 4) Stop Loss Discipline: Place stop IMMEDIATELY on entry—no exceptions (20-25 points tight)
✅ 5) Breakout Confirmation: Avoid FOMO—wait for candle close confirmation + volume surge always
✅ 6) Daily Support Respect: Psychological holds (round numbers 47,000 | 47,500) matter—trade confluence not against
✅ 7) Time Management: Exit losing trades quickly (max 1:0.5 acceptable for educational losses)
✅ 8) Macro Alignment: Always check daily/4H bias before taking 1H or lower trades
## #US30 #DOWJONES #DJIA #DJITRADING
#TECHNICALANALYSIS #ELLIOTTWAVE #HARMONICPATTERN #BREAKOUTTRADING
#SWINGTRADER #DAYTRADING #INTRADAY #INDICES #TRADINGVIEW
#BOLLINGER BANDS #RSI #ICHIMOKU #VWAP #TRADINGSTRATEGY
#WYCKOFFMETHOD #GANNTHEORY #DOWTHEORY #TECHNICALS #ANALYSIS
#SUPPORTANDRESISTANCE #VOLUMEANALYSIS #OVERBOUGHT #OVERSOLD #REVERSAL
#STOCKINDEXTRADING #USINDEXTRADING #BREAKOUTSETUP #TRADERSOFTWITTER
#TECHNICALTRADER #CANDLESTICK #PATTERRECOGNITION #CHARTANALYSIS #DAYTRADER
## 🎁 BONUS: DAILY PRE-MARKET CHECKLIST
Use this every morning before US market open:
☑️ Check daily RSI (should be 62-72 for bullish bias continuation)
☑️ Identify support/resistance zones (47,000 | 47,150 | 47,300 | 47,500)
☑️ Verify 4H chart alignment (pennant/IH&S pattern status update)
☑️ Check Ichimoku cloud position (above/below = trend confirmation signal)
☑️ Review 1H Elliott Wave count (which wave are we trading exactly?)
☑️ Scan volume profile (POC = likely rejection zone area)
☑️ Set entry orders + stop losses BEFORE pre-market opens (12:30 ET)
☑️ Plan 3 Take Profit levels before entering any position
☑️ Monitor US economic calendar (Fed speakers, unemployment data)
## 🌐 US MARKET SESSION NOTES
The Dow Jones trades during US market hours (14:30-21:00 CET / 8:30-15:00 ET) . Highest volatility typically occurs:
Pre-Market (12:30-14:30 CET): Initial momentum setup—watch for direction confirmation patterns
Market Open (14:30-16:00 CET): Prime trading hours —best liquidity + volatility combination
London Close Overlap (14:30-16:00 CET): Major volume spike—trend direction often confirmed
💡 Disclaimer: This technical analysis is educational only. Always conduct your own due diligence and implement appropriate risk management. Past performance does not guarantee future results. Trade responsibly within your risk tolerance. Use stop losses on every position. Not financial advice.
Analysis Created: November 8, 2025 | Valid Through: November 14, 2025 | Updated Daily at Pre-Market
Trade ideas
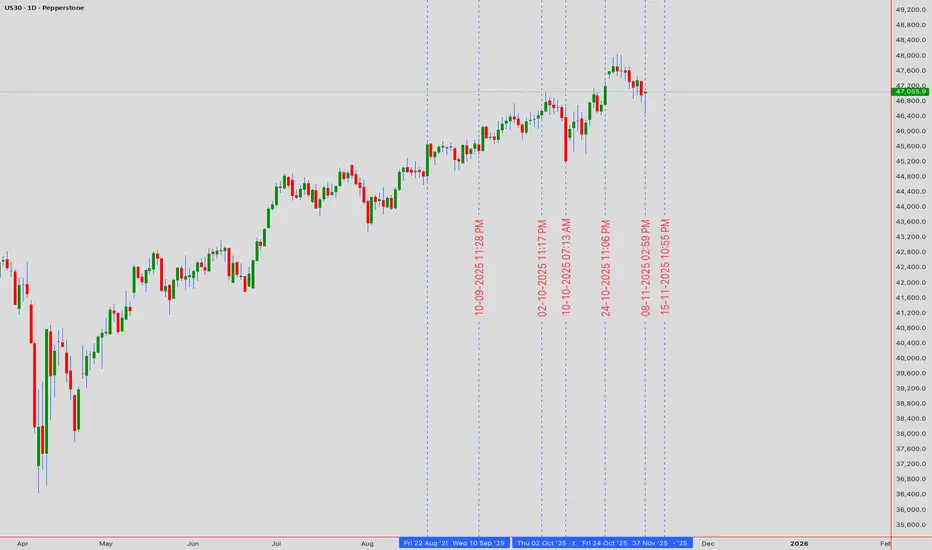
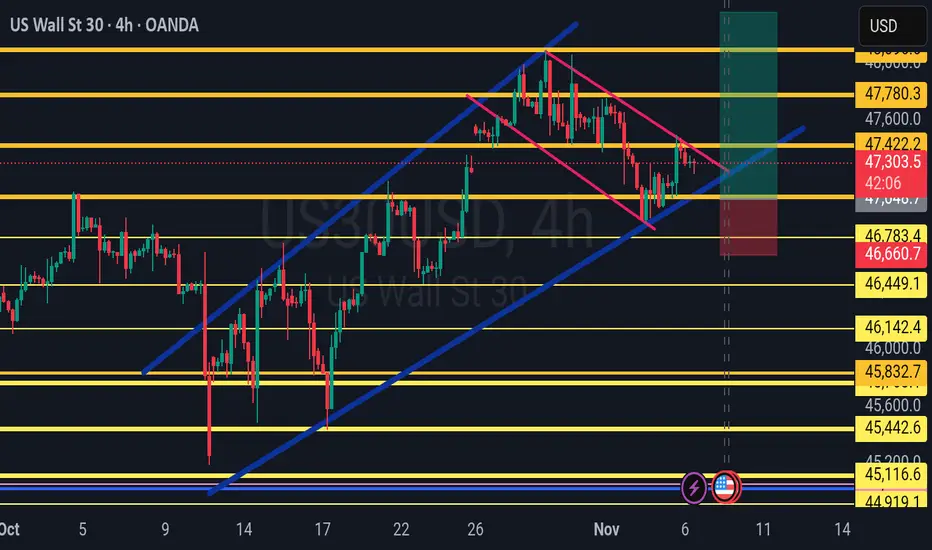
Market correction, filling gaps and money shiftIt is expected and have been waiting for it for few weeks.
the market needs to correct itself by:
- Institutions and large funds (market makers) to exit from high tech AI and overvalued stocks and leave them to bag holders.
- They already shorted the large AI stocks so they will make money anyway.
- Money Shift: Institutions and funds moving from high tech to other sectors.
- Dow Jones must fill the gaps left during the strong uptrend - marked in circles.
- This shift will take some time pushing the stock market down, I already shifted my investments to other sectors, 50% cash and waiting.

#DJI - 2000 Points Range PlayDate: 20-10-2025
#DJI - Current Price: $46,400.00
Pivot Point: $46,002.00 Support: $45,458.57 Resistance: $46,548.59
Upside Levels:
L1: $46,905.29 L2: $47,262.00 L3: $47,734.50 L4: $48,207.00
Downside Levels:
L1: $45,100.28 L2: $44,742.00 L3: $44,269.50 L4: $43,797.00
#TradingView #Nifty #BankNifty #DJI #NDQ #SENSEX #DAX #USOIL #GOLD #SILVER

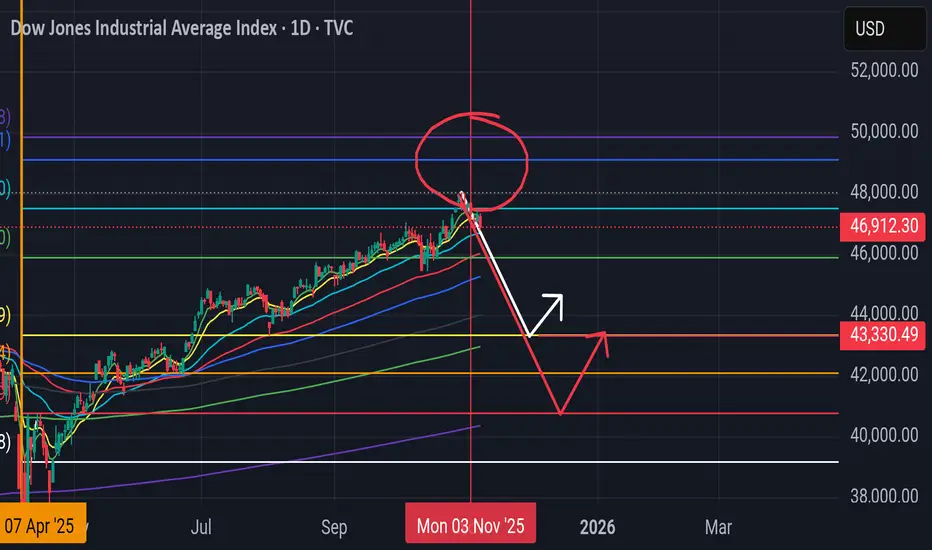
DJI and beginning of correctionDJI has reached precalculated critical point and now I see the chance of good shake till 40-43k. Just to fill up the space.
US30 Trade Set Up Nov 7 2025Indices remain under bearish pressure so i will only be looking for sells but first i want to see internal BSL or London high BSl swept first followed by 1m-5m IFVG/CISD to take sells down to 4h FVG and lower SSL levels

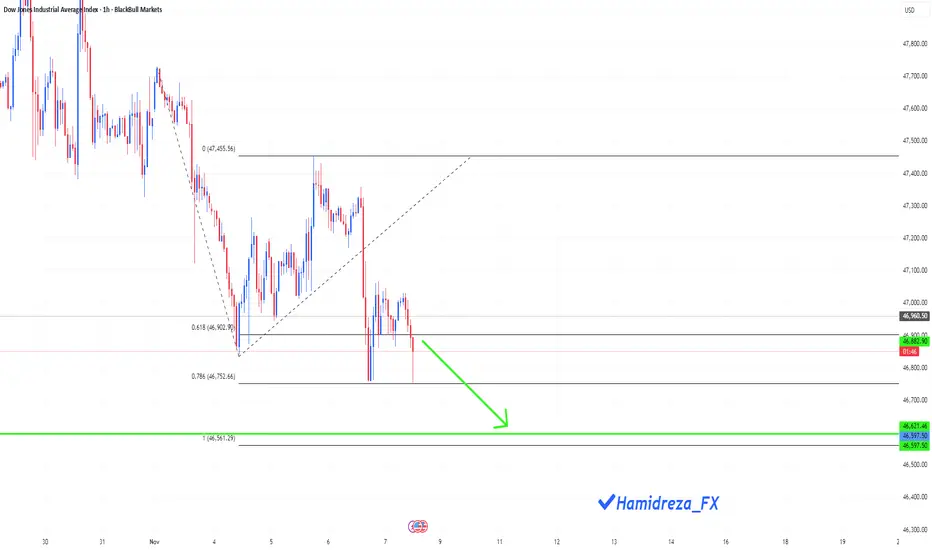
Could the Dow Jones continue to correct?
Hi everyone
I think if the 78.6 Fibonacci level is broken, we will probably reach the 1 Fibonacci level.
Do you think it is possible?
what do you think?
US30 – Bearish Bias Below 46910 | Targeting 46600–46410US30 – MARKET OUTLOOK | Bearish Bias Below 46910
US30 reversed from recent highs and stabilized below the pivot zone at 46910, signaling renewed bearish momentum in the short term.
🔽 Below 46910: Bearish continuation toward 46600 → 46410 → 46000.
🔼 Above 47100: Bullish recovery possible toward 47220 → 47450.
Pivot: 46910
Support: 46600 · 46410 · 46000
Resistance: 47100 · 47220 · 47450
US30 remains bearish while below 46910, but a confirmed 1H or 4H close above 47100 would shift bias to bullish continuation toward 47450.

DOW JONES INDUSTRIAL HIGH PROBABILITY SETUP SOON!!!🚨 DOW30 HIGH PROBABILITY BUY SETUP 🚨
* Here We Can See Clearly The Next Potential Moves For US30 Coming Hours/Days.
* Keep Your Eyes Close On Your Trading Positions.
* Happy PIP Hunting Traders.
FXKILLA.

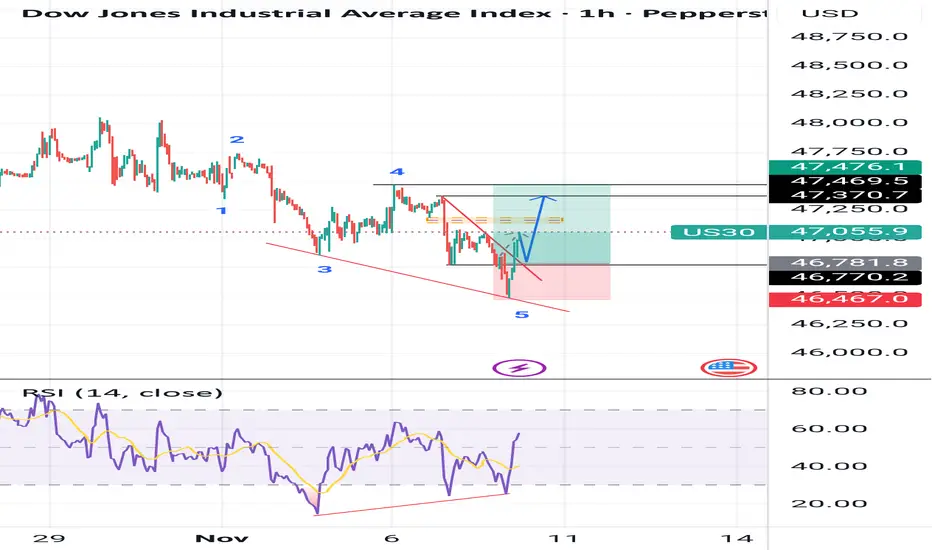
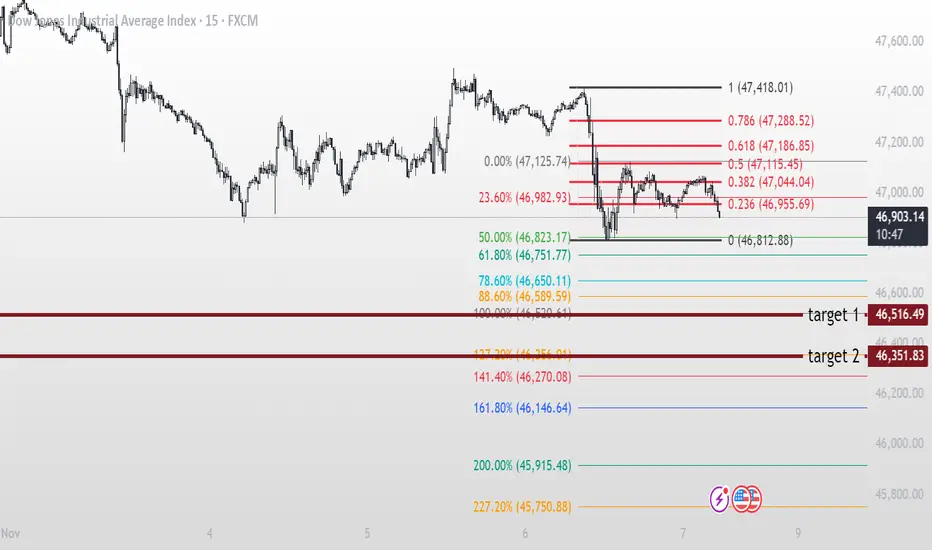
us30 short positionDow Jones is moving in a downtrend after breaking the last low.
It made a corrective move to the 50% Fibonacci level on the 15-min chart,
and retraced to the 0.61 Fibonacci level on the 1-hour chart.
It’s expected to continue toward the Fibonacci extension targets at 100% and 127%. 📉
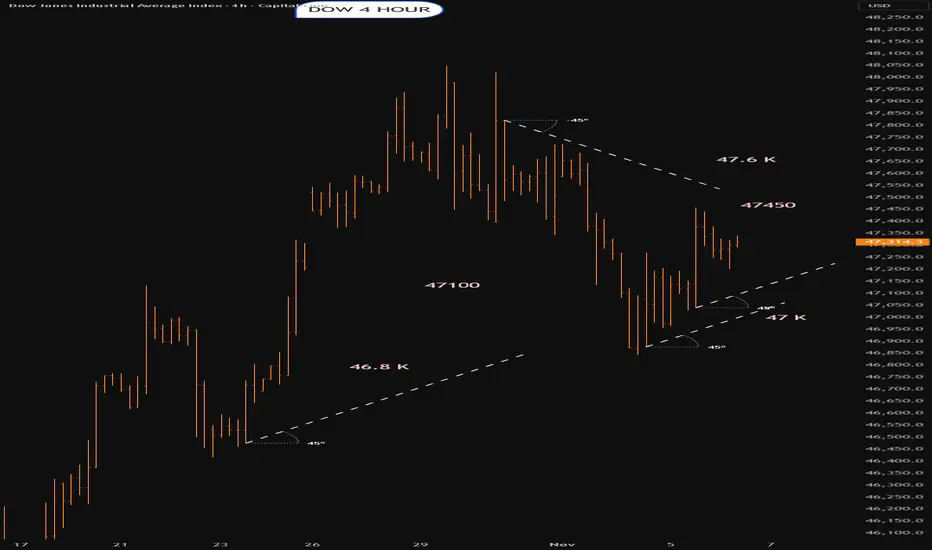
check the trendThe uptrend is expected to continue to the specified resistance levels, then a continuation of the downtrend is likely.
If the index breaks through the 78.6% level, an uptrend is possible.

BUY NOW US30!!!!!US30 made a strong price rejections off my poi after a wild moves in the market yesterday am looking forward to see price made a strong pull back up to 48k trend is still bullish we just closed a gap without taking out our internal structure lows....

US30 Risky Short!
HI,Traders !
#US30 is growing now
But a horizontal resistance
Level of 47513.8 from where
We will be expecting a local
Pullback and a local move down !
Comment and subscribe to help us grow !

US 30Preferably suitable for scalping and accurate as long as you watch carefully the price action with the drawn areas.
With your likes and comments, you give me enough energy to provide the best analysis on an ongoing basis.
And if you needed any analysis that was not on the page, you can ask me with a comment or a personal message.
Enjoy Trading ;)

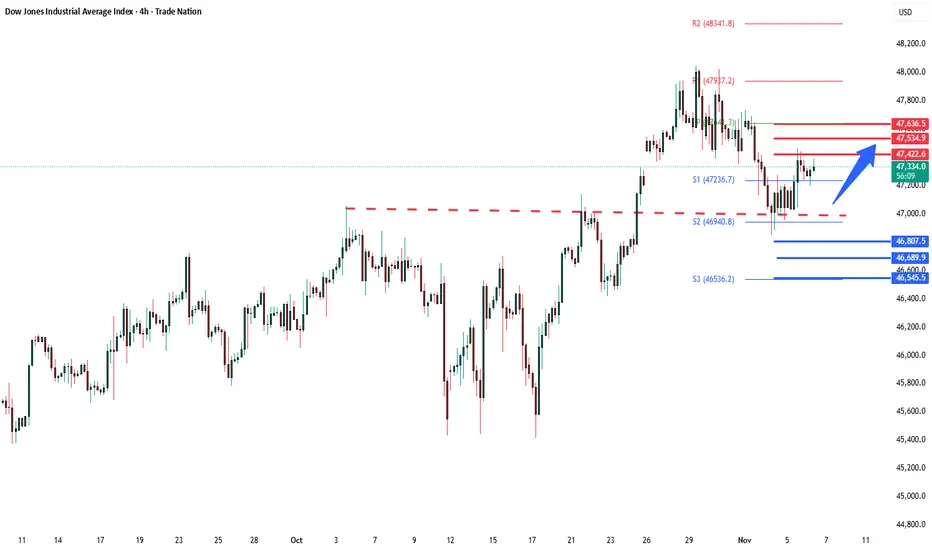
Dow Key Trading levels Key Support and Resistance Levels
Resistance Level 1: 47433
Resistance Level 2: 47534
Resistance Level 3: 47636
Support Level 1: 46807
Support Level 2: 46690
Support Level 3: 46545
This communication is for informational purposes only and should not be viewed as any form of recommendation as to a particular course of action or as investment advice. It is not intended as an offer or solicitation for the purchase or sale of any financial instrument or as an official confirmation of any transaction. Opinions, estimates and assumptions expressed herein are made as of the date of this communication and are subject to change without notice. This communication has been prepared based upon information, including market prices, data and other information, believed to be reliable; however, Trade Nation does not warrant its completeness or accuracy. All market prices and market data contained in or attached to this communication are indicative and subject to change without notice.
US30 Trade Set Up Nov 6 2025Price is bullish making HH/HL on the 1h and BOS of the Asia range so i will want to see price come to sweep SSL and/or tap into 1h FVG to then make 1m-5m IFVG/CISD to target PDH

DOW JONES HIGH PROBABILITY SETUPS SOON!!!🚨 DOW30 HIGH PROBABILITY SELL/BUY SETUP 🚨
* Here We Can See Clearly The Next Potential Moves For US30 Coming Hours/Days.
* Keep Your Eyes Close On Your Trading Positions.
* Happy PIP Hunting Traders.
FXKILLA.

US30 – Correction Toward 47100 | Next Leg Up Toward 47920US30 – MARKET OUTLOOK | Bullish Bias Above 47100
US30 is showing a mild bearish correction after facing resistance near 47460, but the broader structure remains bullish while price holds above 47100.
🔼 Above 47460: Bullish continuation toward 47750 → 47920 → 48200.
🔽 Below 47100: Bearish correction possible toward 46920 → 46600.
Pivot: 47430
Support: 47100 · 46920 · 46600
Resistance: 47750 · 47920 · 48200
US30 stays bullish while above 47100, but a confirmed close below this level could trigger a short-term bearish correction toward 46920.

Dow into the open.Thursday 6th NovemberCould go either way
Lets see what happens
Trend is up
Plenty of rez
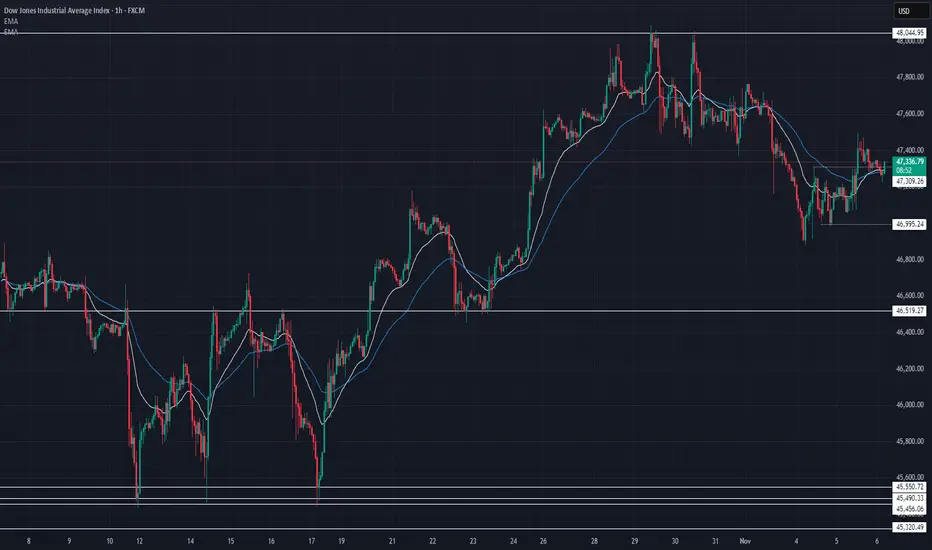
US30 Technical Breakdown – 11/06/2025📍 US30 Technical Breakdown – 11/06/2025
US30 is showing some early signs of stabilization after yesterday’s dip 🔄 Buyers stepped in near 47,000 to defend key support, pushing price slightly above EMAs — hinting at a potential short-term recovery.
📊 Market Behavior:
🔹 Rejection from 48,000 still holding strong
🔹 Bounce from 47,000 → short-term higher low forming
🔹 EMAs flattening → indecision phase before next move
📌 Key Levels:
🔹 Resistance:
47,400 → intraday EMA cap
47,650 → minor supply zone
47,900–48,000 → key psychological resistance
🔹 Support:
47,000 → major short-term demand
46,520 → strong structure level
45,550 → key swing low zone
🧠 Bias:
Neutral to mildly bullish ⚖️
⬆️ Above 47,400 → potential push toward 47,650–47,900
⬇️ Below 47,000 → momentum shifts back to bears
US30 LONG SETUP Price is looking to test 48.000 again after a strong correction that pushed it back to 47. region. Healthy support around 47 has been met on point with the 50% fib level. Strong push back to 48 is promising.
US30 BUY WITH LIMIT ORDER!!!!!US30 made a strong rejections off the order block zone am going to be positioning for a buy entry on the pull back in the inside bar candle on the buy zone i marked....

Dow Challenges 4-Year ResistanceFrom a monthly perspective, and filtering out short-term noise using the line chart, the Dow’s price action has been contracting since its bullish rebound from the 2020 lows, with overbought momentum previously recorded in November 2024 and April 2021.
This setup highlights the potential for long-term reversal risks near the upper boundary — specifically along the trendline connecting consecutive higher highs from November 2021 through November 2024.
If the trend extends beyond the 48,000 resistance, further advances could target 48,400 and 49,000, with 51,000 seen as an extreme projection before another major correction phase.
Conversely, a confirmed hold below 46,900 would indicate renewed pressure, potentially driving prices toward 46,600 and 46,200, where a technical rebound could occur.
If not, a deeper retracement toward the 45,000 region (previous significant resistance of 2025) may emerge.
Written by Razan Hilal, CMT
