U30 Trade Set Up Oct 20 2025I want to see price sweep BSL/London highs to then look for internal bearish structure on the 1m-5m to take sells to internal SSL
Trade ideas

DOW JONES INDUSTRIAL HIGH PROBABILITY SETUP SOON!!!🚨 DJ30 HIGH PROBABILITY SELL SETUP 🚨
* Here We Can See Clearly The Next Potential Move For US30 Coming Hours/Days.
* Keep Your Eyes Close On Your Trading Positions.
* Happy PIP Hunting Traders.
FXKILLA.

The Great Reset In a modern equivalent of the 1929 stock market crash, a rapid and severe market collapse would be triggered by a combination of overleveraged speculation, inflated tech valuations, and sudden shifts in global monetary policy. Within days, trillions in market value could vanish as algorithmic trading amplifies the sell-off, investor panic spreads through social media, and liquidity dries up. Major financial institutions could face insolvency risks, prompting emergency interventions from central banks and triggering a global recession reminiscent of the Great Depression—now unfolding at digital speed.

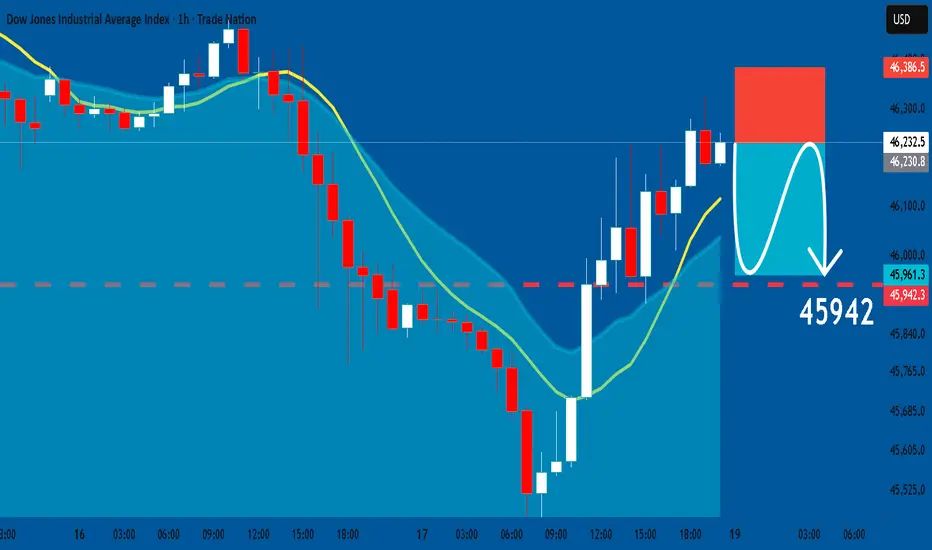
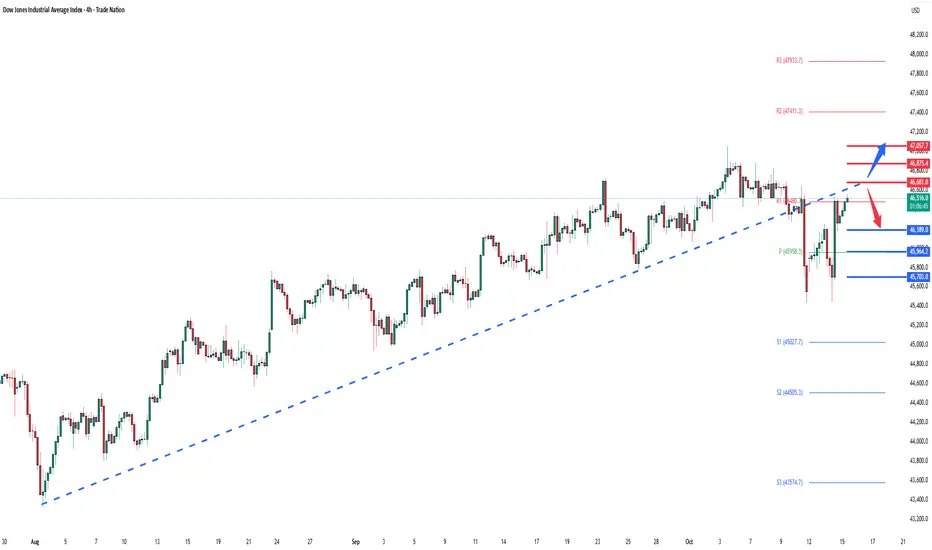
US30: Short Trade Explained
US30
- Classic bearish pattern
- Our team expects retracement
SUGGESTED TRADE:
Swing Trade
Sell US30
Entry - 46232
Stop - 46386
Take - 45943
Our Risk - 1%
Start protection of your profits from lower levels
Disclosure: I am part of Trade Nation's Influencer program and receive a monthly fee for using their TradingView charts in my analysis.
❤️ Please, support our work with like & comment! ❤️
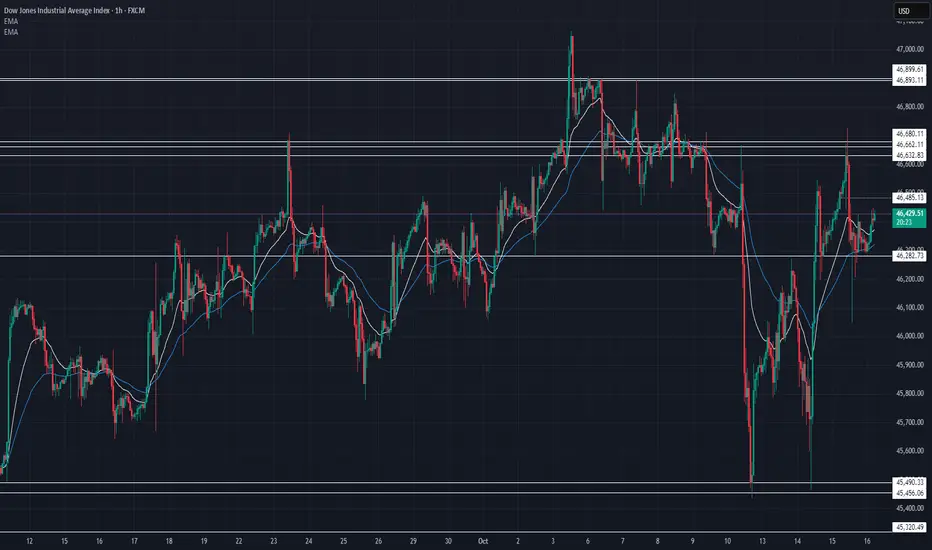
US30 Technical Breakdown – 10/16/2025📍 US30 Technical Breakdown – 10/16/2025
US30 showing strength again after defending the 46,200 zone 💪 Bulls holding control short-term but facing heavy resistance near 46,480–46,680. Market looks coiled for a breakout move soon ⚡️
📊 Market Behavior:
🔹 Strong bounce off 46,200 support zone
🔹 EMAs crossing bullishly on lower timeframes
🔹 Price retesting mid-range resistance — watching for momentum continuation
📌 Key Levels:
🔹 Resistance Zones:
46,485 → intraday barrier
46,632 → strong resistance
46,680 → breakout confirmation 🚀
46,893 → extended target
🔹 Support Zones:
46,282 → short-term support
46,200 → major pivot
45,837 → lower demand
🧠 Bias:
Bullish–Neutral 🟢
➡️ Above 46,680 → room toward 46,900
⬅️ Below 46,200 → momentum shift back to bears
Can Dow Jones Maintain Bullish Momentum? Analysis🎯 US30 Dow Jones: The Great Heist Setup! 🏦💰
📊 Asset Overview
US30 (Dow Jones Industrial Average) - CFD Index
Trade Type: Swing/Day Trade
Bias: BULLISH 🐂
🔍 The Master Plan: Double Moving Average Confirmation
We're hunting for a pullback retest at two critical moving averages acting as dynamic support:
✅ Simple Moving Average (SMA) alignment
✅ Kijun-Sen (Ichimoku baseline) confluence
This double confirmation gives us the green light to ride the bullish trend with institutional-level precision. Think of it as the market leaving the vault door slightly open... 🚪💎
🎯 Entry Strategy: The "Thief Layering" Method
Primary Approach: Multiple Buy Limit Orders (Layering Strategy)
Recommended Layer Entry Zones:
🟢 Layer 1: 46,000
🟢 Layer 2: 46,200
🟢 Layer 3: 46,400
💡 Pro Tip: You can add more layers based on your risk appetite and position sizing. This strategy allows you to average into the position as price pulls back to support—like catching falling diamonds! 💎
Alternative: Market execution at any pullback to the moving average confluence zone.
🛡️ Risk Management
Stop Loss: 45,600
⚠️ Important: This is MY stop loss level based on technical invalidation. You're the captain of your own ship—adjust according to YOUR risk tolerance and account size. Trade at your own risk!
🎯 Target Zone: The Police Barricade
Take Profit Target: 47,600 🚨
This level represents:
🚧 Strong resistance zone (the "Police Barricade")
📈 Potential overbought conditions
Bull trap territory
Strategy: Scale out or secure profits as we approach this level. Remember: realized profits are better than paper gains!
⚠️ Reminder: This is MY take profit target. Your exit strategy should align with your trading plan and risk management rules. Lock in profits when YOU'RE comfortable!
🌐 Correlated Assets to Watch
Keep an eye on these related instruments for confluence:
SP:SPX (S&P 500): Broad market sentiment indicator—if SPX shows strength, US30 typically follows
SEED_ALEXDRAYM_SHORTINTEREST2:NQ (Nasdaq 100): Tech-heavy index correlation—risk-on appetite confirmation
TVC:DXY (US Dollar Index): Inverse correlation—weaker dollar often supports equity indices
TVC:TNX (10-Year Treasury Yield): Rate sensitivity—lower yields can fuel equity rallies
TVC:VIX (Volatility Index): Fear gauge—declining VIX supports bullish setups
Key Correlation Note: When these indices move in harmony with declining dollar strength, it strengthens the bullish case for US30. Watch for synchronized moves!
📝 Technical Summary
Trend: Bullish structure intact
Confirmation: Dual moving average support
Risk/Reward: Favorable with 400-1,600 point profit potential (depending on entry layer)
Time Frame: Swing to day trade duration
Strategy Style: "Thief layering" - accumulate on pullbacks
✨ If you find value in my analysis, a 👍 and 🚀 boost is much appreciated — it helps me share more setups with the community!
⚠️ Disclaimer
This "Thief Style" trading strategy is shared for educational and entertainment purposes only. This is NOT financial advice. Trading involves substantial risk of loss. Always conduct your own analysis, manage your risk appropriately, and never trade with money you cannot afford to lose. Past performance does not guarantee future results. You are solely responsible for your trading decisions.
#US30 #DowJones #SwingTrading #DayTrading #TechnicalAnalysis #MovingAverages #LayeringStrategy #IndexTrading #BullishSetup #TradingStrategy #CFDTrading #PriceAction #SupportAndResistance #TradingIdeas #MarketAnalysis #ThiefStyle

US30 Technical Breakdown – 10/20/2025📍 US30 Technical Breakdown – 10/20/2025
US30 continues to range between key zones as bulls defend the 46,200 level but face heavy rejection pressure near 46,420–46,680 ⚔️. The market’s coiling up again — a decisive breakout is coming soon! ⚡️
📊 Market Behavior:
🔹 Buyers protecting 46,200 zone for the 3rd time
🔹 Price consolidating under resistance
🔹 EMAs tightening — potential volatility ahead
📌 Key Levels:
🔹 Resistance Zones:
46,425 → intraday resistance
46,632 → short-term breakout point
46,680 → key reaction zone
46,893 → upper target 🎯
🔹 Support Zones:
46,247 → EMA dynamic support
46,100 → short-term floor
45,550 → strong demand area
45,320 → higher-timeframe key support
🧠 Bias:
Neutral–Bullish 🟢
➡️ Above 46,680 → bullish momentum toward 46,900+
⬅️ Below 46,100 → sellers regain control

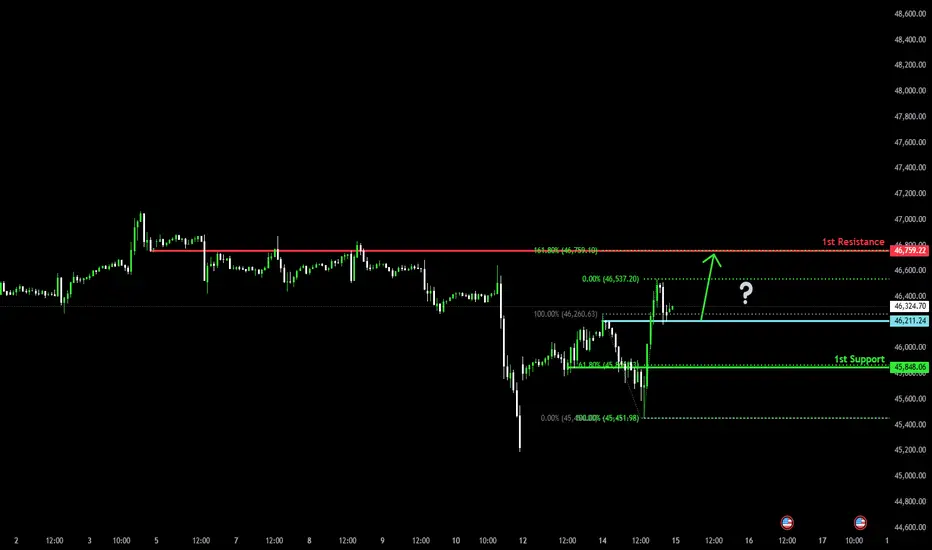
Bullish momentum to extend?Dow Jones (US30) is reacting off the pivot, which acts as a pullback support and could rise to the 1st resistance that aligns with the 161.8% Fibonacci extension.
Pivot: 46,211.24
1st Support: 45,848.06
1st Resistance: 45,759.22
Disclaimer:
The above opinions given constitute general market commentary, and do not constitute the opinion or advice of IC Markets or any form of personal or investment advice.
Any opinions, news, research, analyses, prices, other information, or links to third-party sites contained on this website are provided on an "as-is" basis, are intended only to be informative, is not an advice nor a recommendation, nor research, or a record of our trading prices, or an offer of, or solicitation for a transaction in any financial instrument and thus should not be treated as such. The information provided does not involve any specific investment objectives, financial situation and needs of any specific person who may receive it. Please be aware, that past performance is not a reliable indicator of future performance and/or results. Past Performance or Forward-looking scenarios based upon the reasonable beliefs of the third-party provider are not a guarantee of future performance. Actual results may differ materially from those anticipated in forward-looking or past performance statements. IC Markets makes no representation or warranty and assumes no liability as to the accuracy or completeness of the information provided, nor any loss arising from any investment based on a recommendation, forecast or any information supplied by any third-party.
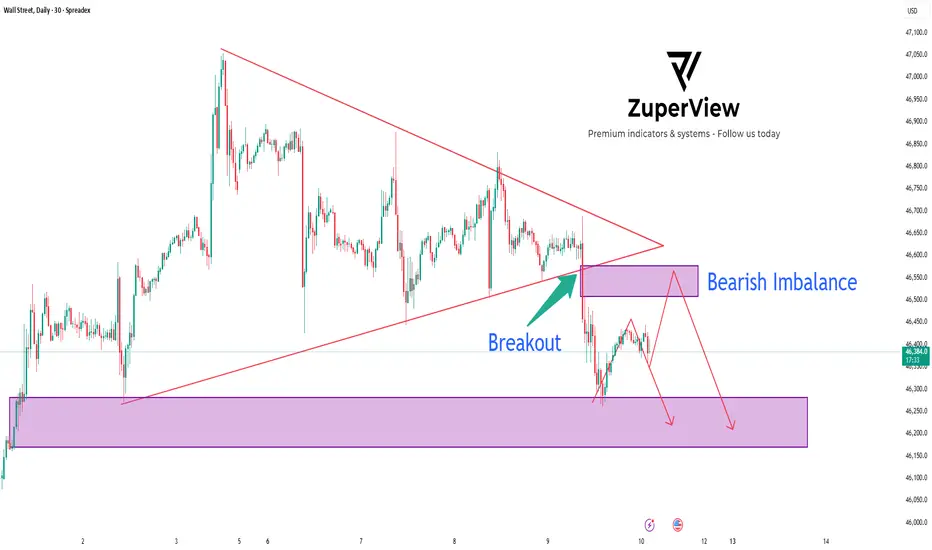
US30: Triangle breakout signal deeper sell move
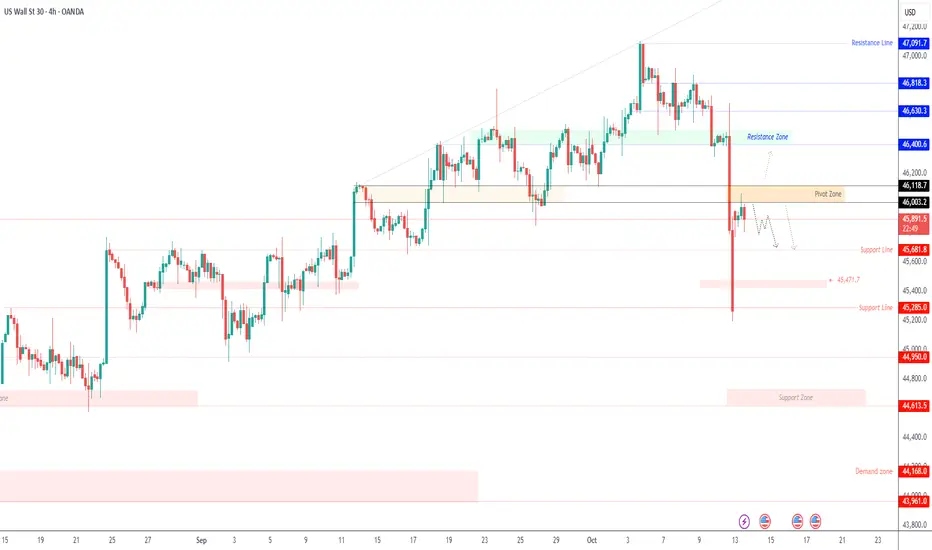
📉 US30 Analysis: 4-Layer Resistance, Bearish Imbalance & Triangle Breakout | TradingView
The SPREADEX:DJI just printed a clean bearish breakout from a symmetrical triangle pattern on the 30-minute chart 🕒.
What makes this setup stand out is the 4-layer resistance zone perfectly overlapping with a Bearish Imbalance, creating a strong confluence for a potential continuation to the downside.
________________________________________
🧠 Technical Overview
On TradingView, the chart shows multiple lower highs forming inside a symmetrical triangle — a sign of buying exhaustion and seller accumulation. After several attempts, price finally broke below the structure, confirming a bearish market shift.
Key zones:
🔴 4-Layer Resistance: 46,850 → 46,550
⚫ Bearish Imbalance: 46,500 – 46,550
🟣 Demand Zone / Support: 46,150 – 46,250
Each resistance layer acted as a rejection point, showing how Smart Money continues to distribute orders and defend that area aggressively.
________________________________________
📊 Breakout – Retest – Continuation Setup
Following the breakout, price made a quick pullback to retest the 4-layer resistance zone — right where the Bearish Imbalance sits.
This is a textbook Breakout–Retest–Continuation pattern on TradingView, confirming that sellers are still in control.
1️⃣ Breakout: Price breaks below the triangle.
2️⃣ Retest: Price retraces to test the 4-layer resistance and imbalance.
3️⃣ Continuation: Strong rejection signals the next bearish leg.
________________________________________
💡 Trading Plan
Our trading plan for this setup is straightforward. I’m waiting for price to retest the 46,500–46,550 zone and show clear signs of rejection — such as a bearish engulfing candle or a break of structure on lower timeframes.
If confirmed, I’ll look to enter a short position targeting the Demand Zone around 46,150–46,250.
A stop loss would be placed just above 46,650, beyond the resistance cluster, to protect against false breakouts.
This plan aligns perfectly with Smart Money Concept (SMC) and Price Action trading, offering a strong risk-to-reward ratio 📈.
________________________________________
🧩 Market Psychology
✅ The four consecutive rejections at the same price zone clearly show how institutional traders are defending supply levels.
✅ Every time price pushes higher, Smart Money sells into liquidity, leaving wicks and imbalances behind.
✅ This behavior reinforces the bearish bias and supports the idea of a continued drop once short-term liquidity is collected.
________________________________________
🔎 Summary
✅ Bearish breakout confirmed from the triangle pattern
🔴 Strong 4-layer resistance overlapping with Bearish Imbalance
📉 Expecting price to continue toward the lower Demand Zone
This setup is clean, confluence-rich, and ideal for traders using TradingView, Price Action, and Smart Money Concepts.
A well-timed short from this zone could deliver a high-probability trade with excellent structure confirmation 🔥.
Please like and comment below to support our traders. Your reactions will motivate us to do more analysis in the future 🙏✨
Harry Andrew @ ZuperView

DJI : Remember what I wrote on 26/11/2024Long ago, I put up this chart.
Thanks to Trump, it is finally a reality.
Price has nowhere else to go but DOWN.
This is the kind of MONEY you can make by being patient.
Good luck.
US30The Dow looks fragile. After running hard, momentum is slowing. It’s bumping into resistance zones while technicals suggest a pullback may be looming. If key support breaks, we could see a sharp slide.
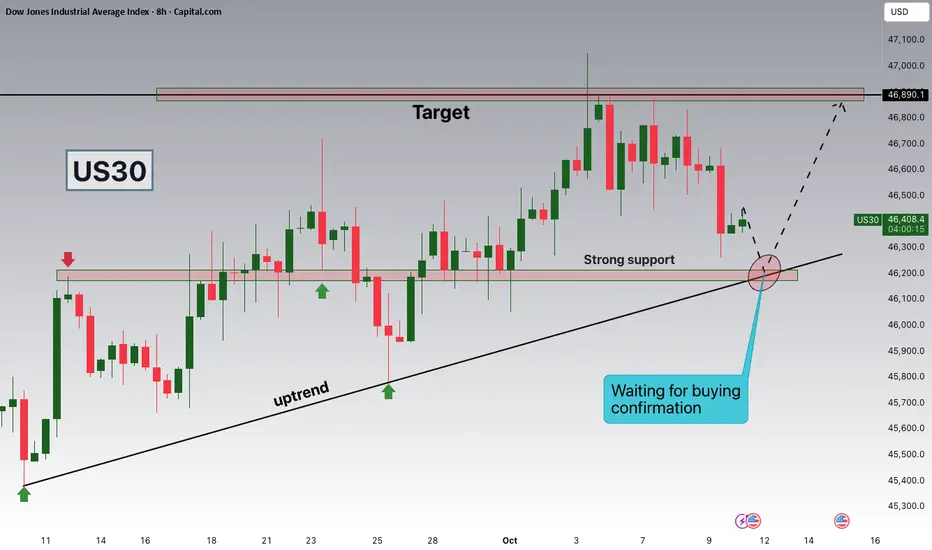
US30 Eyes 46,200 Support as Bulls Prepare for Next Leg Higher!Hey Traders,
In today’s session, we’re monitoring US30 for a potential buying opportunity around the 46,200 zone. The Dow Jones remains within a clear uptrend, and price is currently in a healthy correction phase, approaching a key confluence of support and trendline structure near 46,200.
A sustained reaction from this level could signal a continuation of bullish momentum in the broader equity market.
Trade safe,
Joe.
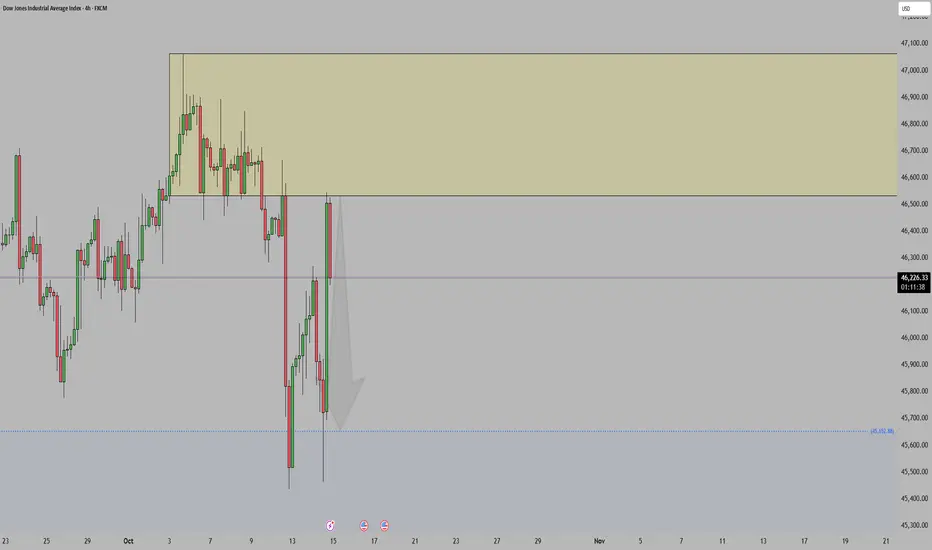
US30 - Futures Rebound as Trump Calms U.S.–China Trade TensionsUS30 – Overview | Futures Rise as Trump Softens Tone on China
U.S. stock index futures advanced Monday, recovering from Friday’s pullback, as investors shifted back to risk assets following President Donald Trump’s softer stance on China.
Trump signaled a more measured approach, easing concerns over trade escalation after previously announcing steep tariffs and export restrictions tied to rare earth controls.
Market sentiment improved modestly, though caution remains as investors await further clarity on policy direction and upcoming U.S. data.
Technical Outlook
The Dow Jones maintains a bearish bias while trading below the pivot zone at 46,000.
As long as the price holds under this level, momentum favors downside toward 45,680 → 45,470, with increased pressure if a 1H candle closes below 45,680.
A 1H close above 46,120 would shift sentiment to bullish, targeting 46,400 → 46,630, potentially confirming a short-term reversal.
Pivot Line: 45,920
Resistance: 46,120 · 46,400 · 46,630
Support: 45,680 · 45,500 · 45,285
Summary:
US30 remains bearish below 46,000, with a possible retest of key supports at 45,680–45,470.
A break above 46,120 would invalidate the bearish view and open the way for a recovery toward 46,400.
US30 / Overview | Bearish Pressure Below 46,000US30 – Overview | Bearish Momentum
The price retested its resistance zone and then reversed into bearish momentum.
As long as the index trades below 46,000, the bearish trend is expected to continue toward 45,690, and a 1H close below this level would extend losses toward 45,470.
To shift into a bullish trend, price must close a 1H candle above 46,000, which would open the way toward 46,120 → 46,250.
Pivot: 46,000
Support: 45,680 – 45,470 – 45,280
Resistance: 46,120 – 46,250 – 46,400

Us30US30 have had a drop last week due to tariff news, if we don't open with the gap then we will push up otherwise further drop can happen.
Disclosure: We are part of Trade Nation's Influencer program and receive a monthly fee for using their TradingView charts in our analysis.

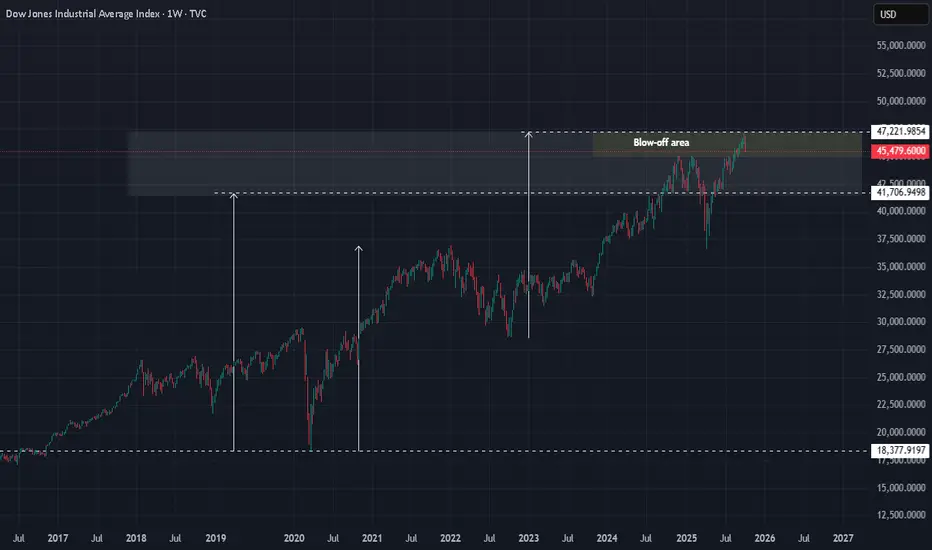
The ugliest crash in our history close? I truly believe with western powers developing digital IDs and other technology, etc. to monitor and control the public... and in some cases replace the human race... it's in line with what I believe will be one of the biggest market crashes in human history, equal or bigger to 1929.
GET READY.
IT WILL HAPPEN WITHIN THE BLACK ZONE.
The powers in control know!
The 2030 Agenda is prepared for this.
And they are keeping the public distracted.
History repeats!
There is a purpose to everything!

Us30 Trade Set Up Oct 15 2025Price has swept PDH and has formed a bullish 4h FVG which i am expecting price to come to 50% of it before continuing higher

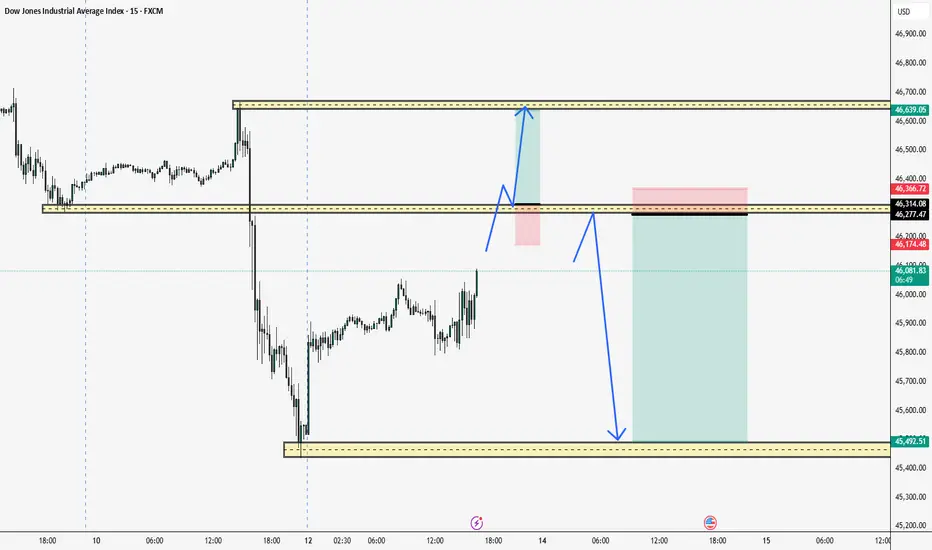
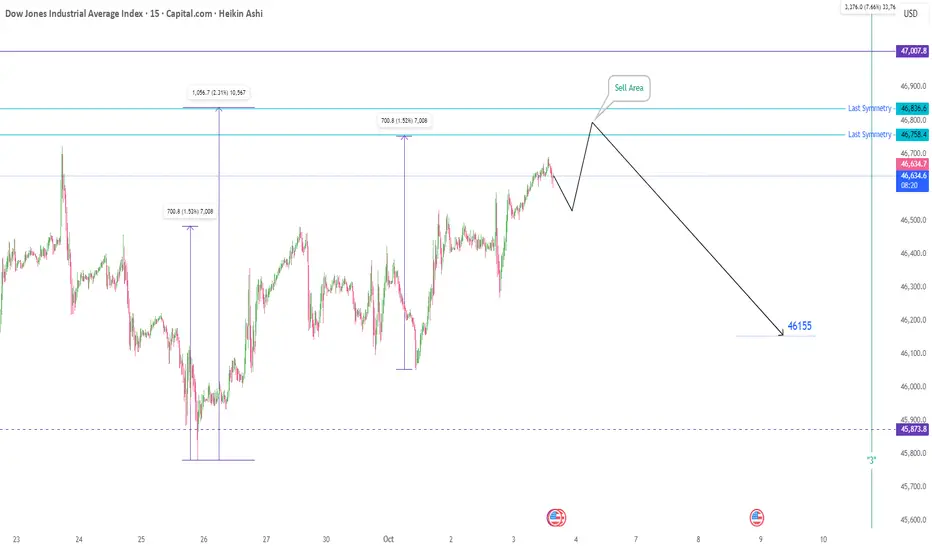
Us30 in FridayToday is Friday, the last trading day of the week. Despite the absence of major economic news releases, the following forecast for the Dow Jones Index is highly probable.
Upon market open and with an increase in trading volume, we anticipate an upward move. After registering a new price high, the index is expected to decline to approximately the 46,160 level.
Entering short positions within the specified target zone presents a favorable opportunity to capture profits. May it be profitable.
Please note: This is solely a trading idea. The responsibility for any trading decision rests entirely with the individual.
US30 Long Trade, US30 to hit 47,317CAPITALCOM:US30 Long Trade
Entry: 46,321 - 46,700
TP: 47,317
This is good trade.
Don't overload your risk like Greedy gambler!!!
Be Disciplined Trader, risk what you can afford.
Use proper risk management.
Disclaimer: Trading is risky, only idea, not advice.

DowJones retest of pivotal 46680 level? Key Support and Resistance Levels
Resistance Level 1: 46680
Resistance Level 2: 46875
Resistance Level 3: 47060
Support Level 1: 46190
Support Level 2: 45965
Support Level 3: 45700
This communication is for informational purposes only and should not be viewed as any form of recommendation as to a particular course of action or as investment advice. It is not intended as an offer or solicitation for the purchase or sale of any financial instrument or as an official confirmation of any transaction. Opinions, estimates and assumptions expressed herein are made as of the date of this communication and are subject to change without notice. This communication has been prepared based upon information, including market prices, data and other information, believed to be reliable; however, Trade Nation does not warrant its completeness or accuracy. All market prices and market data contained in or attached to this communication are indicative and subject to change without notice.
US30DJI - Dow Jones
- Bullish Channel as an corrective pattern in Long Time Frame
- Break of Structure
- Fibonacci Level - 38.20% / 50.00%
- Completed " 12345 " Impulsive Waves and " A " Corrective Waves
- Demand Zone
