US30 15M Analysis Market structure is currently bullish. I would only be interested in shorts if price closes strong below the 15M swing low. I will be monitoring lower time frame price action for confirmation if price sweeps the liquidity or tags the demand.
Trade Safe -Remzy
Market insights

Can the Dow Jones Continue Its Bullish Momentum This Week?🚀 US30/DJI Dow Jones - Bullish Pullback Opportunity 📈
Professional Market Blueprint | Swing Trade Setup
📊 TRADE OVERVIEW
Asset: US30/DJI - Dow Jones Industrial Average Index
Timeframe: Swing Trade (4H-Daily)
Bias: 🟢 BULLISH - Hull MA Pullback Strategy
Confirmation: Heikin Ashi Reversal Candle Pattern
🎯 ENTRY STRATEGY - "LAYERING METHOD" 🎯
Approach: Multiple limit orders (Professional Risk Distribution)
Layer Entry Points:
Layer 1: 46,600 🔵
Layer 2: 46,800 🔵
Layer 3: 47,000 🔵
Layer 4: 47,200 🔵
💡 Tip: Adjust additional layers based on your risk tolerance and account size
🛑 RISK MANAGEMENT
Stop Loss: 46,400
⚠️ DISCLAIMER: This is a reference level only. You manage your own risk. Adjust SL according to your strategy and risk profile.
Take Profit Target: 48,800
📌 Rationale: Moving Average resistance + Overbought zone + Trap detection
⚠️ DISCLAIMER: This is a reference level only. You manage your own risk. Take profits at your own discretion.
📈 TECHNICAL CONFLUENCE
✅ Hull Moving Average - Bullish alignment & pullback structure
✅ Heikin Ashi Reversal - Confirmation candle pattern at entry zones
✅ Moving Average Resistance - Strong rejection level near TP
✅ Overbought Divergence - Potential trap for trap traders
✅ Risk/Reward Ratio - Favorable 1:3+ setup potential
🔗 RELATED PAIRS TO WATCH - CORRELATION ANALYSIS
📍 AMEX:SPY - S&P 500 ETF (Positive Correlation - 0.92)
US30 follows broad market sentiment. SPY strength = DJI bullish momentum.
📍 NASDAQ:QQQ - Nasdaq-100 ETF (Positive Correlation - 0.85)
Tech sector performance impacts overall market. Monitor for divergence signals.
📍 AMEX:IWM - Russell 2000 (Small Cap) (Positive Correlation - 0.88)
Small-cap rotations precede index moves. Early trend confirmation signal.
📍 AMEX:GLD - Gold Spot Price (Inverse Correlation - -0.45)
Risk-on sentiment (bullish DJI) = weaker gold. Inverse hedge setup.
📍 TVC:VIX - Volatility Index (Inverse Correlation - -0.70)
Rising VIX = market fear = DJI pullback risk. Monitor at entry zones.
📍 TVC:US10Y Yield (Negative Correlation - -0.55)
Rising yields pressure equities. Check yield strength before entries.
📍 TVC:DXY - US Dollar Index (Weak Negative - -0.30)
Stronger dollar = export headwinds. Minor impact, secondary indicator.
⚡ KEY TRADING RULES
🔴 BEFORE ENTRY:
Confirm Hull MA slope is positive
Wait for Heikin Ashi reversal candle close
Check VIX & SPY alignment
Ensure no major economic events
🟢 AT ENTRY:
Use layering strategy (don't chase)
Build position gradually across 4 layers
Scale risk based on account size
Document entry price & time
🟡 DURING TRADE:
Trail stop loss after +1% profit
Monitor related pairs for divergence
Close 50% at +2% for risk-free trade
Let remainder run to target
🔵 EXIT PLAN:
Target: 48,800 (reference level)
Or: Exit on Heikin Ashi reversal signal
Or: Close on MA resistance rejection
Never hold into major news events

US30 Will Move Lower! Sell!
Here is our detailed technical review for US30.
Time Frame: 9h
Current Trend: Bearish
Sentiment: Overbought (based on 7-period RSI)
Forecast: Bearish
The market is trading around a solid horizontal structure 47,967.2.
The above observations make me that the market will inevitably achieve 46,950.2 level.
P.S
We determine oversold/overbought condition with RSI indicator.
When it drops below 30 - the market is considered to be oversold.
When it bounces above 70 - the market is considered to be overbought.
Like and subscribe and comment my ideas if you enjoy them!

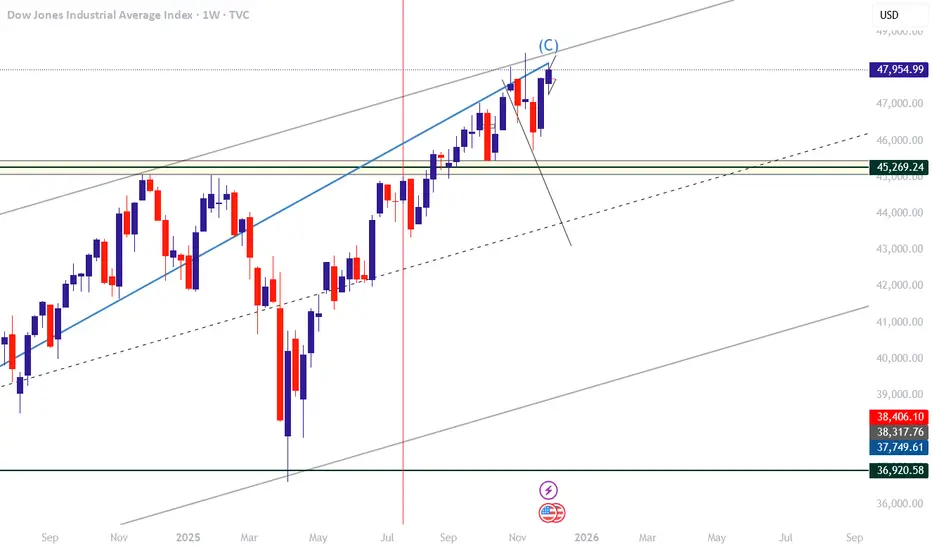
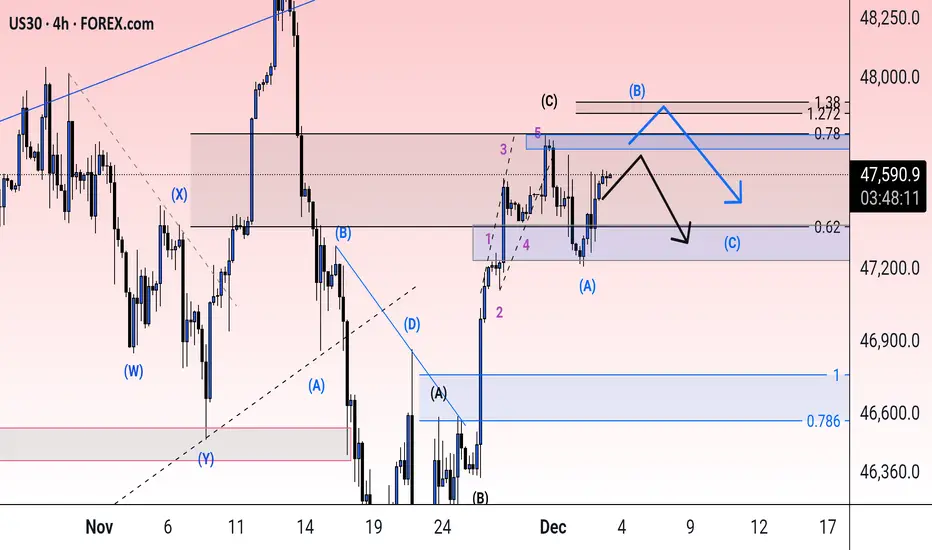
dji possible shortDow Jones appears to be completing a major corrective structure (A-B-C) and is currently testing the upper boundary of a long-term ascending channel.
The index has reached a confluence of technical exhaustion:
• Completion of wave C
• Touching the channel’s upper resistance
• Repeating the timing cycle of “impulse → correction → impulse”
• Similar time symmetry conditions seen at previous cycle tops
This alignment suggests that the current bullish cycle may be nearing its end, with the market entering a potential distribution zone.
From here, the probability of a medium-term correction — or even a deeper decline — increases significantly.
If price fails to break convincingly above the channel, the market may begin a larger bearish phase offering potential short opportunities.
Bullish continuation setup?Dow Jones (US30) is reacting off the pivot and could bounce to the 1st resistance which is a swing high resistance.
Pivot: 47,730.53
1st Support: 47,204.31
1st Resistance: 48,435.66
Disclaimer:
The opinions given above constitute general market commentary and do not constitute the opinion or advice of IC Markets or any form of personal or investment advice.
Any opinions, news, research, analyses, prices, other information, or links to third-party sites contained on this website are provided on an "as-is" basis, are intended to be informative only, and are not advice, a recommendation, research, a record of our trading prices, an offer of, or solicitation for, a transaction in any financial instrument and thus should not be treated as such. The information provided does not involve any specific investment objectives, financial situation, or needs of any specific person who may receive it. Please be aware that past performance is not a reliable indicator of future performance and/or results. Past performance or forward-looking scenarios based upon the reasonable beliefs of the third-party provider are not a guarantee of future performance. Actual results may differ materially from those anticipated in forward-looking or past performance statements. IC Markets makes no representation or warranty and assumes no liability as to the accuracy or completeness of the information provided, nor any loss arising from any investment based on a recommendation, forecast, or any information supplied by any third party.

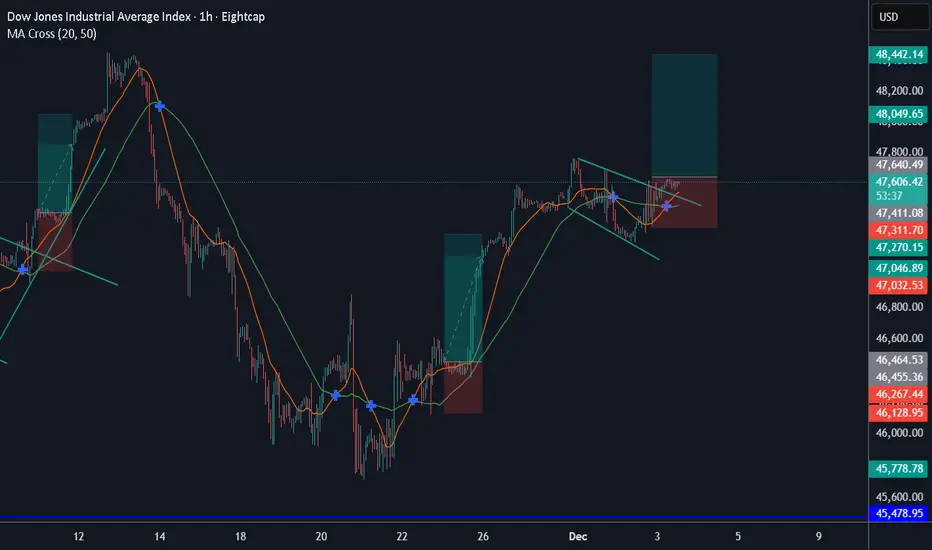
US30 BiasM & W: Uptrend, respecting the lows
D: Uptrend, price retraced 78.6%
4H: Uptrend, price made a lower low, possibly trending short
1H: Uptrend, price hit H4 resistance zone + RSI showing oversold and bearish divergence.
CURRENTLY: I'm looking for price to go short to retest H1 trendline, @previous resistance, and continue long.
IF price breaks below H1 trend, I'll look for price to continue short to previous major support area

us30Wall Street is ready to move to set a new high with a stop below the range or floor and target for the new high.

DowJones key support at 47530Key Support and Resistance Levels
Resistance Level 1: 48132
Resistance Level 2: 48276
Resistance Level 3: 48420
Support Level 1: 47530
Support Level 2: 47366
Support Level 3: 47185
This communication is for informational purposes only and should not be viewed as any form of recommendation as to a particular course of action or as investment advice. It is not intended as an offer or solicitation for the purchase or sale of any financial instrument or as an official confirmation of any transaction. Opinions, estimates and assumptions expressed herein are made as of the date of this communication and are subject to change without notice. This communication has been prepared based upon information, including market prices, data and other information, believed to be reliable; however, Trade Nation does not warrant its completeness or accuracy. All market prices and market data contained in or attached to this communication are indicative and subject to change without notice.

US30 Trade Set Up Dec 4 2025Price remains bullish so i am expecting price to sweep SSL and/or tap into 4h FVG to then look for internal 1m-5m IFVG/CISD to continue higher to PDH and higher BSL/supply

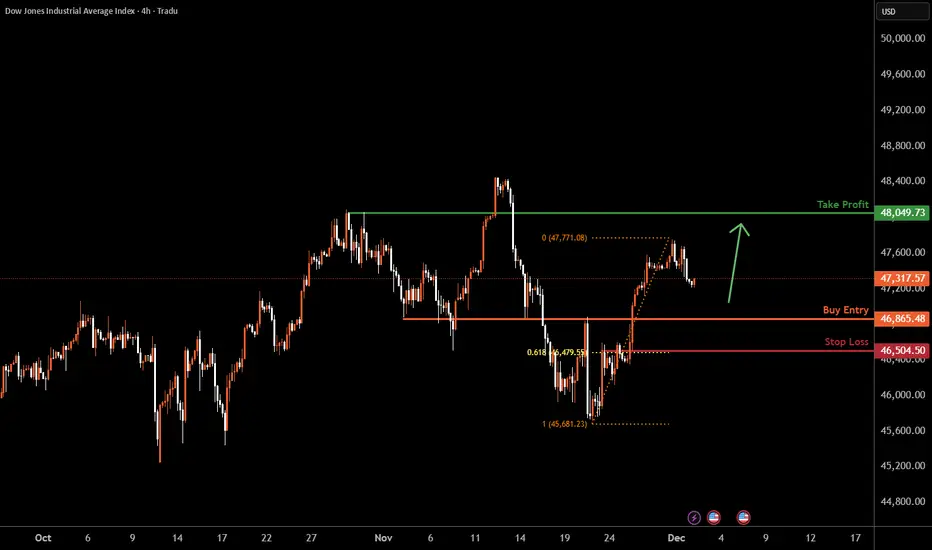
US30 H4 | Falling Towards Key SupportMomentum: Bullish
Price is pulling back toward our buy entry, which has been identified as an overlap support zone.
Buy Entry: 46,865.48
Strong overlap support
Stop Loss: 46,504.50
Pullback support
61.8% Fibonacci retracement
Take Profit: 48,049.73
Pullback resistance
High Risk Investment Warning
Stratos Markets Limited (tradu.com ), Stratos Europe Ltd (tradu.com ):
CFDs are complex instruments and come with a high risk of losing money rapidly due to leverage. 70% of retail investor accounts lose money when trading CFDs with this provider. You should consider whether you understand how CFDs work and whether you can afford to take the high risk of losing your money.
Stratos Global LLC (tradu.com ): Losses can exceed deposits.
Please be advised that the information presented on TradingView is provided to Tradu (‘Company’, ‘we’) by a third-party provider (‘TFA Global Pte Ltd’). Please be reminded that you are solely responsible for the trading decisions on your account. Any information and/or content is intended entirely for research, educational and informational purposes only and does not constitute investment or consultation advice or investment strategy. The information is not tailored to the investment needs of any specific person and therefore does not involve a consideration of any of the investment objectives, financial situation or needs of any viewer that may receive it. Past performance is not a reliable indicator of future results. Actual results may differ materially from those anticipated in forward-looking or past performance statements. We assume no liability as to the accuracy or completeness of any of the information and/or content provided herein and the Company cannot be held responsible for any omission, mistake nor for any loss or damage including without limitation to any loss of profit which may arise from reliance on any information supplied by TFA Global Pte Ltd.

US30 - LongUS30 is on upward trend and is trading in the upward channel. Long it if it breaks above 48 on 5 min candle and do not break its low in the next candle. Crucial levels 48 and on downside 47.87.
Take trades on your own risk.

DowJones (DJI) IntraSwing & Future Level: 03rd - 04th Dec 2025DowJones (DJI) IntraSwing & Future Level: 03rd Dec - 04th Dec 2025 (2:30 am)
✍🏼️ "Future IntraSwing Levels" mentioned in BOX format.
[ Level Interpretation / description:
L#1: If the candle crossed & stays above the “Buy Gen”, it is treated / considered as Bullish bias.
L#2: Possibility / Probability of REVERSAL near RLB#1 & UBTgt
L#3: If the candle stays above “Sell Gen” but below “Buy Gen”, it is treated / considered as Sidewise. Aggressive Traders can take Long position near “Sell Gen” either retesting or crossed from Below & vice-versa i.e. can take Short position near “Buy Gen” either retesting or crossed downward from Above.
L#4: If the candle crossed & stays below the “Sell Gen”, it is treated / considered a Bearish bias.
L#5: Possibility / Probability of REVERSAL near RLS#1 & USTgt
HZB (Buy side) & HZS (Sell side) => Hurdle Zone,
*** Specialty of “HZB#1, HZB#2 HZS#1 & HZS#2” is Sidewise (behaviour in Nature)
Rest Plotted and Mentioned on Chart
Color code Used:
Green =. Positive bias.
Red =. Negative bias.
RED in Between Green means Trend Finder / Momentum Change
/ CYCLE Change and Vice Versa.
Notice One thing: HOW LEVELS are Working.
Use any Momentum Indicator / Oscillator or as you "USED to" to Take entry.
⚠️ DISCLAIMER:
The information, views, and ideas shared here are purely for educational and informational purposes only. They are not intended as investment advice or a recommendation to buy, sell, or hold any financial instruments. I am not a SEBI-registered financial adviser.
Trading and investing in the stock market involves risk, and you should do your own research and analysis. You are solely responsible for any decisions made based on this research.
"As HARD EARNED MONEY IS YOUR's, So DECISION SHOULD HAVE TO BE YOUR's".
Do comment if Helpful .

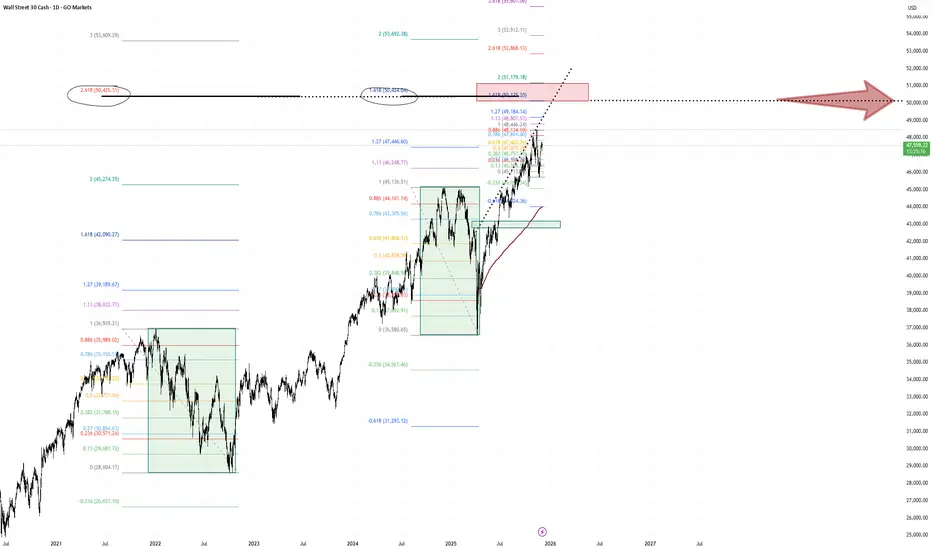
US 30 heading towards possible correction ?Hi Guys,
The US indices all bounced after undercutting daily lows and perhaps trapping some short sellers who had taken the undercut as a break of a H & S pattern that was taking shape. A significant rally has ensued from the current low and the US 30 is heading towards an area that may see some resistance, perhaps enough to warrant a major correction.
The red box on the chart is that area and there is good confluence to make it a possible trading zone to keep an eye on.
Firstly the fib retracement of the bear market high to low of 2.618 lands precisely within that area as does the 1.618 retrace of the tarrif correction from early this year. These are two significant fib measurements of two important events landing at precisely same location. The most recent daily high to low also has its 1.618 and 2.0 retrace land in that area (the former being the bottom of the red box, the latter being top of the red box.
Secondly what makes these measurements that much more important is that they both land at the 50000 mark. No need to say much more about this number being a highly likely trading zone.
Lastly there is an upper resistance trend line that the dow has had a few good reactions from which also leads into the mentioned area.
All in all there is good reason to suggest that we may get some good trading opportunities if the dow does reach the 50000 + mark.
Low risk high reward trades using lower time frames and chart pattern, candlestick patter, price could result in profitable trades . patience and sticking to whatever rules conditions that are set for your trading style/ strategy will be key.
Safe Trading all
Falling wedgeThe price has made a falling wedge pattern followed by a breakout and retest, now the price looks to make a higher high and continue long
WE ONLY TRADE PULLBACKS
Comment your thoughts
DowJones resistance retest at 47548Key Support and Resistance Levels
Resistance Level 1: 47648
Resistance Level 2: 47830
Resistance Level 3: 48000
Support Level 1: 47130
Support Level 2: 47000
Support Level 3: 46867
This communication is for informational purposes only and should not be viewed as any form of recommendation as to a particular course of action or as investment advice. It is not intended as an offer or solicitation for the purchase or sale of any financial instrument or as an official confirmation of any transaction. Opinions, estimates and assumptions expressed herein are made as of the date of this communication and are subject to change without notice. This communication has been prepared based upon information, including market prices, data and other information, believed to be reliable; however, Trade Nation does not warrant its completeness or accuracy. All market prices and market data contained in or attached to this communication are indicative and subject to change without notice.

Check the trend Given the completion of the recent bullish wave, the current corrective trend is expected to continue along the indicated paths. If the index breaks through the resistance area, the blue path will be the alternative scenario.
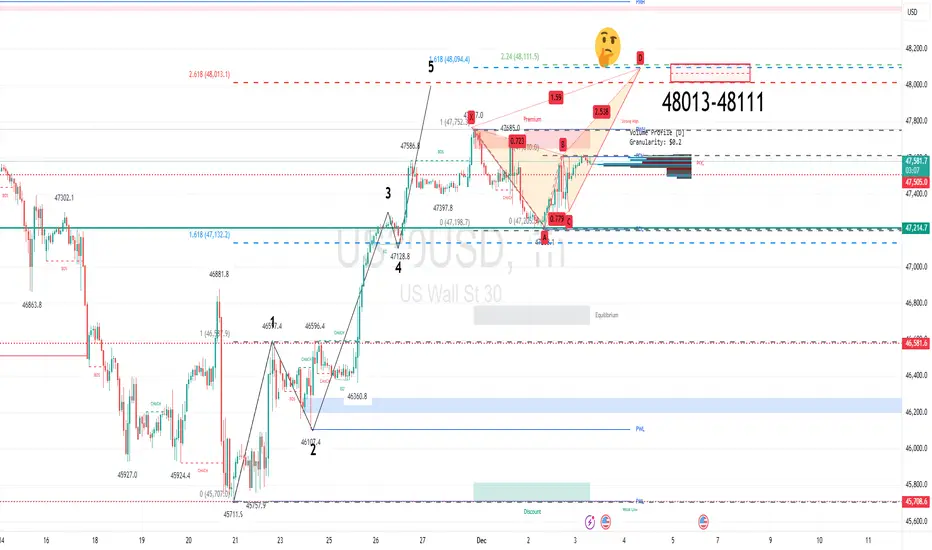
Dow Jones (US30) grinds higher within the choppy 5th wave
We have seen mixed price action for the last four days, with rallies finding sellers and dips finding buyers
The intraday chart highlights a 261.8% extension level at 48,013. A move to this zone would be analysed as the completion of a bullish 5 Wave count (Elliott Wave).
The current mixed daily results look to be forming a Crab pattern. That will be completed on a move to 48,111.
Conclusion: the medium-term bias is bearish. The preferred stance would be to sell into rallies within the 48,013-48,111 zone.
Us30 On the daily, the previous day candlestick closed below a major key level 47500.
What do u think the directional bias be for today (Daily & 4 TF)

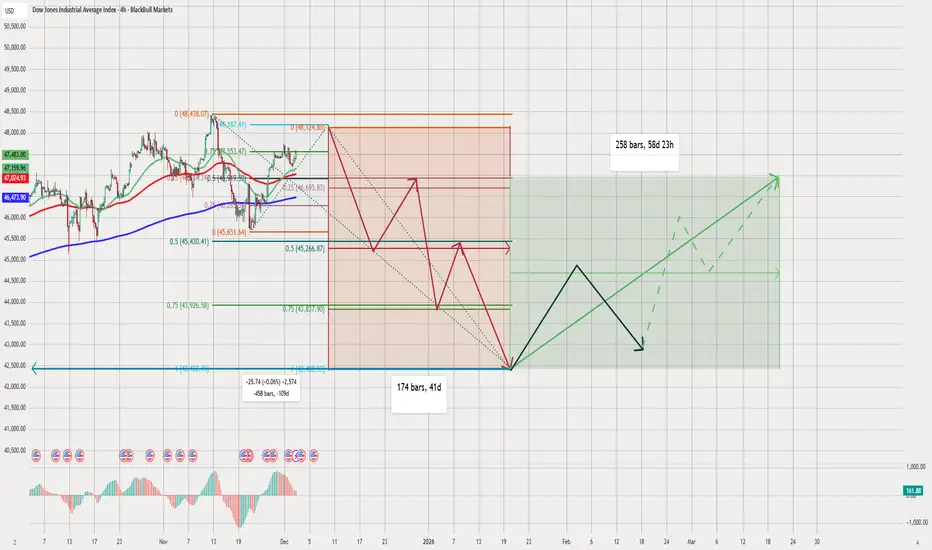
US30 SELL 4HUS30 (Dow Jones) Technical Analysis – 4H Chart
chart shows a well-structured bearish scenario, followed by a medium-term bullish reversal setup. combining Fibonacci retracement levels, time cycles, moving averages, and projected wave paths to map the market direction.
Below is a detailed breakdown:
1️⃣ Current Market Structure
Price recently reached a local top near 48,127.
After this, the chart suggests expect a significant downward correction.
Price is fluctuating above the:
Green MA (short-term)
Red MA (medium-term)
Blue 200 MA (long-term)
projected path shows a breakdown below these moving averages soon.
2️⃣ Fibonacci Levels (Important Zones)
From the recent high, your Fibonacci retracement levels are:
0.25 → 46,699
0.5 → 45,274
0.75 → 43,950
These levels align with your expected downward waves.
Major Support Zone
Large green zone near 41,700 – 42,200
This is where your final bearish wave ends
It also overlaps with a long-term Fibonacci cluster
This suggests it is the target bottom of the correction.
3️⃣ Bearish Projection (Red Wave Path)
chart shows multiple downward swings:
Initial drop from 48,127 → 45,274
Bounce to retest resistance
Deeper decline toward 44,000 – 43,500
Another bounce
Final capitulation to 41,700
🟥 Final Bearish Target:
~41,700
This matches the blue horizontal support line.
🔹 Duration of Bearish Cycle
174 bars (~41 days)
This suggests the decline completes around late January 2026.
4️⃣ Bullish Reversal Phase (Green + Black Path)
After reaching the bottom around 41,700, your chart shows two phases:
Phase 1 – Strong Rebound (Black Path)
A sharp rally into early February:
First rally to around 44,500 – 45,000
Short-term pullback
Then continuation higher
Phase 2 – Trend Recovery (Green Path)
Long-term green path shows:
A steady upward channel
Price aiming toward 48,000 – 49,000 again
The green dotted lines show alternative bullish scenarios
🔹 Total Recovery Time
258 bars (~58 days)
Targeting mid-March 2026 for a full recovery.
5️⃣ Interpretation of Moving Averages
Price will break below the moving averages during the correction.
Long-term recovery will push back above the:
50 MA (green)
100 MA (red)
200 MA (blue)
This confirms a trend reversal after the bottom is hit.
6️⃣ Summary of Your Outlook
📉 Short-Term Bias: Bearish
Price expected to drop from the top
Multiple lower highs / lower lows
Target bottom: 41,700
📉 Medium-Term Bias: Consolidation & Reversal
Strong bounce after the bottom
Wave structure suggests accumulation
📈 Long-Term Bias: Bullish
Recovery back toward all-time highs
Market structure returns to an uptrend by March 2026
✔️ Final Conclusion
chart suggests a full cycle:
Top formation near 48,127
Multi-wave decline (target 41,700)
41-day bearish cycle
Strong bullish reversal
Full recovery within ~58 days
This is a very clean Elliott-wave-style projection supported by Fibonacci and time cycles.
Us30📊 Key Information and Analysis
Based on the image, here is a breakdown of the information and the potential trade setup:
Instrument: US Wall St 30 (represented as US30USD). This typically tracks the performance of the Dow Jones Industrial Average (DJIA) index.
Timeframe: 1h (1-hour), meaning each candlestick represents one hour of trading.
Current Price: Approximately 47,538.2.
Price Change: The index is up $227.6 or +0.48% for the period shown.
Pending Trade Setup: There appears to be a Buy Limit or Market Execution Buy setup indicated by the blue and red zones.

Dow Jones Attempts to Reach New HighsThe index has managed to maintain a gain of more than 2% over the past six trading sessions, attempting once again to approach its historical highs as the market holds a consistent short-term bullish bias. For now, buying pressure has remained supported by a temporary rebound in market confidence, driven by expectations of lower interest rates from the Federal Reserve next week. If this improvement in confidence continues, current buying pressure could remain dominant in the sessions ahead.
Uptrend Line Remains Relevant
The long-term upward trendline visible in the Dow Jones has continued to hold despite recent fluctuations, and so far, no meaningful bearish correction has emerged to threaten its structure in the short term. As a result, it remains the most important technical factor to watch, especially if price manages to reach the previous high zone again, which would confirm a dominant bullish bias heading into year-end.
RSI
The RSI continues to fluctuate slightly above the neutral 50 level, suggesting that average buying momentum over the last 14 sessions remains dominant. If the RSI line continues to show steady growth, buying pressure could strengthen further.
MACD
The MACD remains very close to the neutral zero line, reflecting a sense of neutrality in the strength of short-term moving averages. Although there is buying pressure in the Dow Jones, the lack of a clear recovery in the histogram may lead to a period of consistent indecision, producing narrow-range candles and signaling a possible pause in the bullish momentum.
Key Levels to Watch:
48,248 points – Major resistance
This level corresponds to the historical highs and remains the most important bullish barrier. Buying movements approaching this zone could reactivate a strong bullish bias and extend the current upward trendline.
46,821 points – Nearby barrier
A level aligned with the 50-period simple moving average. It may serve as a key area to monitor in case of potential short-term bearish corrections.
45,677 points – Primary support
This level corresponds to the recent lows. If price approaches this zone again through bearish movements, it could signal the end of the current uptrend and open the door to a more meaningful bearish bias in the short term.
Written by Julian Pineda, CFA, CMT – Market Analyst

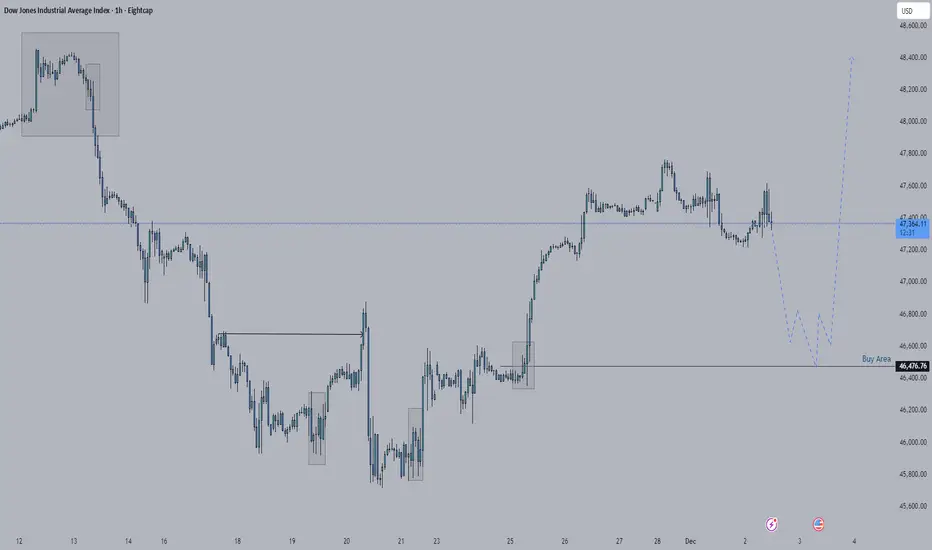
US30 Bullish AnalysisThis upcoming days US30 is going short, but I have an area I'm watching for buy. In daily tf the short movement that the market is currently doing right now is just a retest for it to go buy.