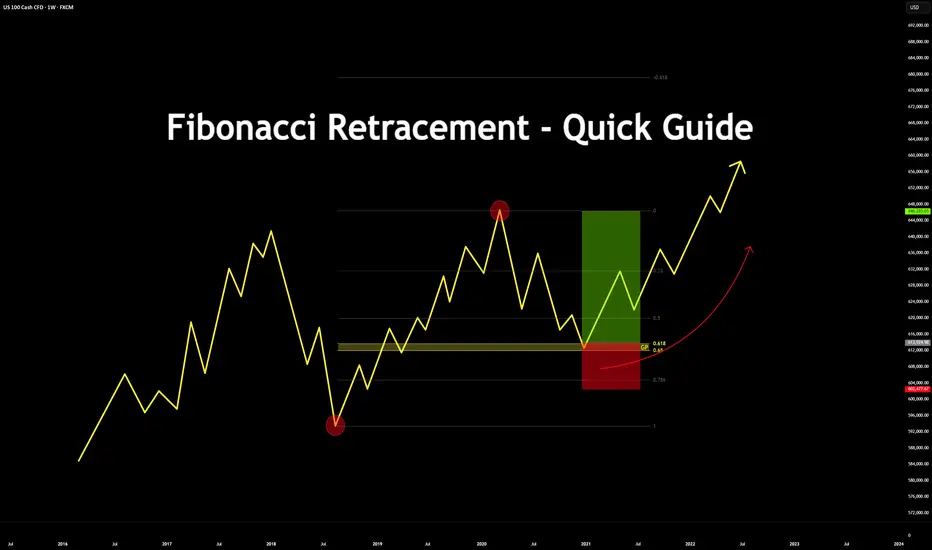
Fibonacci Retracement - Quick Guide in 5 StepsTrading the Fibonacci Retracement - Quick Guide in 5 Steps.
What is the Fibonacci tool?
The Fib Retracement Tool is a tool used widely across many charts. From crypto to stocks.
It assists in identifying the Golden Pocket, along with any potential Support and Resistance zones based on the sequence
About US 100 Cash CFD
The NASDAQ-100 is an index that is constituted by 100 of the largest companies listed on the NASDAQ stock exchange, which is the second largest in the world only after the New York Stock Exchange by market capitalization. The companies that are listed in this index range from a variety of industries like Technology, Telecommunications, Biotechnology, Media, and Services. The NASDAQ-100 was first calculated in January 31 of 1985 by NASDAQ and it is a modified capitalization-weighted index. This index has been of good reference to investors that want to know how the stock market is performing without financial services companies, this given that the index excludes financial companies.
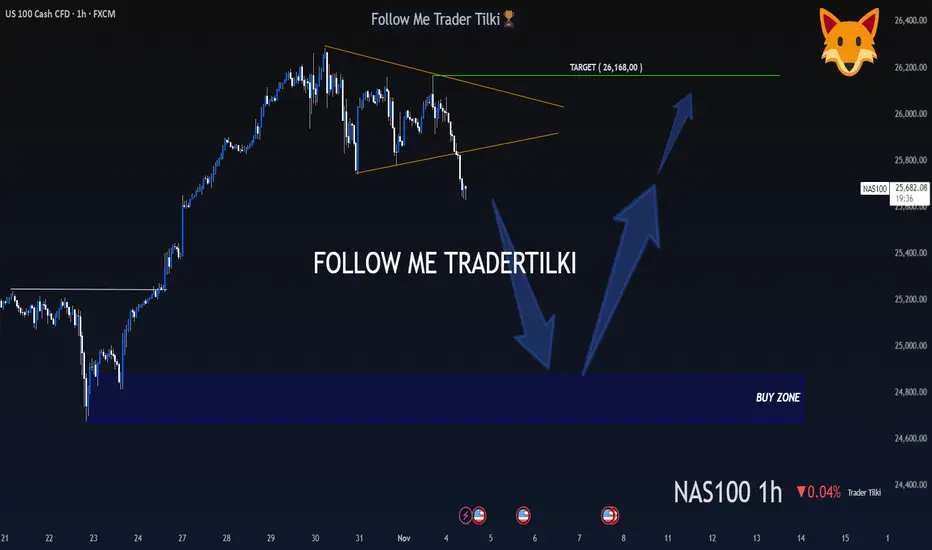
A Hunter Waits Patiently, Then Strikes Like a Lion - US100 - 1HMy dear friends, greetings,
My friends, I have set the buy levels for US100 at 24,872 and 24,677.
I will never enter a trade or put myself at unnecessary risk before these levels are reached.
My friends, in order to consistently win in this market and to become a successful trader, patience is es
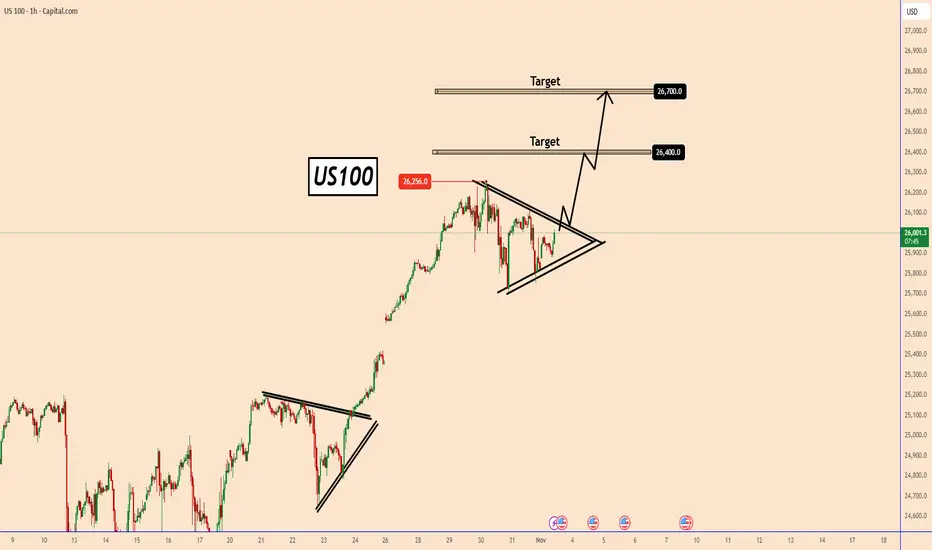
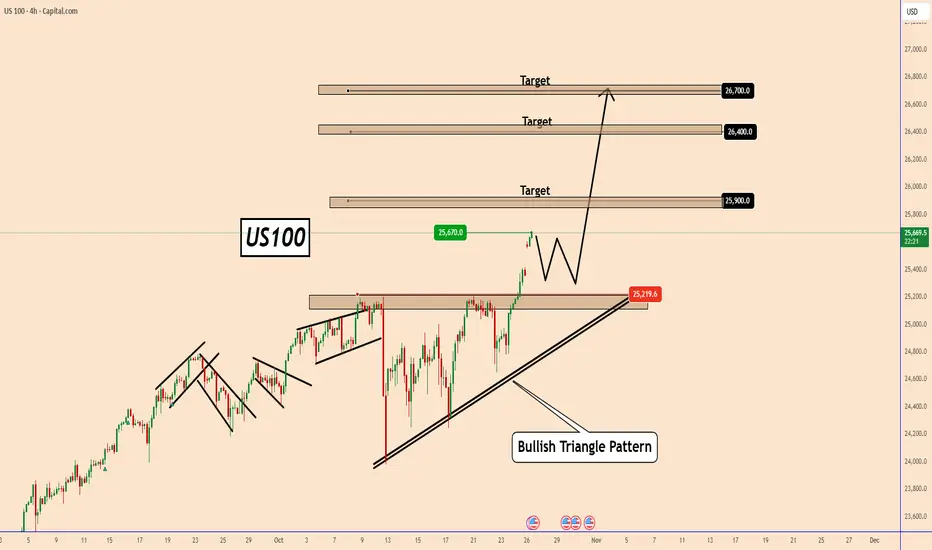
US100 is in a strong uptrend and continues to set new highsUS100 is in a strong uptrend and continues to set new highs.
An all-time high was set last week near 26256, and there is a good chance that US100 will continue to rise.
The price is rallying again and once it moves above the triangle, another uptrend could begin.
Comments from the FED that they
USNAS100 | Bearish Bias Holds Below 26,180 Ahead of Key DataUSNAS100 – MARKET OUTLOOK | Testing Pivot Zone, Awaiting Breakout 🇺🇸
The NASDAQ 100 is testing the pivot zone at 26,095–26,180, with momentum still bearish as long as it trades below this range.
🔽 Below 26,180: Bearish bias toward 25,890 → 25,700 → 25,340.
🔼 Above 26,180: Bullish reversal toward 2

US100 Technical Analysis! BUY!
My dear friends,
US100 looks like it will make a good move, and here are the details:
The market is trading on 25826 pivot level.
Bias - Bullish
Technical Indicators: Supper Trend generates a clear long signal while Pivot Point HL is currently determining the overall Bullish trend of the marke

US100 Breaks Out as Trade Optimism and Fed Expectations Fuel MomUS100 Breaks Out as Trade Optimism and Fed Expectations Fuel Momentum
Over the weekend, US President Donald Trump said that the US and China will reach a deal.
US President Donald Trump said that the US and China are ready to "reach" a trade deal, as he is expected to meet with Chinese President
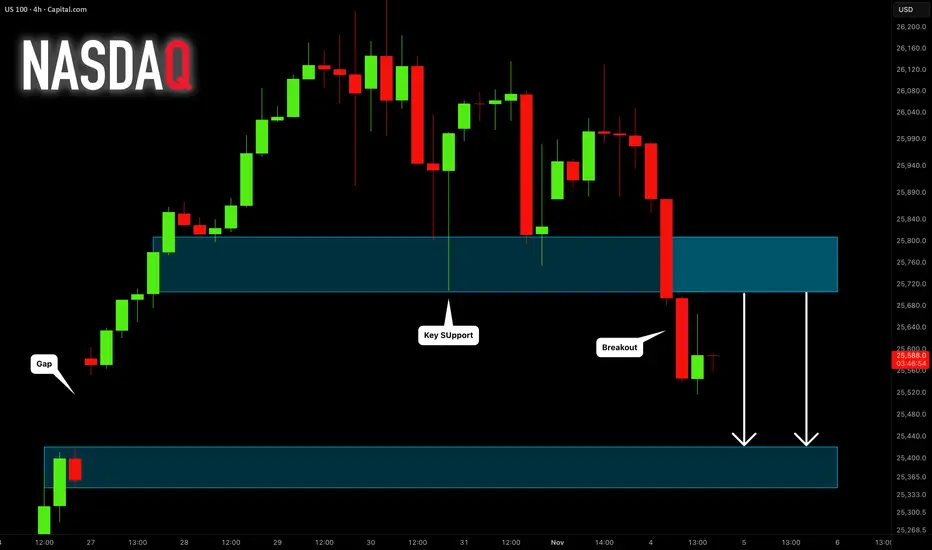
NASDAQ INDEX (US100): Forgotten Gap
A week ago, US100 formed a gap up opening.
It looks like the index is finally ready to fill it.
A breakout of a major horizontal support is a strong bearish signal.
Expect a bearish continuation to 25420.
❤️Please, support my work with like, thank you!❤️
I am part of Trade Nation's Influence
US100 Price is near a strong selling zone.
I expect a possible rejection from this level.
Targets are shown in the attached analysis.
This is not financial advice, just personal analysis.

NDQShift prediction to the right.
Global market cooler anticipated. Crypto should be hit the hardest and fastest.
Most anticipating rally continuation like post-COVID...
I think that will cause a surprise.

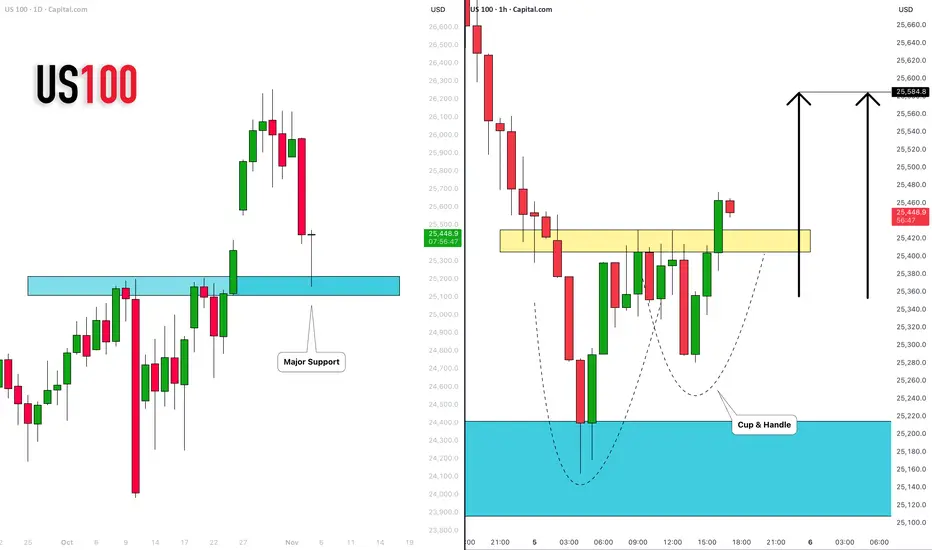
NASDAQ INDEX (US100): Time to Recover
US100 index dropped yesterday, as I predicted.
The market is recovering now, after a test of a major daily support cluster.
A formation of a cup & handle pattern on that and a breakout of its neckline
indicate a strong buying pressure.
With a high probability, the market will rise and reach 25
See all ideas
Displays a symbol's price movements over previous years to identify recurring trends.