Nasdaq Outlook: 25,800 Resistance, FOMC, and HolidaysNasdaq redirected gains back toward the 25,800 mark, a level that could confirm another surge to record highs above 26,300, or signal extended consolidation depending on the upcoming FOMC tone and ongoing concerns around tech sector overvaluation.
On the daily time frame, Nasdaq is hovering just below 25,800 resistance — the final barrier before retesting the 26,300 record high. A breakout above that level could unlock upside targets of 27,000 and 27,700.
However:
• If prices fail to hold and bearish sentiment emerges, a drop back below 25,200 is expected to extend declines toward 24,800, 24,400, and 23,900.
• The 23,900 level also acts as a potential double top neckline if prices pull back again from the 26,000 zone. A clean break below 23,900 would confirm a double-top formation, targeting 23,500 and 22,900.
These levels are derived using the Fibonacci extension tool based on the 2025 peak, the 23,900 low, and the 25,800 high.
While individual charts suggest consolidation risks, the divergence between gold and silver, alongside the contracting price action in the Dow Jones since 2020, adds caution regarding further highs until clear confirmations emerge.
- Razan Hilal, CMT
Trade ideas

Chasing the last train: how late entries ruin good trendsChasing the last train: how late entries ruin good trends
The picture is familiar.
The asset has already made a strong move, candles line up in one direction, chats are full of profit screenshots.
Inside there is only one thought: "I am late".
The buy or sell button is pressed not from a plan, but from fear of missing out.
This is how a classic "last train" entry is born.
This text breaks down how to spot that moment and how to stop turning each impulse into an expensive ticket without a seat.
How the last train looks on a chart
This situation has clear signs.
Long sequence of candles in one direction with no healthy pullback.
Acceleration of price and volatility compared to previous swings.
Entry happens closer to a local high or low than to any level.
Stop is placed "somewhere below" or moved again and again.
The mind focuses on other people’s profit, not on the original plan.
In that state the trader reacts to what already happened instead of trading a prepared setup.
Why chasing the move hurts the account
The problem is not just "bad luck".
Poor risk-reward .
Entry sits near an extreme. Upside or downside left in the move is small, while a normal stop needs wide distance. In response there is a temptation to push the stop further just to stay in.
Large players often exit there .
For them the trend started earlier. Where retail opens first positions, they scale out or close a part of the move.
Strategy statistics get distorted .
A system can work well when entries come from levels and follow a plan. Once late emotional trades appear in the mix, the math changes even if the historical chart still looks nice.
How to notice that the hand reaches for the last train
Knowing your own triggers helps.
This symbol was not in the morning watchlist, attention appeared only after a sharp spike.
The decision comes from news or chat messages, not from calm chart work.
There is no clear invalidation level, the stop sits "somewhere here".
Many timeframes blink at once, the view jumps from 1 minute to 15 minutes and back.
Inner talk sounds like "everyone is already in, I am the only one outside".
If at least two of these points match, the trade is most likely not part of the core system.
Simple rules against FOMO
Work goes not with the emotion itself, but with the frame around trades.
No plan, no trade .
A position opens only if the scenario existed before the spike. Fresh "brilliant" ideas during the impulse are placed into the journal, not into the order book.
Move distance limit .
Decide in advance after what percentage move from a key zone the setup becomes invalid.
For example: "if price travels more than 3–4 percent away from the level without a retest, the scenario is cancelled, next entry only after a pause and new base".
Trade from zones, not from the middle of the impulse .
Plans are built around areas where a decision makes sense, not around the fastest part of a candle.
Time filter .
After a sharp move, add a small pause.
Five to fifteen minutes with no new orders, only observation and notes.
What to do when the move has already gone
The smart choice is not "grab at least something".
Better to:
save a screenshot of the move;
mark where the trend started to speed up;
write down whether this symbol was in the plan and why;
prepare a setup for a pullback or the next phase, where entry comes from a level, not from the middle of noise.
Then the missed move turns into material for the system instead of three revenge trades in a row.
A short checklist before pressing the button
Was this symbol in the plan before the run started.
Do I see the exact point where the idea breaks and is the stop parked there.
Is the loss size acceptable if this trade repeats many times.
Can I repeat the same entry one hundred times with the same rules.
If any line sounds weak, skipping this "train" often saves both money and nerves.
The market will send new ones. The task is not to jump into every car, but to board the ones that match the timetable of the trading plan.

US100 / NASDAQ TodayNasdaq 100 (NDX) Analysis - December 3, 2024
Based on today's market data, here's a comprehensive analysis of the Nasdaq 100:
Today's Performance
The Nasdaq 100 is currently trading around 25,513 points. The index closed at 25,555.86, gaining 213.01 points (+0.84%) as of 5:16 PM EST on December 2.
Today's Trading Range:
Opening: 25,449.87
High: 25,622.58
Low: 25,369.36
Volume: 380,862,001
52-Week Performance
Over the past 52 weeks, the index has ranged from 16,542.20 to 26,182.10, representing an 18.91% gain over the past 12 months.
Technical Signals
Based on technical indicators and moving averages, the daily buy/sell signal is "Strong Buy".
2024 Performance Context
The Nasdaq-100 finished 2024 higher by 25% following a return of nearly 54% in 2023—its best two-year stretch since 1998 and 1999—and eclipsed 20,000 for the first time.
However, December saw a reversal with approximately three out of every five indexes experiencing losses, averaging down 4.0%. This followed the Fed's hawkish tone, as it reduced the number of expected rate cuts in 2025 to two from four.
Recent Index Reconstitution
On December 13, 2024, Nasdaq announced that Palantir Technologies, MicroStrategy, and Axon Enterprise will be added to the index effective December 23, 2024, while Illumina, Super Micro Computer, and Moderna will be removed.
Market Context
The index is currently navigating a period of consolidation after reaching near-record highs. Key factors influencing the market include Federal Reserve interest rate policy, valuations of mega-cap tech stocks (particularly the "Magnificent 7"), and ongoing developments in AI technology.
DISCLAIMER: This analysis is for informational purposes only and should not be considered financial advice. Trading in financial instruments involves significant risk, including the potential loss of principal. Past performance does not guarantee future results. Market conditions can change rapidly, and the information provided may not reflect real-time market movements. Always conduct your own research and consider consulting with a qualified financial advisor before making any investment decisions. The author is not a financial advisor and assumes no responsibility for any investment decisions made based on this analysis.

Trump It...Think we're close to completing this bull trap before we slide down lower - Q the free fall.

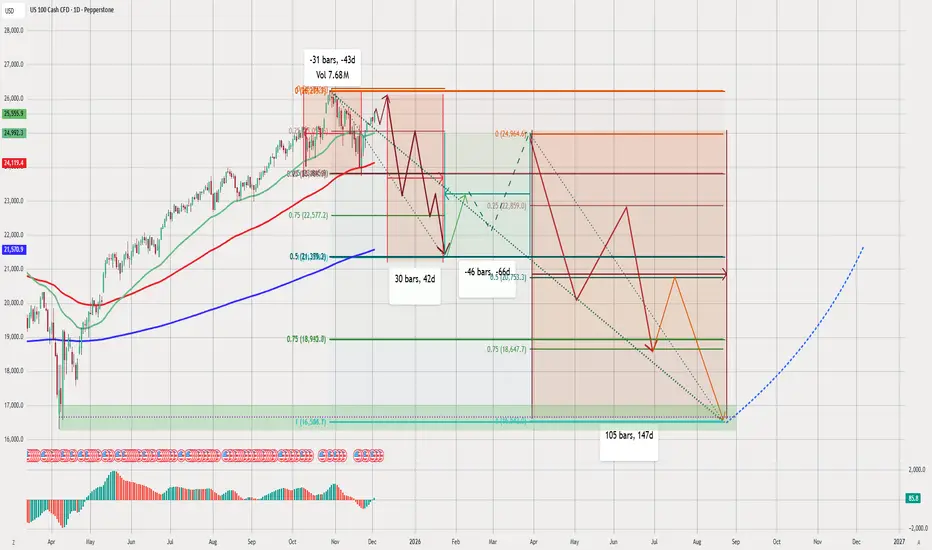
NAS100 DAILYNAS100 Technical Analysis (Daily Chart)
chart presents a medium-term bearish outlook, followed by a long-term bullish reversal. combining Fibonacci retracements, cycle timing (bars/days), moving averages, and wave projections to create a full market roadmap.
Below is a structured analysis:
1️⃣ Current Market Structure
NAS100 reached a major top near 26,000 before reversing.
Price broke below the short-term trendline and is dropping toward deeper support.
The red zig-zag pattern reflects expectation of continued selling pressure.
This suggests the index is entering a medium-term correction.
2️⃣ Fibonacci Levels (Key Zones Identified)
chart uses multiple retracements:
Current swing retracement levels
0.25 – 23,869
0.5 – 21,383
0.75 – 18,993
These levels match the projected downward path.
Major support zone
Large green rectangular zone near 16,300 – 17,000
This is aligned with:
Long-term Fibonacci support
Previous accumulation zone
Blue dotted long-term rising trendline
This zone is likely the macro bottom of the cycle.
3️⃣ Moving Averages (Trend Signals)
using:
Green MA (short-term)
Red MA (medium-term)
Blue MA (200-day long-term)
Current price is:
Breaking below the green and red MAs
Approaching the 200-day MA around 21,000
A break under the 200-day MA confirms a total trend shift to bearish.
4️⃣ Cycle Timing (Bars/Days)
chart marks three key cycles:
🔹 From the top to first support:
31 bars, 43 days
🔹 Next consolidation period:
30 bars, 42 days
🔹 Full correction phase to the bottom:
105 bars, 147 days
This indicates a highly structured time cycle, showing the correction may last until August–September 2026.
5️⃣ Expected Bearish Phase (Primary Scenario)
red path suggests:
Continued decline from current levels
Multiple lower highs and lower lows
A temporary bounce around 21,800
Then deeper drops toward 18,600 – 19,000
Extended capitulation down to the 16,300 zone (major support)
This zone is highlighted heavily, suggesting it is final bearish target.
6️⃣ Recovery Phase (Bullish Scenario)
After the bottom:
🟦 Bullish reversal zone: 16,300
The blue dotted line indicates:
A multi-month recovery
Strong upside momentum
Reestablishment of a long-term bullish trend
Possible return to previous highs later
This forms a textbook "macro correction → macro rally" cycle.
7️⃣ Summary of Your Market View
📉 Short-Term Bias: Strongly Bearish
Market breaking structure
Cycle timing supports continued decline
Price heading for deeper Fibonacci levels
📉 Medium-Term Bias: Bearish
Expecting multiple waves of selling
Target zone: 18,600 then 16,300
📈 Long-Term Bias: Bullish
After the cycle completes, NAS100 should resume its uptrend
Blue dotted projection shows a long rally into late 2026 and 2027
✔️ Final Outlook
chart shows a well-planned, detailed scenario:
A multi-leg correction
Followed by a strong, long-term bullish cycle
The 16,300 zone is the “macro bottom”
Timing suggests bottoming around August–September 2026
analysis is consistent, logical, and follows smart technical principles.
NAS100 4h SELLchart presents a medium-term bearish outlook, followed by a long-term bullish reversal. combining Fibonacci retracements, cycle timing (bars/days), moving averages, and wave projections to create a full market roadmap.
Below is a structured analysis:
1️⃣ Current Market Structure
NAS100 reached a major top near 26,000 before reversing.
Price broke below the short-term trendline and is dropping toward deeper support.
The red zig-zag pattern reflects your expectation of continued selling pressure.
This suggests the index is entering a medium-term correction.

Market Hunter: NASDAQ-NAS100 Sell OpportunityMy friends, Good morning!☀️
For US100-NAS100, I will open a SELL position between 24,988 and 25,243, targeting 23,843.📊
My friends, I share these analyses thanks to every single like I receive from you.
Your likes increase my motivation and make me want to support you in this way.🙏
I sincerely thank all my friends who support me with their likes.❤️

USNAS100 📉 The US100 chart shows a strong bullish structure forming after price successfully broke above a long-term descending trendline that had been acting as resistance for several weeks. This breakout indicates a potential shift in market momentum from bearish to bullish. After the breakout, price retested the same zone, confirming it as new support, which strengthens the reliability of the bullish setup.
✅ We can also see two major demand zones marked on the chart. These zones have repeatedly pushed price upward in the past, showing strong buying pressure. The market respected the latest demand zone once again, creating a solid base for the current upside move. With buyers stepping in and defending this level, a continuation to the upside becomes more likely.
✅ Following the retest of the broken trendline and the demand area, the price has started forming higher highs and higher lows—an early sign of trend reversal. This bullish structure aligns perfectly with the upward projection shown on the chart. The first target is placed around 25,700, where previous minor resistance lies. If price manages to break this level with momentum, the rally could extend toward the second target near 26,000+, which is a stronger resistance area and a psychological level where traders often take profits.
✅ The stop-loss region is positioned below the retest zone to protect the trade in case price fails to hold above the new support. This ensures a balanced risk-to-reward setup while maintaining market structure integrity.
✅ Overall, the market setup suggests a well-defined bullish opportunity supported by trendline breakout, successful retest, strong demand zones, and improving price structure. As long as price stays above the retest level, buyers may continue to push toward the highlighted targets.
If you find it helpful please like and comments for this post and share thanks.

NSDQ100 - Soft ADP employment figuresUS equities showed tentative stabilisation, with the S&P 500 up modestly and Nasdaq futures also edging higher this morning. Markets remain cautious ahead of a heavy US data slate and next week’s FOMC, with rate-cut expectations already priced at over 90%, limiting upside momentum for growth stocks.
Focus today is firmly on ADP private payrolls and the ISM services survey, especially the prices paid component, which is seen as an important inflation proxy in the absence of official CPI data. A soft ADP print would reinforce the view of a cooling labour market and be supportive for rate-sensitive Nasdaq tech, while any upside surprise risks pressuring the index via higher yields.
Treasury yields are drifting lower, offering some support to mega-cap tech, but overall trading conditions remain fragile. Crypto volatility continues to spill into risk sentiment after sharp moves in Bitcoin and crypto-related equities.
Geopolitics adds background risk, with no breakthrough on Ukraine talks and renewed threats from Russia, but for Nasdaq traders the near-term direction is likely to hinge almost entirely on today’s US data and its implications for Fed policy next week.

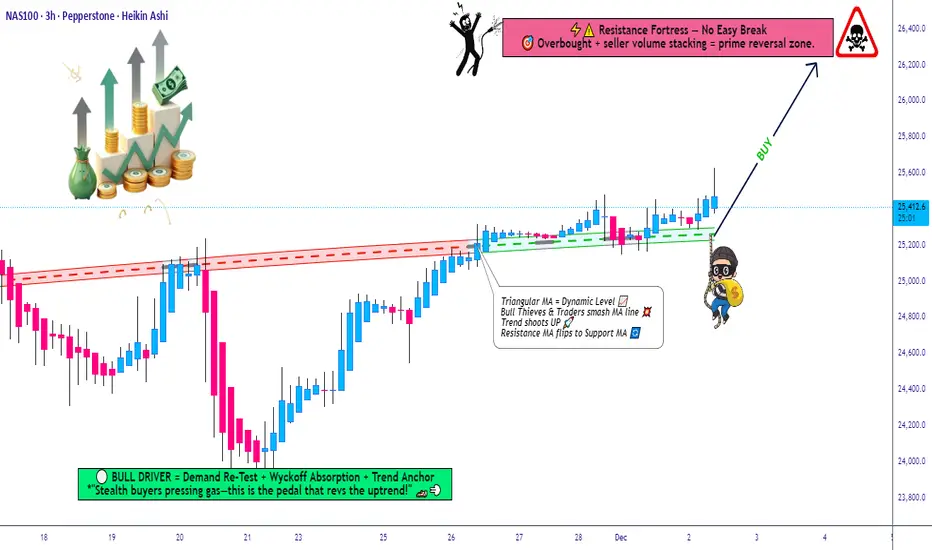
Will NAS100 Sustain Its Bullish Momentum After the Pullback?NAS100 🚀 Bullish Swing Setup | SuperTrend Pullback & Layered Entry Strategy
🎯 TRADE IDEA: NAS100 (US100) BULLISH SWING
Capitalize on a structured pullback in the NASDAQ 100! This plan leverages a proven indicator confluence for a high-probability long opportunity.
📊 ANALYSIS & CONFIRMATION:
Trend: Primary Bullish Trend is intact. ✅
Trigger: Price is pulling back into a demand zone, offering a favorable risk-to-reward entry.
Indicator: The SuperTrend ATR Line is acting as dynamic support on the 4H/Daily timeframe. A bounce from this level confirms our bullish bias.
⚡ STRATEGY: "THE THIEF" LAYERED ENTRY
This method uses multiple limit orders to average into a position, perfect for volatile markets like the NASDAQ.
Entry Zone: Look for entries between 25,200 - 25,600
Layer Example:
🟢 Limit Order 1: 25,600
🟢 Limit Order 2: 25,400
🟢 Limit Order 3: 25,200
👉 You can adjust the number of layers and prices based on your capital and risk appetite.
❗ RISK MANAGEMENT:
Stop Loss (SL): A decisive break below 24,800 would invalidate the bullish structure.
⚠️ IMPORTANT NOTE: This is MY protective stop. Dear Thief OG's 👑, you MUST adjust your position size and SL based on your personal risk management strategy. Protect your capital first!
🎯 PROFIT TARGETS:
Primary Target: 25,600 (Initial resistance & profit-taking zone).
Key Reasoning: We anticipate a reaction here due to:
Moving Average resistance.
Potential overbought conditions on lower timeframes.
A "trap" for late buyers.
👉 Smart Move: Consider taking partial profits at 25,600 and trailing your stop for the remainder. Escape the trap with your profits! 💰
⚠️ REMINDER: Dear Thief OG's 👑, your Take Profit (TP) is your own decision. Secure gains based on your trading plan and market behavior.
🔍 RELATED ASSETS & MARKET CORRELATION:
Watching these related instruments can provide confirmation and a broader market view.
TVC:DXY (U.S. Dollar Index): 🟡 NEGATIVE CORRELATION
A weakening Dollar ( TVC:DXY DOWN) is generally bullish for Nasdaq. If the Dollar is falling, it adds confidence to this long thesis.
USTECH (CFD on Nasdaq 100): 🟢 DIRECT CORRELATION
Moves in sync with NAS100. Perfect for cross-verifying price action and volume.
NASDAQ:AAPL , NASDAQ:MSFT , NASDAQ:TSLA (Mega-Caps): 🟢 HIGH IMPACT
These heavily weighted Nasdaq components drive the index. Bullish momentum in these stocks supports a rising NAS100.
FOREXCOM:SPX500 (S&P 500): 🟢 POSITIVE CORRELATION
A strong S&P 500 often lifts the Nasdaq. Monitor for overall U.S. market strength.
💬 Let me know your thoughts in the comments!
What's your entry strategy for the NAS100 this week?
#NAS100 #US100 #TradingView #SwingTrading #Bullish #SuperTrend #TradingStrategy #IndexTrading #LayeredEntry #ThiefStrategy

NASDAQDO YOU KNOW WHATS BEHIND THIS OR OTHER IDEAS?? in bio..
Preferably suitable for scalping and accurate as long as you watch carefully the price action with the drawn areas.
With your likes and comments, you give me enough energy to provide the best analysis on an ongoing basis.
And if you needed any analysis that was not on the page, you can ask me with a comment or a personal message.
Enjoy Trading ;)

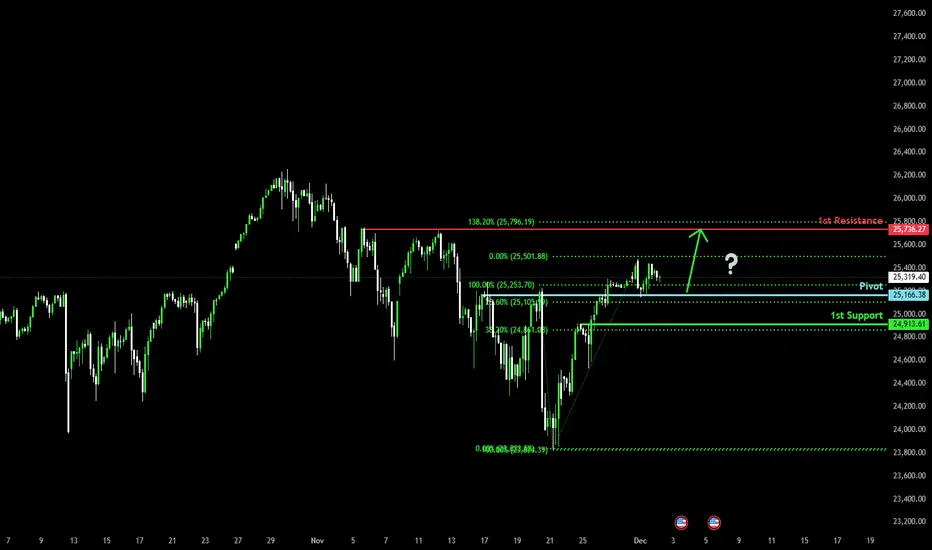
Bullish continuation setup?USTEC has bounced off the pivot and could potentially rise to the 1st resistance.
Pivot: 25,166.38
1st Support: 24,913.61
1st Resistance: 25,736.27
Disclaimer:
The opinions given above constitute general market commentary and do not constitute the opinion or advice of IC Markets or any form of personal or investment advice.
Any opinions, news, research, analyses, prices, other information, or links to third-party sites contained on this website are provided on an "as-is" basis, are intended to be informative only, and are not advice, a recommendation, research, a record of our trading prices, an offer of, or solicitation for, a transaction in any financial instrument and thus should not be treated as such. The information provided does not involve any specific investment objectives, financial situation, or needs of any specific person who may receive it. Please be aware that past performance is not a reliable indicator of future performance and/or results. Past performance or forward-looking scenarios based upon the reasonable beliefs of the third-party provider are not a guarantee of future performance. Actual results may differ materially from those anticipated in forward-looking or past performance statements. IC Markets makes no representation or warranty and assumes no liability as to the accuracy or completeness of the information provided, nor any loss arising from any investment based on a recommendation, forecast, or any information supplied by any third party.
2 DEC 2025: US100 MARKET RECAPJUST JOURNALLING
DISCLAIMER:
The owner of this page is an authorised Representative under supervision of TD MARKETS (PTY) LTD, an authorised Financial Services Provider (FSP No. 49128) licensed by the Financial Sector Conduct Authority (FSCA) under the Financial Advisory and Intermediary Services Act (FAIS).
The FSP is licensed to provide advice and intermediary services in respect of Category I financial products, including but not limited to derivative instruments, long-term deposits, and short-term deposits.
All investment ideas are provided in accordance with the scope of the FSP's license and applicable regulatory requirements. Derivative instruments is a leveraged products that carry high risks and could result in losing all of your capital, and past performance is not indicative of future results.
This idea and any attachments are informational/education and does not constitute a recommendation to buy/sell.
No guarantee is made regarding the accuracy or outcome of this trade idea.
If you choose to accept this idea, please do so at your own risk.


NAS100 Bullish Setup on 1hrNAS100 Bullish Setup on 1hr
Bullish Setup presented on 1hr
- Bullish divergence
- 1hr FVG created in this crazy sell off
- 1hr unfinished candle at my TP level
Entry: 24160
TP: 25000
SL: 23980
RR: 1:5.71

BUY ZONE NAS100All timeframes are bullish
On 4 hr there is a CHoC - buyers took control
The CHoC comes from the OB that is imbalanced (30 min OB - IMB)
Inside the OB imbalanced 30 min fair value gap making zone a POI (point of interest)
Looking to take buys from 30 min OB - IMB
Before taking buys, will drop to lower time frame for execution
Consider the liquidity zone when taking an entry
TRADE WHAT YOU SEE & NOT WHAT YOU FEEL - GOOD LUCK

NASDAQ100 Breakout Watch — Is a New Upside Leg Starting Now?📈 NASDAQ100 Swing Trade Opportunity — Bullish Breakout Play
🟩 Asset: NASDAQ100 (Index CFD)
⚡ Trade Type: Swing Trade — Bullish Plan Confirmed
🧭 Trade Thesis
The index has confirmed a bullish setup following a Triangle + Moving Average breakout, strengthening upward momentum and favoring dip-buying behavior.
To reflect the Thief layering method, this plan uses multiple staggered limit orders to accumulate positions efficiently across volatility pockets.
📌 Entry Plan (Thief Layering Method)
💰 Entry Style: “Any price level allowed — Thief uses layers”
Buy Limit Layers:
24,900
25,000
25,100
25,200
(Feel free to increase or customize layers to fit your personal risk and liquidity preference.)
🛑 Stop-Loss (SL)
🔻 Thief SL: 24,500
Dear Ladies & Gentlemen (Thief OG’s), adjust SL based on your personal risk and strategy.
This is not a fixed recommendation, only a reference zone.
🎯 Target (TP)
⚡ The High-Voltage Electric Gate Zone around 26,200 acts as major resistance because of:
Overbought readings
High-liquidity trap behavior
Historical reversal probability
Exit with profits before heavy sellers activate.
Again — you decide your own TP based on your risk tolerance, not mine.
📊 Market Logic Behind the Move
Breakout structure confirmed
Trend continuation supported by triangle compression
Index ETF flows show short-covering + rotation back into tech
Momentum accelerates above 25,200 zones
Cleaner upside path until liquidity wall at 26,200
🔎 Related Pairs to Watch (Correlation Insight)
1️⃣ NASDAQ:NDX / NASDAQ:QQQ
Direct ETF mirror of NASDAQ100
Useful for checking volume, market depth, and real-time breakout confirmation
2️⃣ SP:SPX / NYSE:ES (S&P 500)
High correlation (approx. 0.85+)
A strong SPX supports tech continuation; weakness warns of index-wide pullback
3️⃣ TVC:VIX (Volatility Index)
Inverse correlation
If VIX stays below key volatility thresholds, bullish NASDAQ continuation is more reliable
4️⃣ FX:USDOLLAR / DXY
Tech usually performs better when the Dollar weakens
A rising Dollar can slow or cap NASDAQ bullish momentum
5️⃣ TVC:US10Y / Yields
NASDAQ moves inversely with yields
If yields drop, NASDAQ accelerates
If yields spike, prepare for turbulence or failed breakouts
📘 Summary
Bullish plan confirmed via Triangle + MA Breakout
Thief layering entries positioned smartly into volatility
SL/TP guidance flexible for trader customization
Strong correlation checks available across SP:SPX , TVC:VIX , TVC:DXY & yields
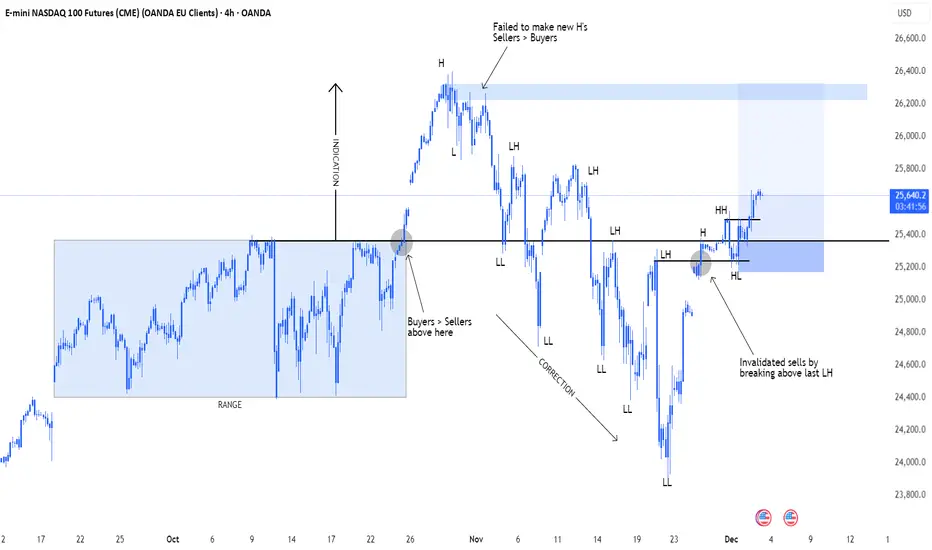
NAS100 LONG setupNas has been ranging for over a month back in Sep-Oct, buyers won the battle and pushed price to 26,3k.
Sellers kicked in again and price corrected for another month.
Recently price has broken back above the level and from here I'm looking for buys, as long as it keep making HHs and HL's during the next couple of weeks, during next New York sessions.
Nasdaq Hits Resistance: Pullback Before the Next Bullish Move?📊 Nasdaq – Technical Setup & Market Catalysts
The index recently tested a previously unfilled Fair Value Gap (H1 timeframe) and swept liquidity from last week’s accumulation — a process that often precedes new directional moves. The move cleared many trapped positions and reset the orderbook.
Currently, Nasdaq is sitting below a strong resistance zone; price appears to be weakening, which increases the probability of a short-term pullback toward the Previous Day Low (PDL) to collect more liquidity before any further upside attempt.
Momentum indicators and price structure suggest caution: while the general uptrend remains, a lack of upward acceleration and signs of hesitation point toward a possible consolidation or retracement.
🌍 Fundamental & Macro Context
Optimism remains in markets thanks to rising investor expectations of a rate cut by the Federal Reserve (Fed) this December. This sentiment supports risk assets, and tech stocks in particular — historically sensitive to interest rates and discounting future earnings.
However, some analysts warn that valuations in the tech sector — which heavily influence Nasdaq — are rich relative to earnings. The forward P/E ratio sits well above long-term averages, increasing vulnerability if economic data disappoints or if rate cuts are delayed.
Broader macro conditions remain fragile: global yield curves and bond markets show signs of stress, which could add volatility. Also, inflation trends and upcoming U.S. data releases could shift sentiment quickly.
🎯 What to Watch Next
Pullback zone: Look for support near the PDL or recent liquidity area — potential buying zone if price stabilizes.
Breakout zone: If Nasdaq breaks above resistance with strength and volume, upside is open toward higher targets set pre-rally.
Catalysts: Fed rate-cut expectations, upcoming economic data (inflation, employment, PMI), and tech sector earnings will influence direction strongly.
US NAS 100DO YOU KNOW WHATS BEHIND THIS OR OTHER IDEAS?? in bio..
Preferably suitable for scalping and accurate as long as you watch carefully the price action with the drawn areas.
With your likes and comments, you give me enough energy to provide the best analysis on an ongoing basis.
And if you needed any analysis that was not on the page, you can ask me with a comment or a personal message.
Enjoy Trading ;)

USNAS100 | Breakout Setup Ahead of PowellOANDA:NAS100USD – Outlook
Wall Street futures slipped on Monday as investors turned cautious ahead of key U.S. economic data and remarks from Federal Reserve Chair Jerome Powell later in the day.
Market participants will closely analyze Powell’s comments for any hints regarding the Fed’s stance on potential rate cuts at this month’s policy meeting.
Technical Analysis
NASDAQ is trading inside a consolidation range between 25200 and 25290, showing a slightly bullish bias while holding above 25200.
A 1H close above 25290 will confirm bullish continuation toward 25430, and a breakout above 25560 opens the path for an extended rally toward 25980.
On the downside, a 1H close below 25200 will expose 25100, and a break below this level will trigger stronger bearish momentum toward 24810 → 24570.
Pivot Line: 25200
Support: 25100 · 24820 · 24570
Resistance: 25300 · 25420 · 25560
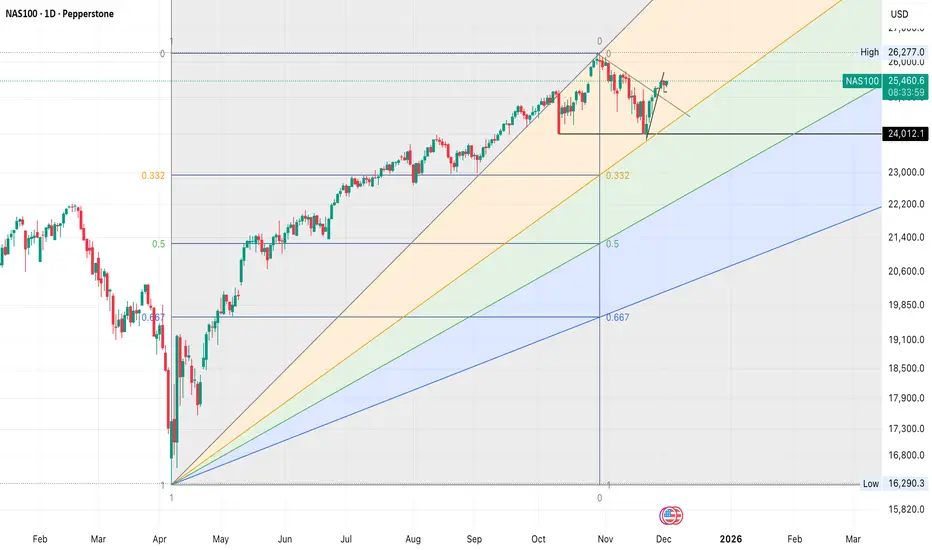
Speed resistance line is in effective0.332 speed resistance line shows effectiveness in NAS100 drawdown.