NAS100 Bullish Structure Break with Key Fibonacci Level in PlayThe NAS100 is now showing clear signs of strength, with a solid bullish move and a confirmed break of structure on the 4-hour timeframe 🚀. With this shift, the focus turns to how price behaves on the pullback.
The main level of interest is the 61.8% Fibonacci retracement of the current swing. A buy setup becomes valid only if price retraces and holds above the 61.8 level 🔥. Holding above this zone would indicate a shallow pullback — a strong sign that buyers are stepping in aggressively and maintaining control.
If price respects the 61.8 and then breaks structure to the upside again, that’s the confirmation needed to look for long opportunities 📊.
However, if price breaks below the 61.8 level, the idea is invalidated and should be abandoned. A deeper retracement may signal weakness, although it could also be a smart-money liquidity run before a continuation — either way, the priority is to see momentum hold above 61.8 to keep the bullish narrative intact ⚠️.
Not financial advice.
Trade ideas

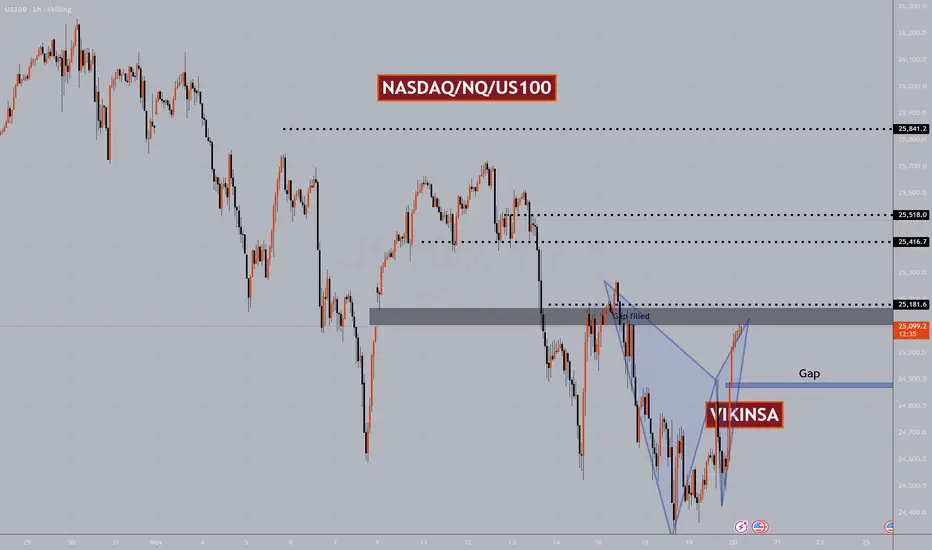
NASDAQNASDAQ Analysis – Possible Early Pullback Before New York Session
The Nasdaq may experience a short-term correction during the London session and pre–New York, especially after yesterday’s explosive 550-point rally driven by Nvidia’s strong earnings.
Price is currently sitting on the 0.786 Fibonacci level, which is acting as a strong support and has been respected multiple times. At the same time, the index is positioned just below the descending trendline formed from the recent highs.
The fractal structure has now been completed, suggesting we could see a small bearish move before the New York session potentially resumes the bullish trend.
If price fails to break below the 0.786 support and instead breaks above the descending trendline, we could see continuation to the upside, targeting 25,300 in the next impulsive leg.

NAS100 Breakout Watch: Compression Before Expansion
The Nasdaq-100 index is trading at 25,130 , and the intraday price action is setting up what could be a high-probability move. Multiple technical frameworks are converging at a critical decision point. Let's dissect what's unfolding across the timeframes. 💹
Market Context & Structure
We're observing a Symmetrical Triangle pattern on the 1H chart that's been coiling for the past several hours. This compression zone between 25,080-25,185 represents a battleground between bulls and bears. The apex is approaching, which historically precedes volatility expansion.
From a Dow Theory lens, the intermediate trend remains bullish with higher highs and higher lows intact on the 4H timeframe. The recent pullback appears corrective rather than impulsive, suggesting the broader uptrend is still in play.
Wyckoff Analysis 📉
The overnight action exhibits classic Wyckoff accumulation characteristics within our consolidation range. We've seen:
Spring action down to 25,050 (stop hunt below support)
Absorption of selling pressure with diminishing volume
A Last Point of Support (LPS) forming around 25,090
This accumulation schematic suggests smart money positioning for the next markup phase.
Wave Count Perspective 🌊
Elliott Wave structure indicates we're likely completing a wave (4) triangle correction within a larger impulse. The internal labeling suggests:
Wave A-B-C-D-E triangle pattern nearing completion
Wave (5) target zone: 25,350-25,450
Invalidation level: Break below 25,020
The alternation principle supports this count, as wave (2) was a sharp zigzag, making a triangle for wave (4) textbook behavior.
Critical Levels & Zones 🎯
Upside Targets:
T1: 25,245 (initial resistance + prior pivot)
T2: 25,380 (Fibonacci extension 1.618)
T3: 25,525 (measured move from triangle)
Support Foundation:
S1: 25,085 (triangle baseline + EMA cluster)
S2: 25,020 (swing low + psychological)
S3: 24,890 (major demand zone)
Indicator Dashboard ⚡
RSI (1H): 52.4 - neutral, coiling with price
Stochastic: Curling up from 35, bullish crossover forming
VWAP: Currently at 25,118 acting as dynamic pivot
Ichimoku: Price inside the cloud (equilibrium), Tenkan/Kijun bullish twist imminent
Volume: Declining in range (typical pre-breakout behavior)
Harmonic Setup Recognition
A Gartley pattern completed at the 25,050 level with:
- X: 24,890
- A: 25,280
- B: 25,050 (0.618 retracement)
- D: PRZ achieved
This harmonic structure aligns perfectly with our Elliott wave count, adding confluence to the bullish thesis.
Actionable Trading Strategies 💼
Strategy 1 - Triangle Breakout:
Entry: 25,190 (break above triangle resistance + retest)
Target 1: 25,280
Target 2: 25,420
Stop: 25,080
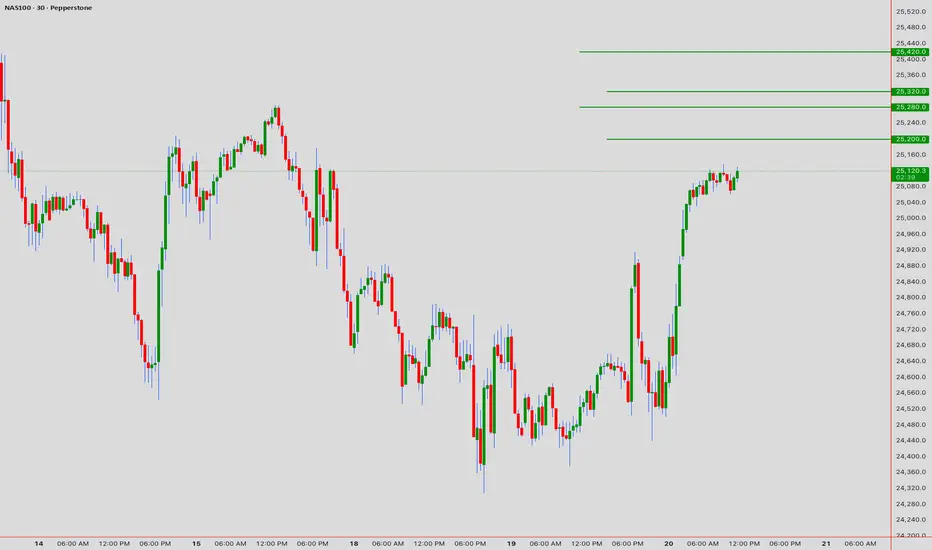
Strategy 2 - Support Zone Buy:
Entry Zone: 25,085-25,095 (limit orders)
Target 1: 25,200
Target 2: 25,320
Stop: 25,035
Multi-Timeframe Sync 🕐
- 5M: Micro pullback entries and exits
- 15M: Trend confirmation via EMA alignment
- 1H: Primary pattern and trade direction
- 4H: Structural bias verification
The Bottom Line
NAS100 is coiled like a spring at 25,130. The technical evidence suggests accumulation is wrapping up, with multiple methodologies pointing toward upside resolution. The 25,190 breakout level is your line in the sand—above it, the path opens to 25,400+. Below 25,080 invalidates the immediate bullish setup.
Stay alert for the breakout, but don't force trades inside the range. Patience now equals profits later. ⚡
---
Risk Disclosure: Trading derivatives carries substantial risk. This analysis is educational only and not financial advice. Trade responsibly.
NASDAQ $NQ US100 Major Levels And PatternsNasdaq bounced yesterday heavily and completed a W pattern. I personally have been able to capture majority of this move. You can consider yesterday's W pattern a sort of double bottom which means hat more bullishness is expected in the medium term.
On a short term, now that it has completed a W pattern and reached previous important zone which had a gap, so we can expect a correction here but this may not be a big one. In a rare case there may not be any correction here at all because NASDAQ is forming a pattern which when forms usually ignores all the smaller W and M patterns.
For that reason my Bias is bullish and I will look for buying opportunities mostly.
There are certain Higher time frame levels that I am watching closely which you will find on the chart.
Trade what you see, manage the risk.
Follow for more. Please support this analysis by liking, commenting, and sharing with friends, colleagues, traders, and trading communities. Thanks👍🙂
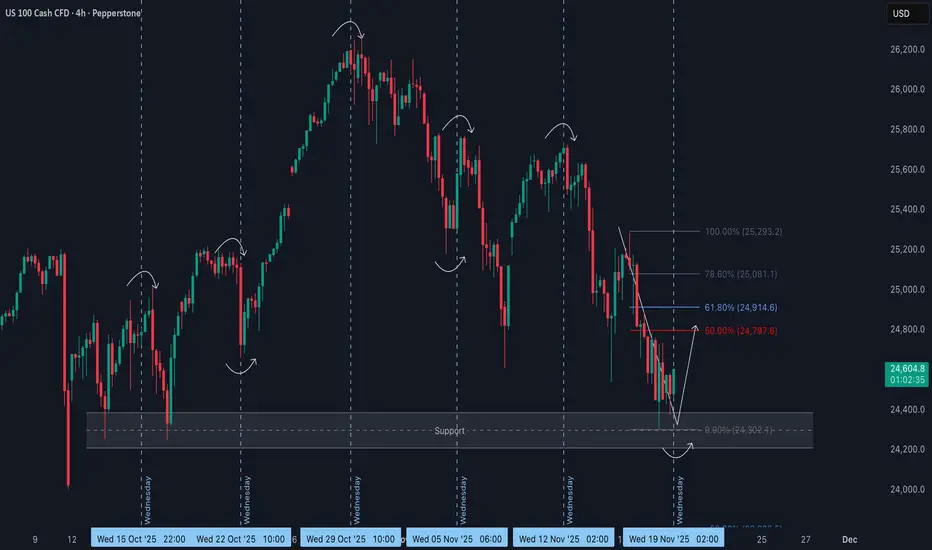
NAS100 Wednesday Reversal Potential from Key SupportOver the past several weeks, the NAS100 has shown a clear tendency for aggressive mid-week reversals, with Wednesdays repeatedly triggering sharp shifts in direction 🔄. This pattern suggests a strong time-based element in the algorithmic delivery of price, rather than random fluctuation.
🗓️ Each Wednesday has produced a notable reaction, whether through a liquidity grab, a stop run, or a full intraday reversal. With today being Wednesday once again, the timing aligns perfectly with the type of behaviour the market has been delivering consistently.
📉 The current decline has brought price directly into a well-defined high-timeframe support region. This area has a history of accumulation and typically holds a large amount of resting liquidity underneath it. The repeated wicks into this zone resemble classic Wyckoff spring behaviour 📦 — a sweep of sell-side liquidity followed by a potential response from larger players.
📐 The most recent bearish leg is noticeably overextended and has not offered a proper retracement since breaking lower. This leaves inefficiencies behind and increases the likelihood of a move back toward equilibrium.
🔄 Given the confluence of mid-week timing, the tap into higher-timeframe support, the liquidity sweep, and the extended nature of the current downswing, the expectation is for at least a corrective move back into equilibrium 📈.
A bullish break of short-term structure on the lower timeframes would strengthen this bias and open the door for a retracement into the premium levels listed above.
⚠️ Not financial advice. This is simply a technical outlook and my opinion.
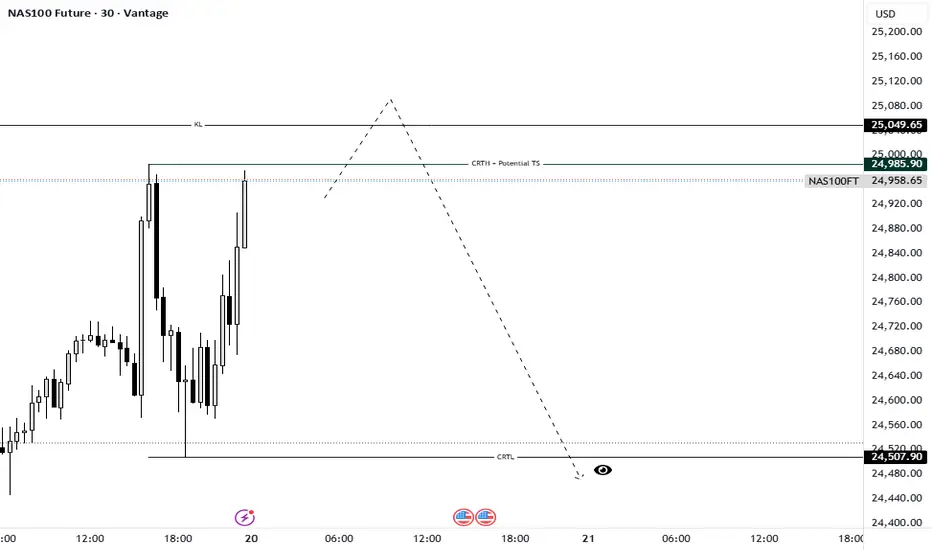
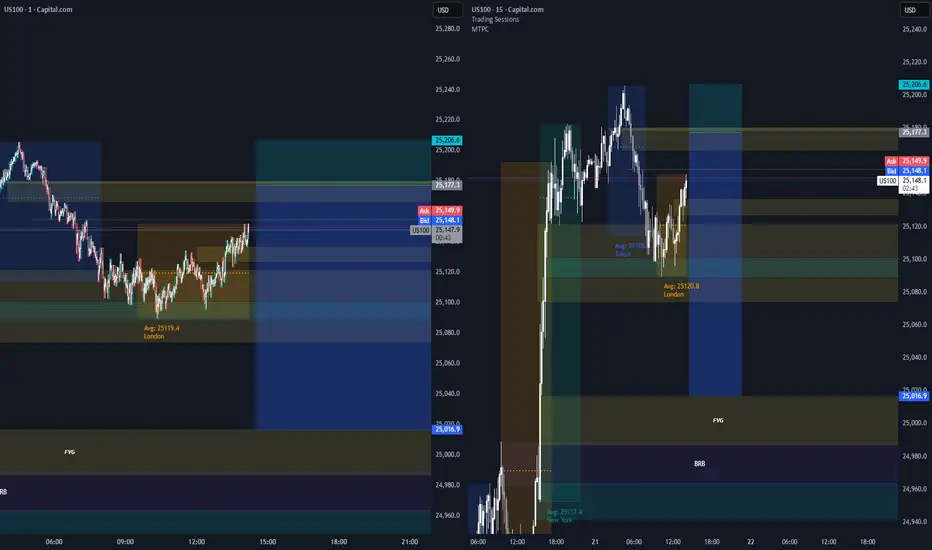
NAS100 Future: Waiting for the Turtle Soup Short SignalTimeframe: 30M | Model: Potential Turtle Soup (TS) / Bearish Model #1 Setup
The Nasdaq is setting up a crucial liquidity event that aligns perfectly with the CRT Manipulation (Candle 2) phase. We are currently consolidating just below a major structural high, which is acting as a magnetic zone for stops.
Here is the speculative short thesis:
The Trap Zone: The level at 24,985.90 is marked as the CRTH (Candle Range Theory High) and our "Potential TS" line. This is where most early breakout traders will place their buy stops, or where swing traders will look to enter short.
The Liquidity Hunt: We anticipate the market will execute a Turtle Soup—an aggressive spike above 24,985.90, potentially reaching the secondary resistance (RL) at 25,049.65, before immediately failing. This sweep is required to fuel the subsequent massive drop.
The Trigger (Bearish Model #1): Our entry signal (the Bearish Model #1) will only be confirmed IF price closes decisively back below the CRTH line after the liquidity sweep (the failure candle).
Targets:
Primary Objective (CRTL): If the Turtle Soup and reversal confirm, we expect a strong, fast drop (the Distribution, or Candle 3, phase) targeting the CRTL (Candle Range Theory Low) at 24,507.90. This low is holding significant Sell Side Liquidity (SSL).
Discipline: This is a high-risk, high-reward setup. Do not enter until the Turtle Soup has completed and the Bearish Model #1 reversal candle has closed. Patience is required to avoid being the liquidity that fuels the institutional move.
Wait for the Sweep. Trade the Reversal.
Greetings,
MrYounity
US100 shortlooks like that the market wants to "fight" against the liquidity that has been built yesterday... NY-opening I love u <3 xD
nasdaq buyhi evryone the nasdaq index can rise to the specifed target. please don't forget capital managment

NDX today is the day.🚀 Today is the day that marks a before and after. ⚡️🔥
We haven’t even tasted true tech-sector FOMO yet — not even close.
Right now we’re sitting in the same extreme fear zone we saw back in early April…
and you know exactly what happened next. 😉
Google is leading the charge, showing the path the entire index is meant to follow.
And tonight, NVIDIA provides the fuel ⛽🔥
The rest of the market will move to its rhythm — like an orchestra waiting for the conductor.
Make no mistake:
🎄🚀 A massive Christmas rally is coming.
The kind that leaves you speechless.
The kind people remember for years.
The kind that turns disbelief into FOMO… and FOMO into vertical candles.
Buckle up.
The real move is just beginning. 😉
🔥🚀📈
#TechRally #NVIDIA #GoogleLeading #FearToFOMO #SantaRally #MarketShift #NextLegUp

US100 (NASDAQ) - LONG IDEANAS hit its major support level and seems to be respecting that level, NASDAQ shifted its internal structure looking good to buy at the current price. Do your own analysis before taking any trade, this isn't a financial advise.

NAS100 Trade Secured 1500 PipsSet up played out perfectly BOS on the 1h during London session, fail to sweep SSL, 5m engulfing/CISD, to target BSL/PDH


Long Opportunity on NAS100Any thought on this NAS100 setup? The double bottom was formed on 1hr timeframe and broke the neckline. Looking for the long opportunity after any confirmation of this retest at the neckline

Nasdaq Slips as Traders Brace for Nvidia EarningsUSNAS100 | Overview
Traders remain firmly in risk-off mode as concerns grow over stretched AI and tech valuations ahead of Nvidia’s earnings, set for release after tomorrow’s market close.
Nvidia shares are already down about 1% in premarket trading, reflecting cautious sentiment across the tech sector.
At the same time, investors are watching for the resumption of key U.S. economic data, including the jobs report due Thursday, after recent shutdown-related delays.
There is growing worry that incoming data may discourage the Fed from delivering further rate cuts, adding pressure to equity markets.
Technically:
USNAS100 continues to trade under bearish pressure, and as long as the price remains below 24760, the downtrend is expected to continue toward 24575.
A break below 24575 would open the next bearish targets at 24340 and 24150.
To shift into bullish movement, the index must close a 1H candle above 24880, which would signal a rebound toward 25010 and 25230.
Key Levels
Pivot Line: 24760
Support: 24575 · 24340 · 24150
Resistance: 24880 · 25010 · 25230
NASDAQDO YOU KNOW WHATS BEHIND THIS OR OTHER IDEAS?? in bio..
Preferably suitable for scalping and accurate as long as you watch carefully the price action with the drawn areas.
With your likes and comments, you give me enough energy to provide the best analysis on an ongoing basis.
And if you needed any analysis that was not on the page, you can ask me with a comment or a personal message.
Enjoy Trading ;)

NAS100 Trade Set Up Nov 19 2025Price is still overall bearish on the 4h and daily but price just broke structure on the 1h so i would want to see a sweep of SSL, close above and internal IFVG/CISD to target PDH/BSL

NSDQ100 under pressure ahead o Nvidia earningsThe tech-led selloff continues to intensify, with the S&P 500 logging a 4th straight decline and NASDAQ-100 futures under pressure again this morning. The core drag remains AI valuation fatigue, with the Magnificent 7 down nearly 8% from their October highs and edging toward correction territory. Weak macro data and disappointing earnings added to the risk-off tone, pushing the VIX up to 24.7, its highest in weeks, signaling elevated demand for downside protection in mega-cap tech.
Global equities are sitting at one-month lows as investors reassess whether the massive AI capex cycle will truly deliver near-term returns. That leaves Nvidia’s earnings after the bell as the pivotal catalyst: analysts expect >50% revenue growth, but with stretched positioning and fragile sentiment, the reaction may hinge more on guidance and sustainability of data-center demand rather than headline beats.
Political noise is also picking up but has limited direct intraday impact on NDX for now. Trump’s White House meeting with Saudi Arabia and hints about his shortlist for the next Fed Chair add background uncertainty, though markets will focus more on how the Fed leadership outlook may influence the 2025–26 rate path.
Bottom line for NDX traders:
Sentiment remains fragile, volatility is elevated, and the near-term direction will heavily depend on Nvidia earnings. A strong print could stabilize AI/tech momentum; a miss or cautious outlook risks accelerating the correction in the mega-cap complex.
Key Support and Resistance Levels
Resistance Level 1: 25093
Resistance Level 2: 25290
Resistance Level 3: 25510
Support Level 1: 24278
Support Level 2: 24095
Support Level 3: 23910
This communication is for informational purposes only and should not be viewed as any form of recommendation as to a particular course of action or as investment advice. It is not intended as an offer or solicitation for the purchase or sale of any financial instrument or as an official confirmation of any transaction. Opinions, estimates and assumptions expressed herein are made as of the date of this communication and are subject to change without notice. This communication has been prepared based upon information, including market prices, data and other information, believed to be reliable; however, Trade Nation does not warrant its completeness or accuracy. All market prices and market data contained in or attached to this communication are indicative and subject to change without notice.

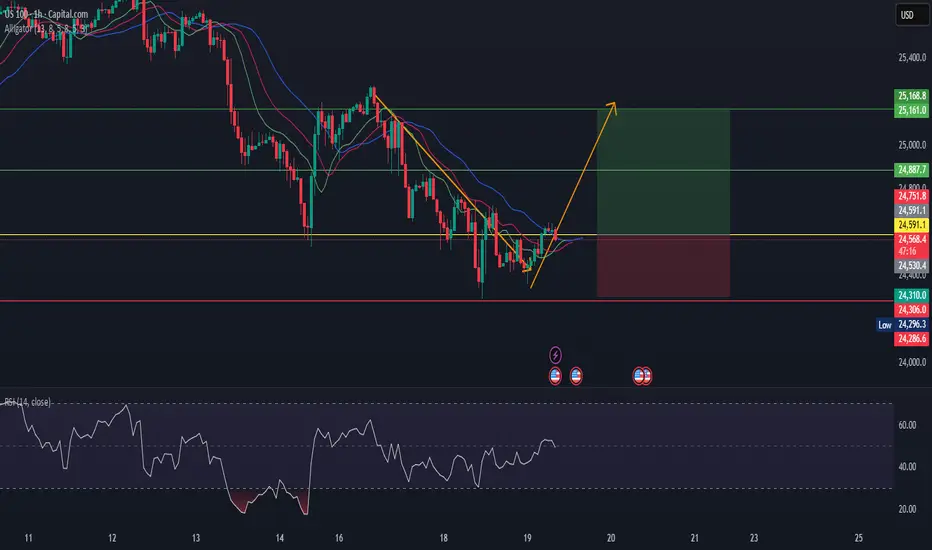
US100US100 is in reversal mode.
As per my analysis.
Alligator direction change to upward.
bullish divergence also made.
See here strong buy indicatin.
Buy at CMP.
NASDAQ 100
Sells
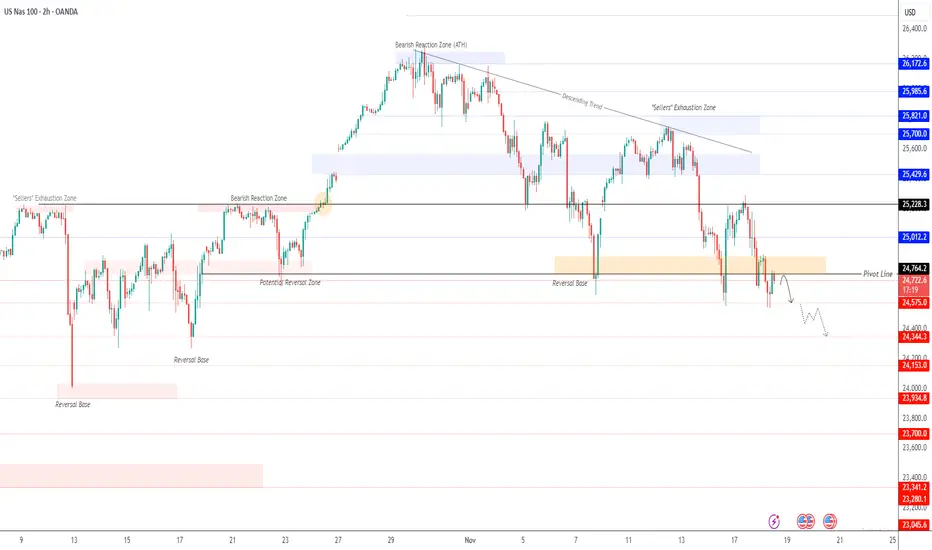
The market is showing clear signs of bearishness, evidenced by consecutive breaks of previous lows and sustained higher-timeframe downside momentum. With the daily timeframe continuing to push lower—breaking both the previous weekly low and the current daily low—the broader structure supports further selling pressure.
On the 4-hour (240) timeframe, momentum remains bearish, and price continues to form lower highs, reinforcing the downside bias. Although the market is currently ranging, this consolidation appears corrective rather than reversal-based. Because of this, I anticipate the market will likely continue selling, targeting lower pricing levels on the asset.

US100 – Missed Entry, but the Structure Was Perfect. Market Structure
The overall trend remains bearish. Price broke strongly below the previous Order Block, confirming sellers are still in control.
2. Order Block + Volume
The bearish OB was formed by a strong impulsive candle with high volume — a clear footprint of smart money. Price retraced but missed the entry zone by just a few points.
3. Liquidity
Before the major drop, price swept the liquidity above and instantly reversed. A classic pattern: liquidity grab → OB retest → sell-off.
4. Retest Logic
Even though the entry was missed, the V-Shark OB structure remained perfectly valid. When you follow the right logic, another opportunity always comes — no need to FOMO.
Conclusion
A missed entry doesn’t mean a bad analysis. It simply means the market didn’t offer the exact fill. Discipline over impulse — always.
Disclaimer
For educational purposes only. Not financial advice.
#VNShark #VSharkOB #OrderBlock #SmartMoneyConcept #PriceAction #Volume #Liquidity #US100 #NASDAQ #TradingView

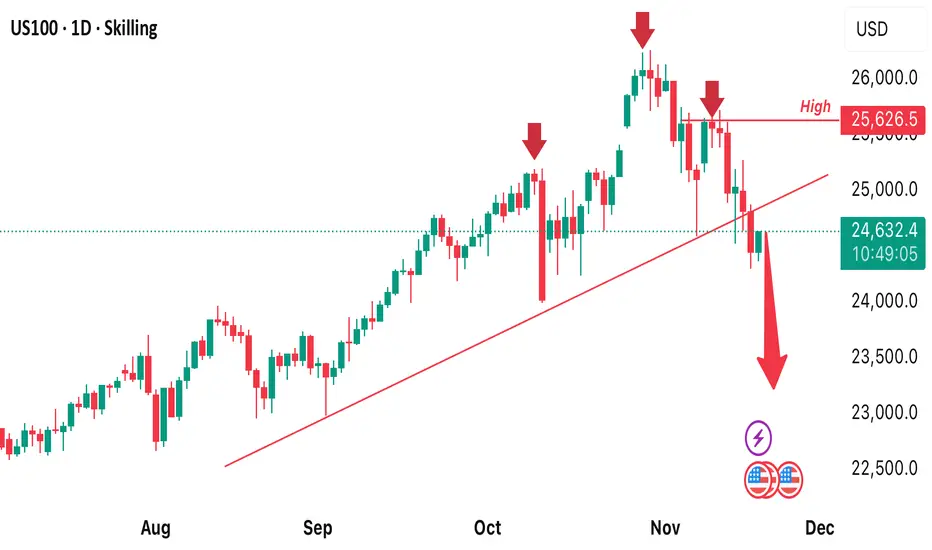
Market Watch: NASDAQ at a Critical JunctureToday, all eyes are on the NASDAQ as we head into a key earnings release. The index is approaching a pivotal short-term level — the 55-day moving average at 24,091, which aligns closely with the August high of 23,969. With the daily RSI nearing oversold territory around 30, there's a strong chance this level could hold on the initial test.
But here's the catch: the weekly chart is flashing warning signs.
🔍 The weekly RSI has already topped out, suggesting momentum is fading. If the 55-day MA doesn't hold, we could see a deeper pullback toward the 55-week moving average at 22,035, which also aligns with the late 2024 high of 22,222.
This level could be the litmus test for the broader bull trend. A weekly close below it would be a major technical breakdown — and let’s not forget, the NASDAQ often leads the S&P.
Stay sharp. The next few sessions could be decisive.
Not trading advice

US100 DAILY CHARTNASDAQ100 has a tendency to make a new low. We can see how price has been bearish for couple of days now. I expect price to drop lower therefore, a sell opportunity is envisaged
NAS100 – Bullish Shift After LL → HL Structure Change (15M)
Price created a final Lower Low (LL) followed by a clean Higher Low (HL), signaling the start of a trend shift.
Market broke short-term structure with a fresh Higher High, confirming bullish intent.
EMAs are compressing and starting to fan upward, showing building momentum.
RSI is trending above the mid-line, supporting continued upside pressure.
A small FVG (Fair Value Gap) below may act as support if price retests.
Trade Plan
Buy Zone: 24,600 – 24,630
Take-Profit (TP): 24,783.3
Stop-Loss (SL): 24,548 – 24,566 (below FVG + EMA cluster)
Why This Setup Makes Sense
Clear structure transition from bearish to bullish.
Fresh HH confirms continuation potential.
EMAs aligned upward with improving momentum.
Clean upside liquidity target at 24,783.
Invalidation
Break and close below 24,548 invalidates the bullish structure.
