US100 MARKET STRUCTURE - H1 TIMEFRAME We’re still looking forward to seeing price decline further in US100 therefore we’ve market out our major levels of support and resistance in the higher timeframe. From the H1 timeframe , we’re looking for a sell upon price breaking below 23367.0
US100 trade ideas
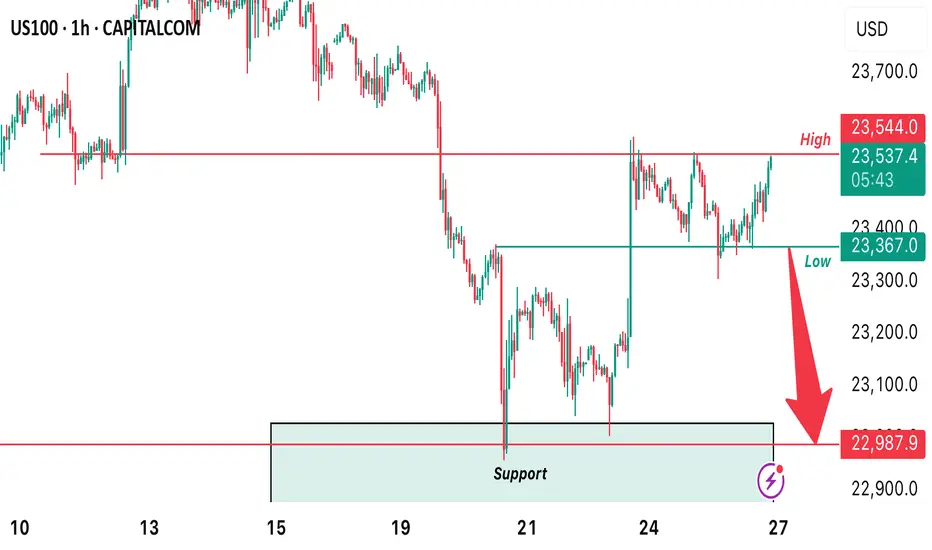
US100Currently in a strong support level were its holding for a long time. We can see that price also consolidated in this area.

Nasdaq 100 Awaits Breakout After Earnings ReactionUSNAS100 – Overview
On Thursday, the Nasdaq saw only slight moves as investors assessed Nvidia’s quarterly earnings. Price action is consolidating around a key support level.
Technical Outlook
If price holds above 23,560, bullish momentum remains in place, targeting 23,690 → 23,870.
A drop below 23,560 would keep the index range-bound between 23,560 – 23,435.
A confirmed breakdown requires a close below 23,435, which would signal bearish continuation.
Key Levels
Resistance: 23,560 – 23,435.
Support: 23,690 – 23,870.

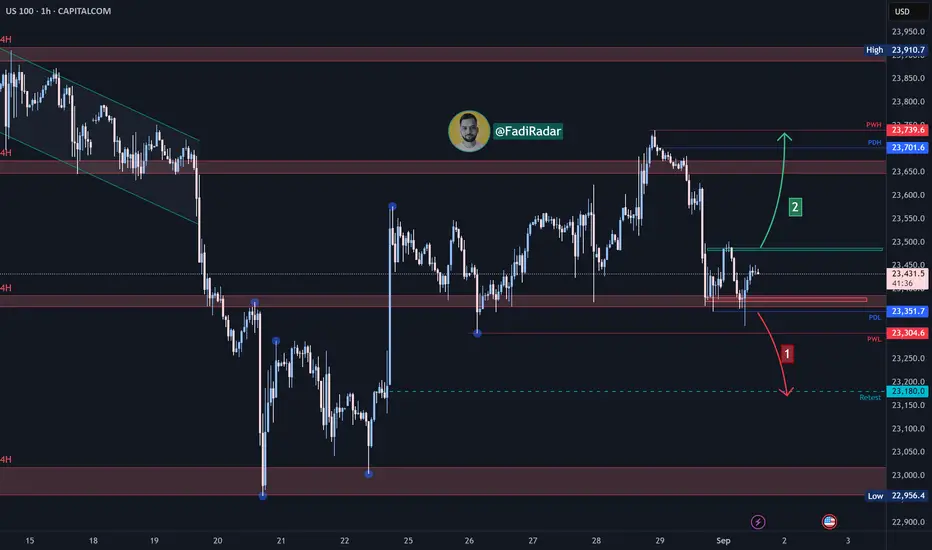
NASDAQ Index Analysis (US100 / NASDAQ)At today’s market open, the index tested the 23,320 support level, with a higher probability of retesting the 23,180 area before bouncing upward.
🔻 Bearish Scenario:
If the price breaks below 23,320 and holds beneath it, the index is likely to test 23,180.
🔺 Bullish Scenario:
If the price rebounds and breaks above 23,500, holding higher, this could support a continuation towards 23,620 as an initial target, followed by 23,700.
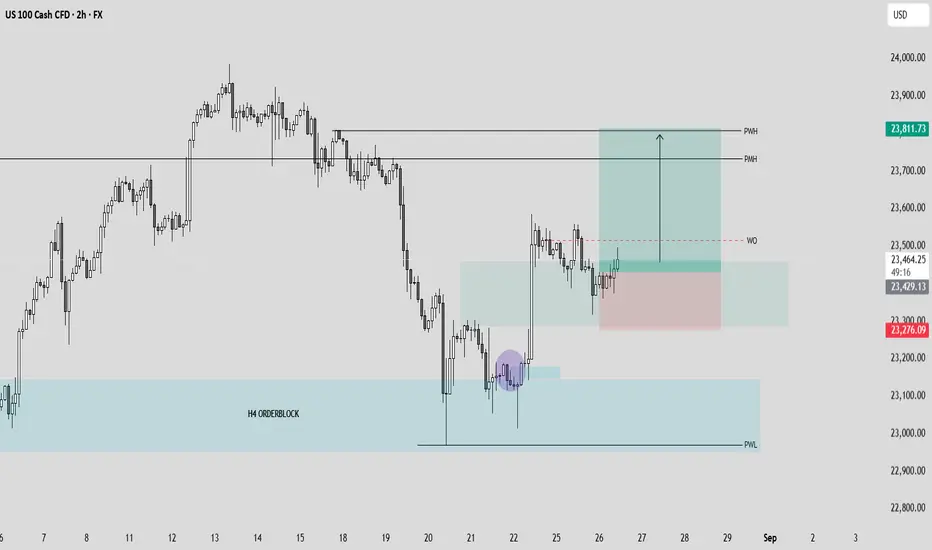
NASDAQ (US100) | Bullish Bias - Continuation in Play🔹 HTF (4H): Structure is bullish and respected. Momentum is strong to the upside, and higher lows remain intact — bullish intent confirmed.
🔹 MTF (30M): Refined structure shows price slashed through the recent internal OB but held — structure remains intact. A deeper sweep into an internal OB refined the order block further.
🔹 LTF (5M): Price switched character from bearish to bullish. Previous week we caught a bullish move, now looking for a second continuation setup toward highs this week.
🔹 Execution Plan: Waiting for price to mitigate the OB zone. Once tapped, we’ll attend bullish longs with precision.
🔹 Mindset Note: Patience is the edge — let smart money reveal itself before taking the next position.

NASDAQ 100 Near Key Support — Decision Zone AheadUSNAS100 – Overview
After Powell’s speech lifted market sentiment and boosted Fed cut bets, tech remains in focus ahead of Nvidia’s earnings (Aug 27) — a potential key catalyst for NASDAQ’s next big move.
🔹 Technical Outlook
Price action still looks bearish in the short term, with potential continuation down toward 23,295.
If the index stabilizes above 23,295, a bullish reversal can start building.
Otherwise, a break below 23,295 exposes the next supports at 23,165 and 23,045.
On the upside, holding above 23,520 would support renewed bullish momentum toward 23,695.
🔹 Key Levels
Support: 23,295 – 23,165 – 23,045
Resistance: 23,530 – 23,690 – 23,870
✅ Summary:
NASDAQ remains under pressure but is trading close to a decision zone. Stabilization above 23,295 could trigger a bullish rebound, while a breakdown would extend the bearish move. With Powell’s dovish tilt and 90% cut bets already priced in, all eyes now turn to Nvidia earnings to determine if tech can lead the next rally.

NAS100 H4 | Bearish Reversal off Pullback Resistance"NAS100 is rising towards the sell entry at 23,679.28, which is a pullback resistance and could reverse from this level ot the take profit.
Stop loss is at 23,939.64, which is a swing high resistance.
Take profit is at 23,292.38, which is a pullback support that alignss with the 50% Fibonacci retracement.
High Risk Investment Warning
Trading Forex/CFDs on margin carries a high level of risk and may not be suitable for all investors. Leverage can work against you.
Stratos Markets Limited (tradu.com ):
CFDs are complex instruments and come with a high risk of losing money rapidly due to leverage. 65% of retail investor accounts lose money when trading CFDs with this provider. You should consider whether you understand how CFDs work and whether you can afford to take the high risk of losing your money.
Stratos Europe Ltd (tradu.com ):
CFDs are complex instruments and come with a high risk of losing money rapidly due to leverage. 66% of retail investor accounts lose money when trading CFDs with this provider. You should consider whether you understand how CFDs work and whether you can afford to take the high risk of losing your money.
Stratos Global LLC (tradu.com ):
Losses can exceed deposits.
Please be advised that the information presented on TradingView is provided to Tradu (‘Company’, ‘we’) by a third-party provider (‘TFA Global Pte Ltd’). Please be reminded that you are solely responsible for the trading decisions on your account. There is a very high degree of risk involved in trading. Any information and/or content is intended entirely for research, educational and informational purposes only and does not constitute investment or consultation advice or investment strategy. The information is not tailored to the investment needs of any specific person and therefore does not involve a consideration of any of the investment objectives, financial situation or needs of any viewer that may receive it. Kindly also note that past performance is not a reliable indicator of future results. Actual results may differ materially from those anticipated in forward-looking or past performance statements. We assume no liability as to the accuracy or completeness of any of the information and/or content provided herein and the Company cannot be held responsible for any omission, mistake nor for any loss or damage including without limitation to any loss of profit which may arise from reliance on any information supplied by TFA Global Pte Ltd.
The speaker(s) is neither an employee, agent nor representative of Tradu and is therefore acting independently. The opinions given are their own, constitute general market commentary, and do not constitute the opinion or advice of Tradu or any form of personal or investment advice. Tradu neither endorses nor guarantees offerings of third-party speakers, nor is Tradu responsible for the content, veracity or opinions of third-party speakers, presenters or participants.

US100 SELL IDEASellers has fully stepped in again today on this pair. Looking at the daily timeframe, we can see how price resisted the high one more time. We may continue to see bearish trend development for the rest of the coming weeks .

NASDAQ NAS100 at a Crossroads: Riding Nvidias Surge with CautionThe immediate reaction to Nvidia's stellar earnings has been decidedly bullish, propelling the NASDAQ higher. We saw a classic "buy the rumor, sell the news" event where the "news" was so powerful it triggered a "fear of missing out" (FOMO) rally with a healthy correction on Friday.
In the next one to two weeks, the near-term bias is bullish, but with extreme caution. The market has received the fundamental "all-clear" it was waiting for from its most important company. However, the index is now technically overextended and sentiment is euphoric, making it vulnerable to a short-term pullback or consolidation. The primary trend, however, remains bullish IMO.
1. The Catalyst: Nvidia Earnings
Nvidia didn't just beat expectations; it shattered them and raised future guidance, validating the entire AI investment thesis.
Revenue & EPS: Significant beats on both the top and bottom lines.
Guidance: Q2 revenue guidance of ~$28B was vastly higher than analyst estimates of ~$26.6B, demonstrating unprecedented demand for its Blackwell and Hopper architecture chips.
Data Center: Revenue of $22.6B, up 427% year-over-year, is the core of the story. This shows that AI infrastructure spending is not slowing; it's accelerating.
Stock Split: The announcement of a 10-for-1 stock split adds a psychological boost for retail investors, improving accessibility and reinforcing bullish sentiment.
Analyst Interpretation: This wasn't just a quarterly report; it was a fundamental confirmation that the AI revolution has tangible, massive earnings power. It alleviated fears that the AI trade was a bubble. For the NASDAQ, which is market-cap weighted and heavily influenced by NVDA, this was rocket fuel.
2. Technical Analysis (One-Day Timeframe Post-Earnings)
Price Action: The NASDAQ gapped up powerfully at the open, breaking cleanly above its previous consolidation range. This was a strong bullish signal.
Volume: The rally was accompanied by massive volume, confirming broad institutional participation. This wasn't a low-volume grind; it was a conviction move.
3. Macro & Fundamental Backdrop
Interest Rates: The market is currently pricing in a higher-for-longer stance from the Fed. However, recent economic data (PMIs, jobless claims) has shown slight signs of softening, which keeps hopes alive for a potential rate cut later in the year. A stable, non-accelerating rate environment is acceptable for tech stocks, especially those like Nvidia with explosive earnings growth that outweighs rate concerns.
Geopolitics: While always a risk (U.S.-China tensions, elections), the market has largely shrugged off these concerns for now, choosing to focus on the stellar corporate fundamentals.
Market Breadth: A key watch-out. The rally has been narrow, led primarily by the "Magnificent 7" (now perhaps the "Fab 1" - Nvidia). For the rally to be sustainable, we need to see broader participation from other sectors and smaller-cap stocks within the NASDAQ.
4. Likely Outcome for the Next 1-2 Weeks: Bullish with a Caveat
Bullish Scenario (60% Probability):
The momentum from Nvidia is likely to carry the NASDAQ higher in the very near term. We could see a continued "melt-up" towards 17,400-17,500 as underinvested funds are forced to chase performance and add equity exposure. Any dip will likely be shallow and bought aggressively, with the 17,000 level holding firm.
Consolidation/Pullback Scenario (35% Probability):
This is the most likely healthy outcome. After such a massive, emotion-driven surge, the market is likely to need a period of digestion. We could see the NASDAQ chop sideways for a week or two to work off the overbought conditions. This would reset the momentum indicators and allow the market to build a new base for the next leg higher. This is not a bearish signal; it is a strengthening signal.
Bearish Reversal Scenario (5% Probability):
A sharp reversal below the 17,000 support level and a fill of the earnings gap (~16,900) would be a significant warning. This would likely require a new, negative macro catalyst (e.g., unexpectedly hot inflation data, a major geopolitical escalation) that forcefully changes the interest rate narrative.
Trading & Investment Implication
For Bulls / Existing Longs: Hold positions. Consider taking partial profits on extreme strength, but avoid selling your entire position. The trend is your friend. Use any pullback to the 17,000 support as a potential buying opportunity.
For New Entrants: Chasing the green spike is high-risk. Be patient. Wait for the inevitable pullback or period of consolidation to establish a position. The risk/reward is poor on the day after a massive gap up.
For Bears: Fighting this tape is exceptionally dangerous. The fundamental news from NVDA is a game-changer for the index. Shorting based solely on overbought conditions is a quick path to losses.
Final Analyst Call: The next week is likely bullish with high volatility, potentially extending gains. However, the following week is highly susceptible to a consolidation or pullback as the initial euphoria settles. The overall trajectory for the next two weeks is cautiously bullish, with the understanding that a 2-4% pullback is a normal and healthy part of a strong uptrend.
The burden of proof is now on the bears to prove they can wrestle control back from a market that just received the best possible news from its most important constituent.
Not financial advice, this is just my opinion.

NAS100 UPDATE: Potential TargetsDear Friends in Trading,
Keynote:
I am only labeling Friday's candle due to the fundamental sentiment for September.
But even technically, a bearish structure was broken on Friday,
potentially signaling an even stronger bullish continuation.
How I see it:
1) Demand will only pile up from here.
2) Immediate resistance at 23550 is strong and may force a small correction.
INTERESTING: ✅✅✅
Check out a 3Day candle that closed on Friday.
A new 3D candle starts on Monday - Keeping in mind the strength.
I sincerely hope my point of view offers a valued insight
Thank you for taking the time study my analysis.
PS:
I really apologies for changing the format again.
I am aiming to find the golden thread between my eyes for work,
and simplified clarity for ideas.
I will settle on a standard template soon.

NSDQ100 ovrsold rebound supported at 23350US equities advanced, with the S&P 500 +0.41%, closing just shy of record highs, as solid US data offset Fed uncertainty. Conference Board consumer confidence (97.4 vs. 96.5 exp) and core capital goods orders (+1.1% vs. +0.2% exp) signaled resilience, while the Richmond Fed index (-7 vs. -11 exp) improved.
Focus today is Nvidia earnings, which could be pivotal for NASDAQ 100 given its AI leadership and sensitivity to US-China trade tensions. Asian tech strength overnight reflects bullish positioning ahead of results.
Meanwhile, hedge funds are running record shorts in VIX, betting on low volatility—an extreme stance that has historically preceded sharp market moves, something to watch around Nvidia’s release.
In the UK, BoE’s Mann argued for keeping rates high for longer, but impact is limited for US tech trading focus.
For NASDAQ 100: near-record highs, tech sentiment riding on Nvidia, but positioning risk in volatility markets could amplify any surprise.
Key Support and Resistance Levels
Resistance Level 1: 23700
Resistance Level 2: 23830
Resistance Level 3: 23920
Support Level 1: 23350
Support Level 2: 23250
Support Level 3: 23100
This communication is for informational purposes only and should not be viewed as any form of recommendation as to a particular course of action or as investment advice. It is not intended as an offer or solicitation for the purchase or sale of any financial instrument or as an official confirmation of any transaction. Opinions, estimates and assumptions expressed herein are made as of the date of this communication and are subject to change without notice. This communication has been prepared based upon information, including market prices, data and other information, believed to be reliable; however, Trade Nation does not warrant its completeness or accuracy. All market prices and market data contained in or attached to this communication are indicative and subject to change without notice.

NAS100 - Potential TargetsDear Friends in Trading,
Keynote:
Resistance & Demand is still the same
Yesterday was limited - Overlap was one sided - UK banks were closed
I am only biased LONG - due to High Timeframe BIAS - bigger picture.
How I see it:
1) A break above or a break below is possible
2) BELOW - I will wait for reaction in strong demand zone.
3) ABOVE - There is some imbalance to fill, but I will close before resistance.
4) A clear and decisive break above 23580 will support price higher.
5) Between resistance and demand we are still lingering within -
INTERNAL STRUCTURE.
Let's see:
Price is setting up at same confluence as yesterday.
I sincerely hope my point of view offers a valued insight
Thank you for taking the time study my analysis.

NAS100 ABOUT TO CONTINUE TO THE UPSIDEHello traders Here's my point of view about PEPPERSTONE:NAS100
TECHNICALLY:
Last week on FRIDAY I covered this massive impulse. We got a 1:3 RR trade. Still looking bullish for me.
As long as we stay ABOVE MONDAY DAILY LOW 23 300 we can consider to look for BUY entries but only if fundamentals, confluences & confirmations. Otherwise, the area will be completely invalidated and we will have a deeper pullback/ retracement
You may find more details in the chart!
Thank you and Good Luck! MAKE SURE TO STAY STRICT WITH YOUR RISK MANAGEMENT!
PS: Please support with a like or comment if you find this analysis useful for your trading day.
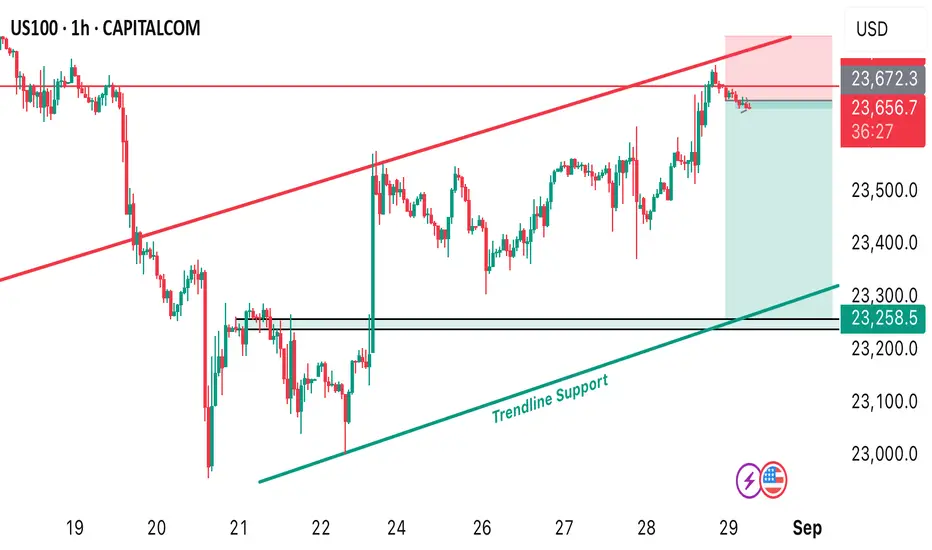
US100-POTENTIAL SELL IDEAThe long awaited sell opportunity that we envisaged on US100 is confirmed today and we’re ready to ride the sell from the current market price. Our first take profit level is at 23258.5 our stop loss is at 23699
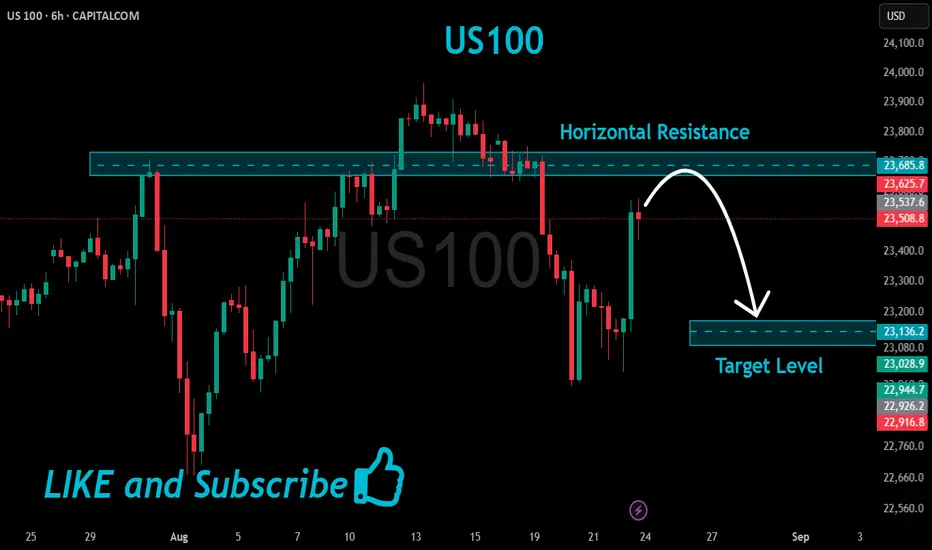
US100 Resistance Ahead!
HI,Traders !
#US100 is trading in an
Uptrend and Silver shot
Up sharply today and it
Is now locally overbought
So after the retest of the
Horizontal resistance above
At 23685.8 from where we
Will be expecting a local
Bearish move down!
Comment and subscribe to help us grow !
NAS100 H4 | Bearish drop offNAS100 has rejected off the sell entry of 23,475.21, which is a pullback resistance that lines up with the 38.2% Fibonacci retracement and could drop from this level to the downside.
Stop loss is at 23,575.82, which is a pullback resitance that aligns with the 61.8% Fibonacci retracement.
Take profit is at 23,110.94, which is a swing low suport that is slightly below the 161.8% Fibonacci extension.
High Risk Investment Warning
Trading Forex/CFDs on margin carries a high level of risk and may not be suitable for all investors. Leverage can work against you.
Stratos Markets Limited (tradu.com ):
CFDs are complex instruments and come with a high risk of losing money rapidly due to leverage. 65% of retail investor accounts lose money when trading CFDs with this provider. You should consider whether you understand how CFDs work and whether you can afford to take the high risk of losing your money.
Stratos Europe Ltd (tradu.com ):
CFDs are complex instruments and come with a high risk of losing money rapidly due to leverage. 66% of retail investor accounts lose money when trading CFDs with this provider. You should consider whether you understand how CFDs work and whether you can afford to take the high risk of losing your money.
Stratos Global LLC (tradu.com ):
Losses can exceed deposits.
Please be advised that the information presented on TradingView is provided to Tradu (‘Company’, ‘we’) by a third-party provider (‘TFA Global Pte Ltd’). Please be reminded that you are solely responsible for the trading decisions on your account. There is a very high degree of risk involved in trading. Any information and/or content is intended entirely for research, educational and informational purposes only and does not constitute investment or consultation advice or investment strategy. The information is not tailored to the investment needs of any specific person and therefore does not involve a consideration of any of the investment objectives, financial situation or needs of any viewer that may receive it. Kindly also note that past performance is not a reliable indicator of future results. Actual results may differ materially from those anticipated in forward-looking or past performance statements. We assume no liability as to the accuracy or completeness of any of the information and/or content provided herein and the Company cannot be held responsible for any omission, mistake nor for any loss or damage including without limitation to any loss of profit which may arise from reliance on any information supplied by TFA Global Pte Ltd.
The speaker(s) is neither an employee, agent nor representative of Tradu and is therefore acting independently. The opinions given are their own, constitute general market commentary, and do not constitute the opinion or advice of Tradu or any form of personal or investment advice. Tradu neither endorses nor guarantees offerings of third-party speakers, nor is Tradu responsible for the content, veracity or opinions of third-party speakers, presenters or participants.


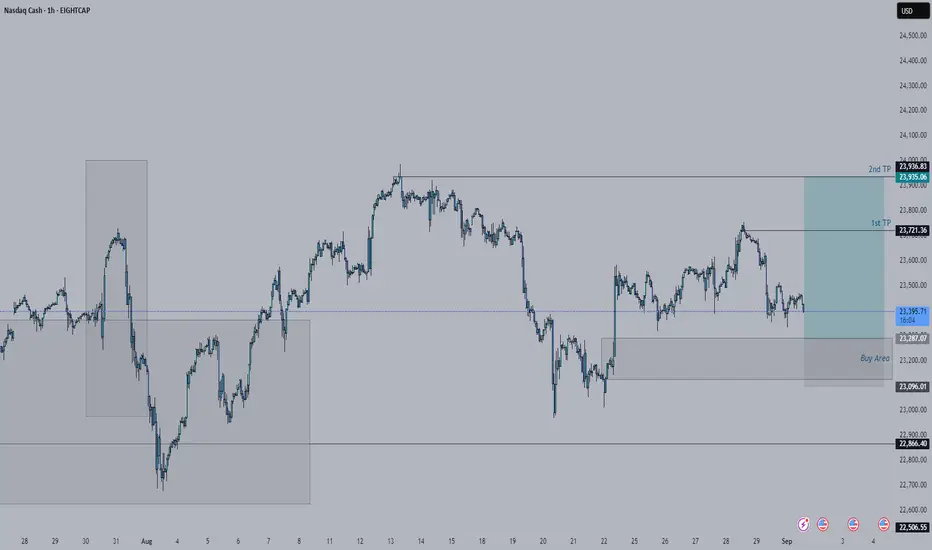
US100 – Elliott Wave Long-Term Outlook (Monthly)Key Points – US100 (Monthly, Elliott Wave)
🌐 Wave (1): Dot-com bubble peak (2000).
📉 Wave (2): Crash to 2002 lows.
🚀 Wave (3): Massive bull run (2009–2025), +4400%.
⚠️ Wave (4) – Expected Correction:
Possible 70–80% retracement.
Targets: 11,500 → 6,500 → 4,770–4,081.
📈 Wave (5) – Future Projection:
Potential long-term expansion toward 250,000+.
🔑 Levels to Watch:
Current support: 23,400.
Major resistance: 35,300.
Long-term target: 261,800

NasDaq Bullish analysisNasDaq is currently retracing back on the gap it made previous movement it had. Bigger time frame NasDaq is buy, the movement it is making at the moment is just a reaction before it pushes back to the upside.
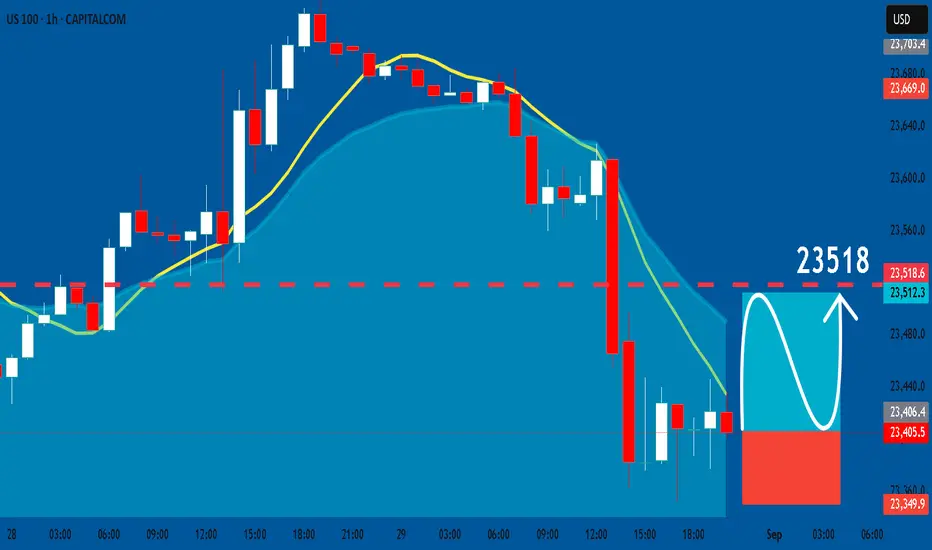
US100: Bullish Continuation & Long Trade
US100
- Classic bullish formation
- Our team expects growth
SUGGESTED TRADE:
Swing Trade
Buy US100
Entry Level - 23405
Sl - 23349
Tp - 23518
Our Risk - 1%
Start protection of your profits from lower levels
Disclosure: I am part of Trade Nation's Influencer program and receive a monthly fee for using their TradingView charts in my analysis.
❤️ Please, support our work with like & comment! ❤️
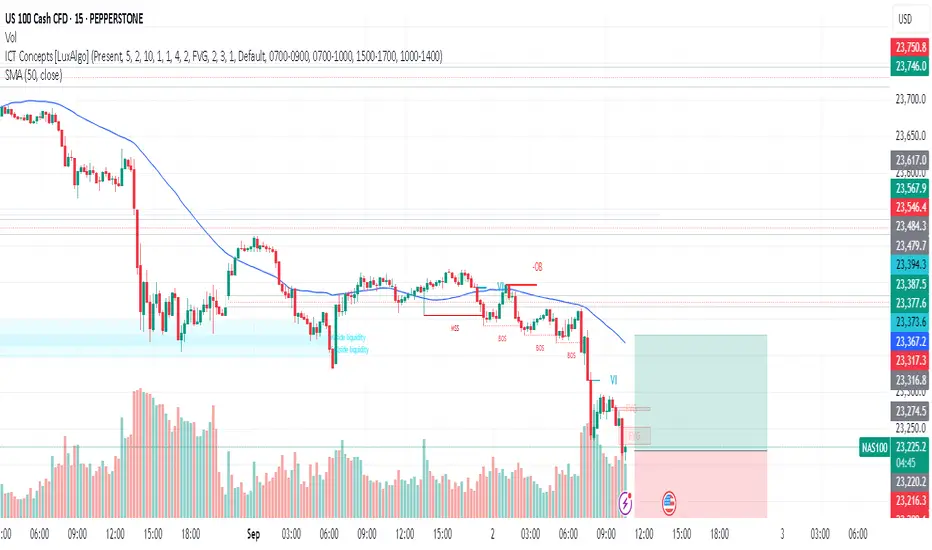
NASDAQ 1H STRUCTURE : ICT + SMC Nasdaq Buying Zones
Choch + OB Area Buy Zone : 23,430
FVG Buy Zone : 23,415
TS Buy Zone : 23,3370
Nasdaq Selling Zones
FVG SELL ZONE : 23,500 / 23,535
Thats All The Zones
Good Luck With Your Trade 🔥

NAS100- OPPORTUNITY OF A LIFETIMETeam, I was patiently wait for the NAS100 hit 23200 - liquidity sweep before entering
NOW lets jump on board at 23220-23200 with STOP LOSS AT 23120
Target 1 at 23315 - take 50% partial and bring stop loss to BE
NEXT target at 23365-95 - take 30%
the rest at 23415-23550
LETS GO AND MAKE MILLION TOGETHER.
MONDAY EYESIt is better to know what we are up against already, I suspect the push has already been exhausted and might take a break through some small buys to the gap that is over the zone and probably continue lower, gathering sellers into what might turn out to be an overall weekly buy, Anyway, we let the market direct us.
Whats your take?
