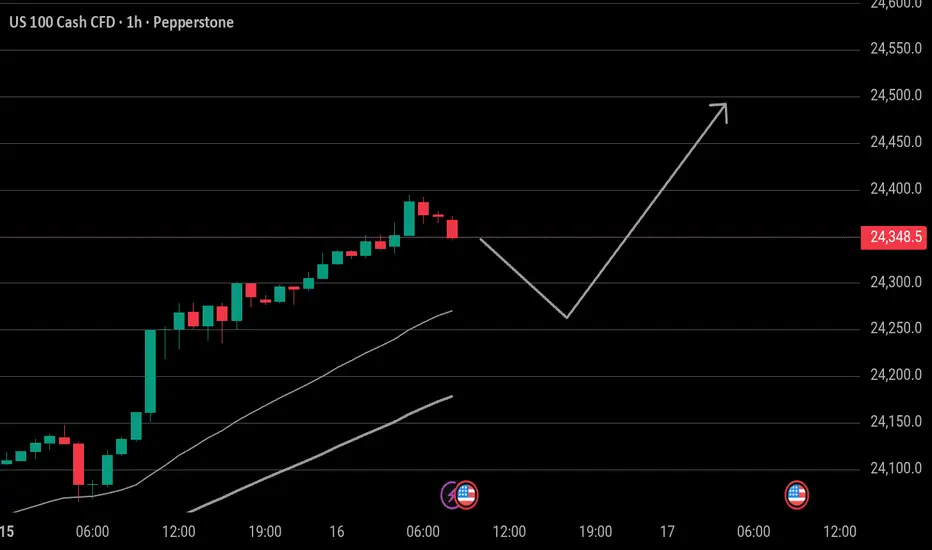
NasdaqNasdaq continued to renew highs overnight. This overbought region is likely to trigger a pullback with profit-taking to the 24250 range. Today we'll see the Retail Sails economic data, which could be favorable for the technology sector and lead to 24500.
Trade ideas
US100 Rally Supported by Fed Expectations and Cooling InflationUS100 Rally Supported by Fed Expectations and Cooling Inflation
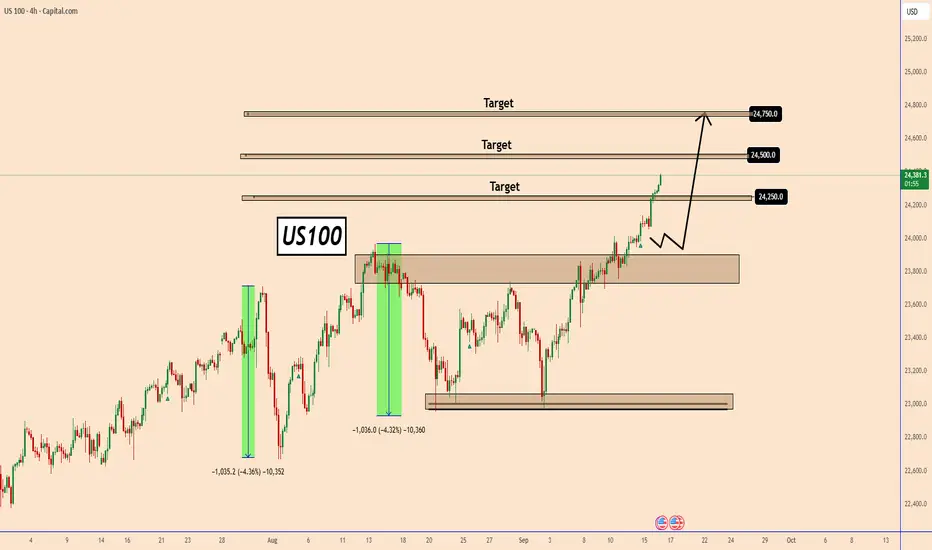
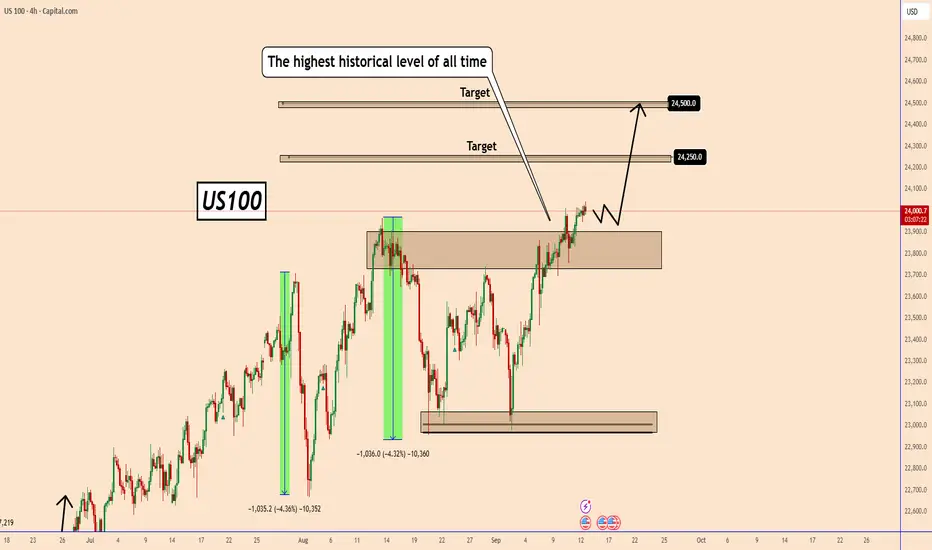
From our last analysis, indices have continued to rise. The US100 already hit the first target and is now close to the second one.
With the market expecting multiple Fed rate cuts this year, bullish momentum stays strong and shows no clear signs of reversal.
This outlook is also backed by easing inflation data. Still, we should be cautious — since the move has already played out, it may be wise to secure profits before the FOMC meeting.
The US100 could rise further once the outlook becomes clearer, but it may also take some time before reaching new highs.
Next targets: 24,500 and 24,750.
You may find more details in the chart!
Thank you and Good Luck!
❤️PS: Please support with a like or comment if you find this analysis useful for your trading day❤️

NAS100 Buy Entry’s Clean, R:R 2.00 — Setup Locked & Loaded!Hey traders,
Here’s my NAS100 setup based on the 1-hour chart:
🟢 Buy Entry: 23998.77
🔴 Stop Loss: 23884.81
🎯 TP1: 24045.42
🎯 TP2: 24097.67
🎯 TP3: 24225.56
Risk/Reward Ratio: 2.00
Every like you drop is pure fuel for me to keep sharing these setups.
Big thanks to everyone standing by and showing support.

Nasdaq long position Nasdaq headed for $25,000. Recently Nasdaq surpassed my target of $24,000 and seems like the bullish momentum won't be stopping anytime soon. I have optimism of Nasdaq reaching $26,000 before the year ends.
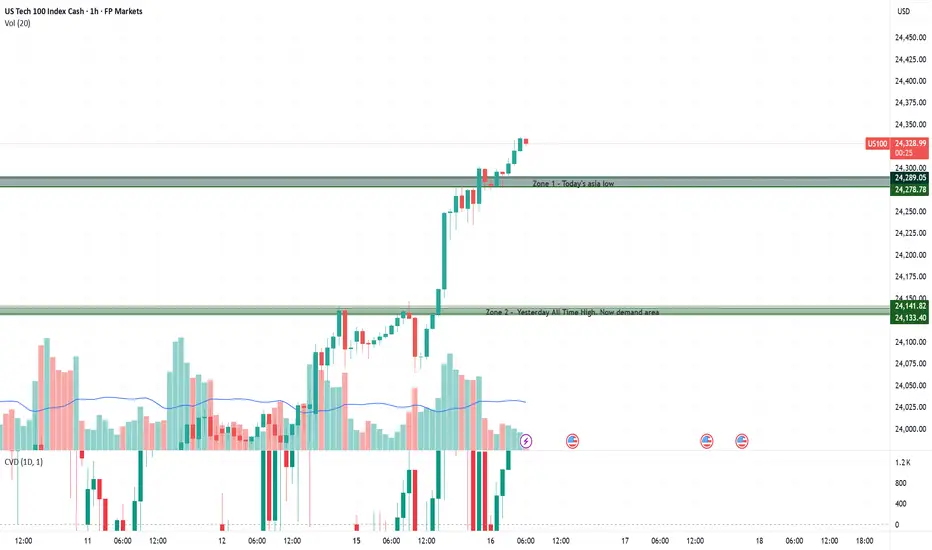
NAS100 Trading Zones – Navigating All-Time HighsThe Nasdaq is trading at all-time highs, which means there are no established sell zones above. In this environment, price is in full discovery mode. Every new tick higher sets fresh records, and volatility often picks up as traders probe for tops. That makes it difficult to fade strength, shifting the focus toward demand zones below as key areas for potential pullbacks.
🔹 Zone 1 – Today’s Asia Low (24,278–24,289)
This zone marks the intraday low from the Asian session and serves as the nearest short-term demand. A revisit here could attract buyers for a bounce, while a decisive break lower would signal loss of momentum and invite deeper retracement.
🔹 Zone 2 – Yesterday’s All-Time High, Now Demand (24,133–24,141)
Yesterday’s record high has flipped into a demand zone. As long as price holds above this level, the bullish structure stays intact. A strong rejection here favors continuation higher, but failure to hold could open the door to sharper downside.
Sentiment in the US100 remains cautiously optimistic. Softer labor data and easing producer prices have strengthened expectations of Fed rate cuts, while strong momentum in select tech names, including Oracle’s upbeat cloud outlook, continues to drive the index higher. Still, with price trading near all-time highs, volatility is elevated and the backdrop fragile, leaving traders mindful that optimism rests heavily on the Fed delivering on dovish expectations.
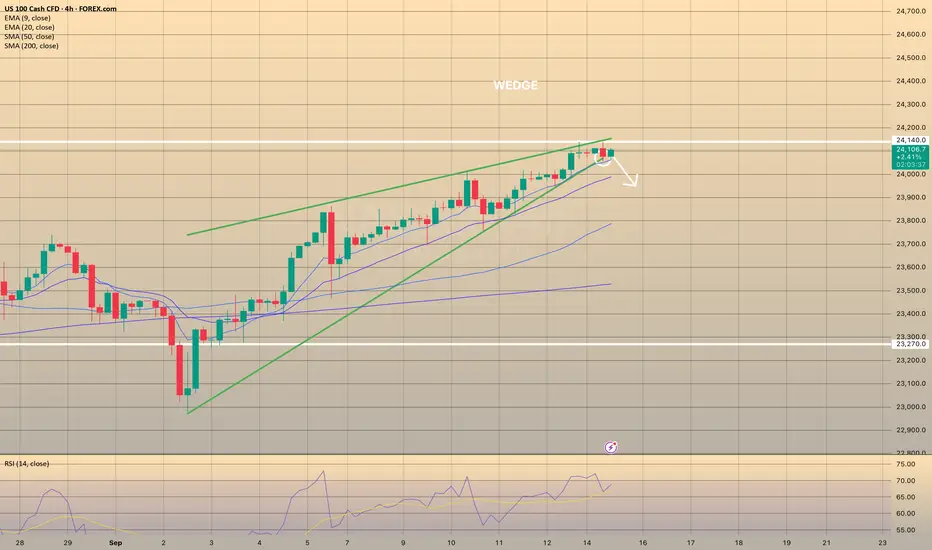
PullbackThe price is at the channel resistance and we have some good hourly divergences on RSI and MACD. Some pullback may start today. Retest of the green trendline at some point makes sense, but it may be too early for this, it can bounce and go higher from previous peaks.

NAS100 Pullback into Fibonacci Zone: Watching for Bullish Break📊 NASDAQ 100 (NAS100) Update 📊
The NAS100 is in a strong bullish trend 🟢📈, clearly visible on the 4H chart ⏰ with consistent higher highs and higher lows 🔼🔼.
Currently, price has pulled back 🔽 right into my optimal entry zone 🎯 based on the Fibonacci retracement 🔢. From here, I’ll be watching closely for a bullish break of structure (BOS) 🔓 on the 15M timeframe ⏰ — that would be my signal to look for a long entry 🚀.
⚠️ This breakdown is educational only and not financial advice. 📚

Nasdaq-100 Wave Analysis – 15 September 2025
- Nasdaq-100 broke key resistance level 24000.00
- Likely to rise to resistance level 25000.00
Nasdaq-100 index recently broke above the key resistance level 24000.00 (upper border of the narrow sideways price range inside which the index has been trading from July).
The breakout of the resistance level 24000.00 accelerated the active impulse wave v of the higher order impulse wave 5 from June.
Given the clear daily uptrend, Nasdaq-100 index can be expected to rise to the next resistance level 25000.00, target for the completion of the active impulse wave v.
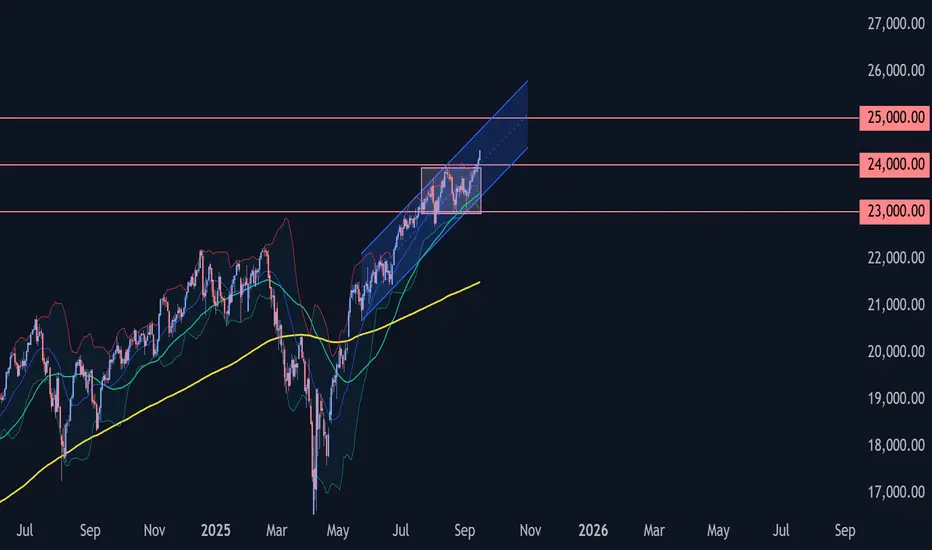
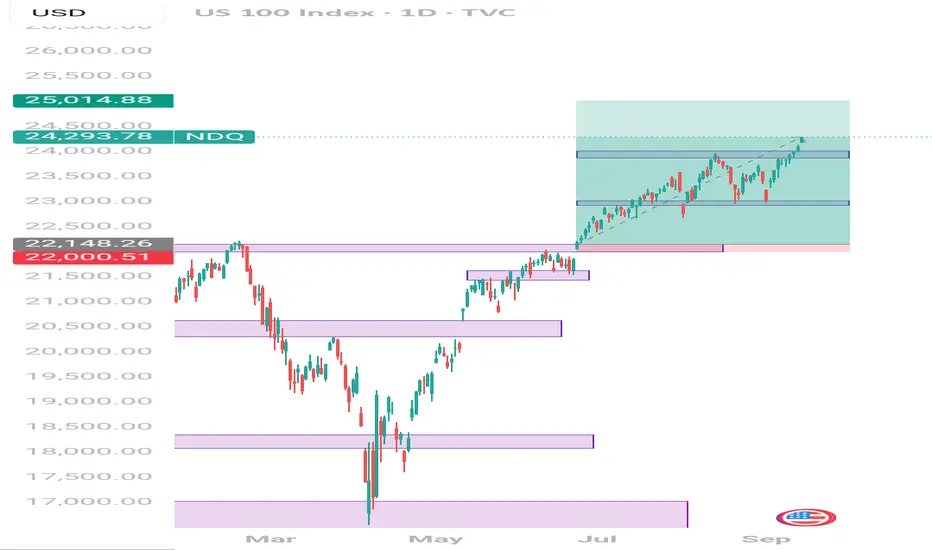
NASDAQ Approaching a critical +1 year Resistance.Nasdaq (NDX) is close to hitting our 24500 bullish target, which as we explained on our previous analysis represents a +6.78% rise, the technical Bullish Leg of the Channel Up that started back in mid-May.
This pattern is however headed towards a +1 year Resistance level, the Higher Highs trend-line that started on the July 11 2024 High. Technically, we should be expecting a rejection there and pull-back towards at least the 1D MA50 (blue trend-line), if not the 1D MA100 (green trend-line), which is where an identical Channel Up in 2024 that topped on December 16 2024, found Support at.
Even the 1D RSI sequences among the two patterns look similar. As a result, there are high probabilities to see a short-term correction there, which will in turn fuel the end-of-year rally. Our new medium-term Target is 25000.
-------------------------------------------------------------------------------
** Please LIKE 👍, FOLLOW ✅, SHARE 🙌 and COMMENT ✍ if you enjoy this idea! Also share your ideas and charts in the comments section below! This is best way to keep it relevant, support us, keep the content here free and allow the idea to reach as many people as possible. **
-------------------------------------------------------------------------------
💸💸💸💸💸💸
👇 👇 👇 👇 👇 👇

NDX SHORT 1HHarmonic Bearish Divergence at D Point.
Expeting it will break its HL and make start printing few LL LH

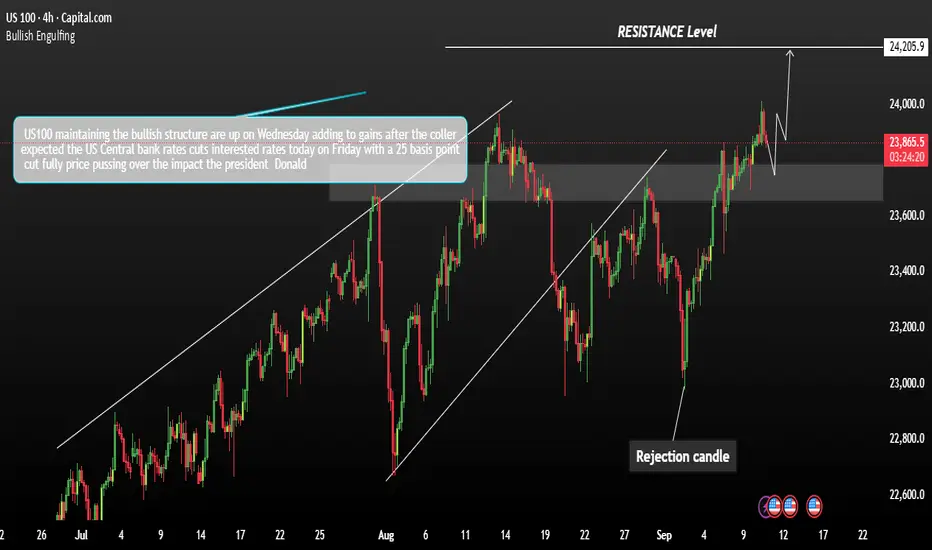
USNASDEQ 100 Futures are Price consolidation High Top US100 futures are higher on Wednesday, extending gains after a cooler-than-expected US Producer Price Index (PPI) report. The data eased inflation concerns, supporting risk sentiment. Oracle (ORCL) shares are surging, up more than 30% in pre-market trading following strong earnings and upbeat guidance.
The index remains bullish in structure. Price is expected to test the support area near 23,200. As long as the index holds above this level, momentum favours a move higher toward 24,200 in the next leg up.
You may find more details in the chart.
Trade wisely best of Luck.
Ps; Support with like and comments for better analysis Thanks for Support.
UntaggedWe were not tagged because the market did not draw to the zone, went just for the Gap, we move on!

US100 Hits All-Time HighUS100 Hits All-Time High
Yesterday, US100 reached a new record high at 24040, confirming the strength of its bullish trend.
With U.S. inflation cooling, the market is now expecting the Federal Reserve to cut interest rates, possibly starting this cycle and continuing in the months ahead.
Lower rates tend to support stocks and indices, giving the economy room to breathe after a long period of tight monetary policy.
I expect US100 to continue rising toward 24500, with intermediate targets at 24250 and 24500 in the coming week.
You may find more details in the chart!
Thank you and Good Luck!
❤️PS: Please support with a like or comment if you find this analysis useful for your trading day❤️
2000 vs 2008 vs 2022 - Are we yellow?Where do you think we are? Red? Or Green?
Are we at a bottom before we see a blow-off top coming?
Or are we in recessionary beginnings like 2008?

Nas100 Trade Set Up Sep 15 2025www.tradingview.com
Price broke PDH and has made a ATH so i will wait for a pull back in to the zone before looking for a continuation higher

NAs100 ShortElite Analysis
Confirmation met
Price reacting off structural liquidity
Targeting lower liquidity pools

NASDAQ INDEX (US100): To the New Highs!
US100 index successfully broke and closed above a major
daily resistance cluster on Friday.
The index will likely grow more and reach new highs soon.
The next resistance is 24300
❤️Please, support my work with like, thank you!❤️
I am part of Trade Nation's Influencer program and receive a monthly fee for using their TradingView charts in my analysis.

Futures steady ahead of Fed cutFutures steady ahead of Fed cut
U.S. stock futures held flat on August 15 ahead of the Sept. 17–18 Fed meeting, where a 25-bps cut is widely expected. Markets price about 70 bps of easing by year-end, though Powell may highlight inflation risks to temper dovish bets. Retail sales Tuesday will be the last key data before the decision.
Global markets were subdued: oil ticked higher on Ukraine-Russia tensions, the dollar eased, and Asian stocks firmed with South Korea’s Kospi hitting records. The Bank of Canada may also cut this week, while the BoE and BoJ are likely to stay on hold.
Traders are watching today’s Empire State manufacturing survey (8:30 AM EDT), the Senate vote on Fed nominee Stephen Miran, speeches from ECB’s Lagarde and Schnabel, and EU Council President Costa’s visit to Cyprus ahead of its 2026 presidency.
USNAS100 Holds Below 24,115 as Fed Rate Decision LoomsUSNAS100 – Overview
Markets are awaiting the upcoming Federal Reserve rate decision, which will set the tone for the next move:
A 50 bps cut would likely trigger strong bullish momentum.
A 25 bps cut may result in a more moderate reaction.
📉 Bearish scenario: For now, the Nasdaq shows bearish momentum while trading below 24,115, with downside targets at 23,935 → 23,870 → 23,700.
📈 Bullish scenario: A confirmed 1H close above 24,115 would shift bias bullish, opening the way to 24,245 → 24,350.
Key Levels
Pivot: 24,115
Resistance: 24,245 – 24,350
Support: 23,940 – 23,870 – 23,700

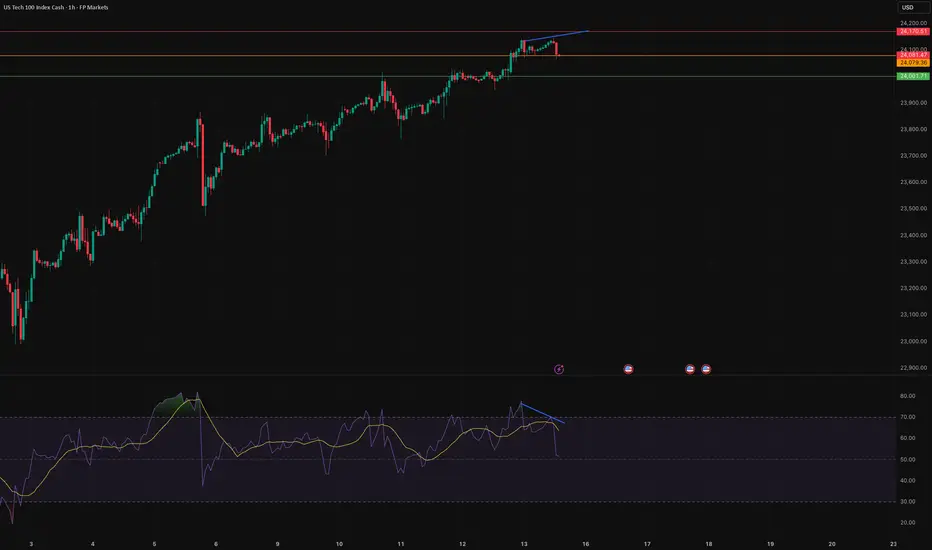
US100 Bearish reversalUS100 BEARISH REVERSAL
There is a divergence at 1H TF and now big juicy red candle has confirmed it so we might see some selling pressure.

US 100 Index – Assessing a Crucial Week for Tech StocksAs a trader it can be helpful to spend some time on a Sunday afternoon sitting at your trading desk gathering your thoughts and preparing for the week ahead. Checking the Pepperstone economic calendar to assess the scheduled risk events in terms of timing and importance can be a useful part of this process. This upcoming week is quite impressive, packed with central bank meetings and economic data that could impact many, if not all, of the major markets available to trade on the Pepperstone platform.
The standout event could be the Federal Reserve (Fed) interest rate announcement on Wednesday at 1900 BST, which is followed closely by the press conference led by Chairman Powell, which starts at 1930 BST. However, Thursday’s Bank of England interest rate decision at 1200 BST, or Friday’s Bank of Japan interest rate decision due at 0400 BST, and then the press conference led by Governor Ueda may also keep traders on volatility alert.
The US 100 index is the focus of today’s commentary as it can be more sensitive than other indices to interest rate moves made by the Fed.
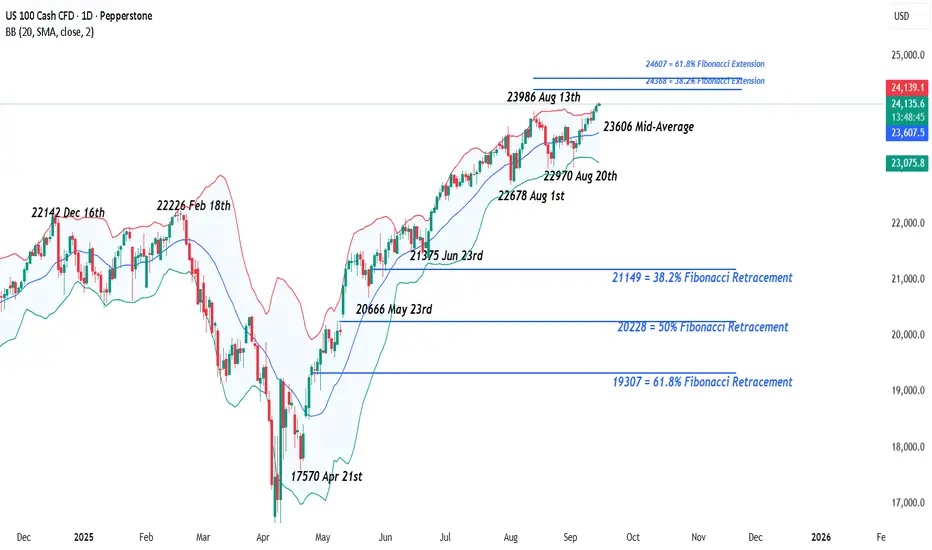
As can be seen on the daily Pepperstone chart above, the US 100 index has experienced a period of higher highs and higher lows since the 2025 low was hit way back at 16290 on April 7th, helped in no small part by a re-engagement of traders with the potential of artificial intelligence and what it could mean for the future earnings of the leading companies in this space. This AI driver is still in very much in play but may take a backseat this week due to the Federal Reserve rate decision.
Since the surprise weaker than expected US employment report on August 1st (Non-farm payrolls) market expectations for Fed rate cuts have increased, helping to support the latest US 100 uptrend from its August 1st lows at 22678 to print numerous record closing highs, the latest being Friday at 24096.
For the Fed interest rate decision on Wednesday, a 25bps (0.25%) cut is fully priced by traders, but there is a small outside chance of a 50bps (0.5%) cut, a decision which, if it happened, could generate equal amounts of uncertainty that policy makers feel they could be behind the curve in supporting the economy and that the labour market is weakening faster than anticipated, but also surprise that the Fed may be willing to cut rates faster, which as a general rule can be supportive of US100 index gains.
The press conference may also be a relevant consideration for US 100 price volatility. Traders will be keen to hear Chairman Powell’s stance on the possibility for further rate cuts, with economists predicting just one more 25bps cut into the end of 2025, while the market is pricing another 2 25bps reductions. Any comments he makes on the independence of the US central bank, with an appeal court ruling expected imminently on whether President Trump has the authority to sack Fed Governor Cook, as well as his thoughts on the deterioration of the US labour markets and direction of inflation could also be important.
Technical Update: New All-Time Highs Posted
After reaching a new all-time high of 24142 on Friday, the market continues to show signs of a positive trend, which has been evident since the low of 16290 recorded on April 7th.
As the chart above shows, the market has formed a pattern of higher highs and higher lows. While this doesn’t guarantee that prices will continue to rise, the recent new peak suggests there might be further upward momentum ahead.
Although positive sentiment appears to remain in place, this week’s upcoming data releases and interest rate decision could significantly impact price movements.
As a result, it may be important to identify and then monitor key support and resistance levels in case an increased spell of volatility emerges.
Potential Resistance Levels:
Following the recording of the latest all-time high at 24142 on Friday, traders may be anticipating continued attempts at upward momentum to extend the current uptrend.
The outlook suggests that further attempts to push toward the next resistance levels could emerge in the coming week.
With the US 100 index now entering uncharted territory, traders may be turning their attention to Fibonacci extension levels based on the August 13th to 20th sell-off. The 38.2% extension is at 24368, and if this level is breached, the next potential resistance could be 24607, the 61.8% extension.
Potential Support Levels:
The US 100 recently closed back above the rising Bollinger mid-average, currently at 23606, and so this level could act as the first initial support for the week. If retested, it may be important to monitor whether the market can hold above it on a closing basis.
A closing break below 23606 wouldn’t necessarily signal a negative shift, but it could open the door for a test of 22970, which is the low from August 20th, and potentially lower if that level fails to hold.
The material provided here has not been prepared accordance with legal requirements designed to promote the independence of investment research and as such is considered to be a marketing communication. Whilst it is not subject to any prohibition on dealing ahead of the dissemination of investment research, we will not seek to take any advantage before providing it to our clients.
Pepperstone doesn’t represent that the material provided here is accurate, current or complete, and therefore shouldn’t be relied upon as such. The information, whether from a third party or not, isn’t to be considered as a recommendation; or an offer to buy or sell; or the solicitation of an offer to buy or sell any security, financial product or instrument; or to participate in any particular trading strategy. It does not take into account readers’ financial situation or investment objectives. We advise any readers of this content to seek their own advice. Without the approval of Pepperstone, reproduction or redistribution of this information isn’t permitted.