nas100 1h🔹 Overall Outlook and Potential Price Movements
In the charts above, we have outlined the overall outlook and possible price movement paths.
As shown, each analysis highlights a key support or resistance zone near the current market price. The market’s reaction to these zones — whether a breakout or rejection — will likely determine the next direction of the price toward the specified levels.
⚠️ Important Note:
The purpose of these trading perspectives is to identify key upcoming price levels and assess potential market reactions. The provided analyses are not trading signals in any way.
✅ Recommendation for Use:
To make effective use of these analyses, it is advised to manually draw the marked zones on your chart. Then, on the 5-minute time frame, monitor the candlestick behavior and look for valid entry triggers before making any trading decisions.
Market insights

NASDAQ Head and Shoulers Pattern - Strong Bearish SignalHead and Shoulders pattern has been confirmed by a break of neckline.
Catch your short entries from either above the right shoulder or when price drops below the neckline and sell to the next support zones.

NAS100 Trade Set Up Dec 9 2025Price remains under bearish pressure making LH/LL on the 1h so i will wait for a reaction from London lows or PDL to then come back up to sweep internal BSL/LRLR to then make internal bearish structure to continue lower to SSL/demand

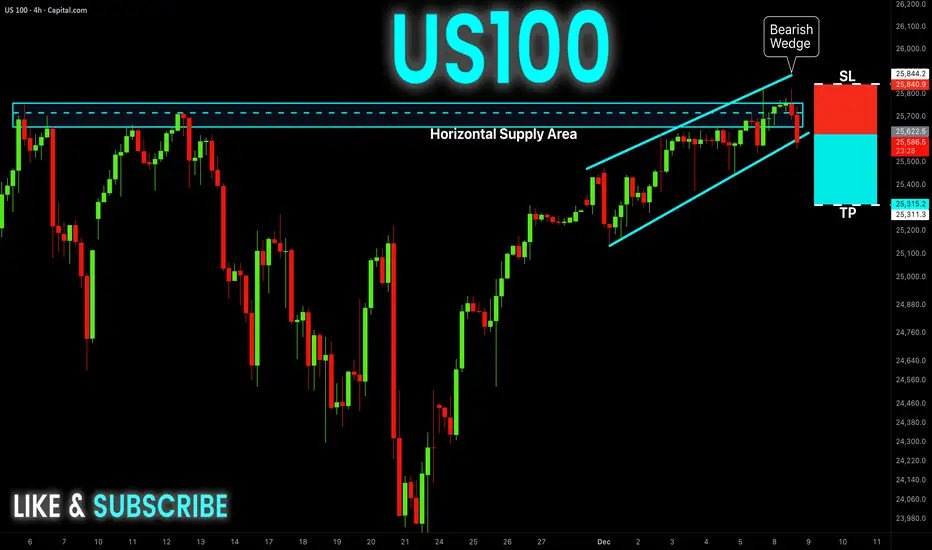
US100 Free Signal! Sell!
Hello,Traders!
US100 has rejected a major supply zone while breaking down from a bearish wedge, sweeping buy-side liquidity before shifting order-flow bearish. This SMC structure signals distribution at premium and a move toward discount levels below.
--------------------
Stop Loss: 25840
Take Profit: 25315
Entry: 25622
Time Frame: 4H
--------------------
Sell!
Comment and subscribe to help us grow!
Check out other forecasts below too!
Disclosure: I am part of Trade Nation's Influencer program and receive a monthly fee for using their TradingView charts in my analysis.
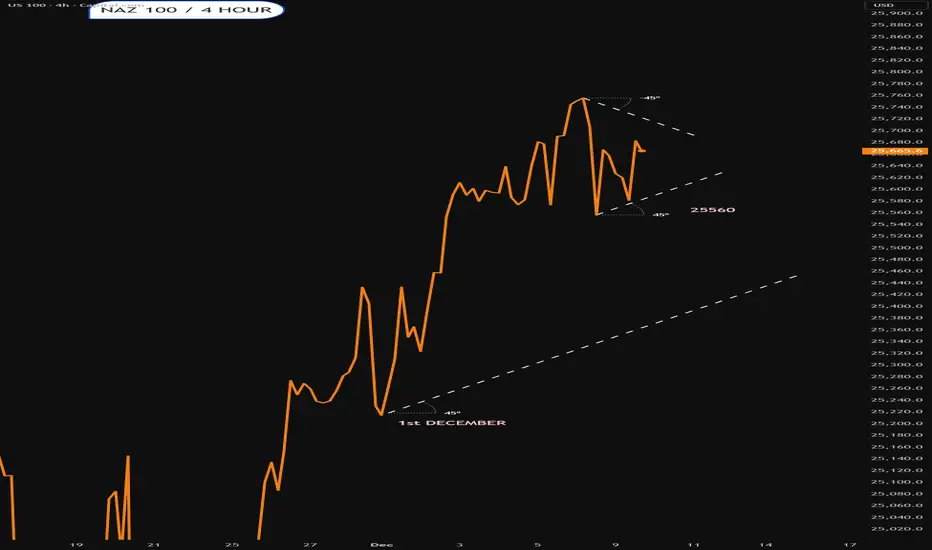
Naz 100Not looking too happy
Rez starts at 25.7K area
Could be just a pullback or it could be a top
Lets see what happens
Chasing the last train: how late entries ruin good trendsChasing the last train: how late entries ruin good trends
The picture is familiar.
The asset has already made a strong move, candles line up in one direction, chats are full of profit screenshots.
Inside there is only one thought: "I am late".
The buy or sell button is pressed not from a plan, but from fear of missing out.
This is how a classic "last train" entry is born.
This text breaks down how to spot that moment and how to stop turning each impulse into an expensive ticket without a seat.
How the last train looks on a chart
This situation has clear signs.
Long sequence of candles in one direction with no healthy pullback.
Acceleration of price and volatility compared to previous swings.
Entry happens closer to a local high or low than to any level.
Stop is placed "somewhere below" or moved again and again.
The mind focuses on other people’s profit, not on the original plan.
In that state the trader reacts to what already happened instead of trading a prepared setup.
Why chasing the move hurts the account
The problem is not just "bad luck".
Poor risk-reward .
Entry sits near an extreme. Upside or downside left in the move is small, while a normal stop needs wide distance. In response there is a temptation to push the stop further just to stay in.
Large players often exit there .
For them the trend started earlier. Where retail opens first positions, they scale out or close a part of the move.
Strategy statistics get distorted .
A system can work well when entries come from levels and follow a plan. Once late emotional trades appear in the mix, the math changes even if the historical chart still looks nice.
How to notice that the hand reaches for the last train
Knowing your own triggers helps.
This symbol was not in the morning watchlist, attention appeared only after a sharp spike.
The decision comes from news or chat messages, not from calm chart work.
There is no clear invalidation level, the stop sits "somewhere here".
Many timeframes blink at once, the view jumps from 1 minute to 15 minutes and back.
Inner talk sounds like "everyone is already in, I am the only one outside".
If at least two of these points match, the trade is most likely not part of the core system.
Simple rules against FOMO
Work goes not with the emotion itself, but with the frame around trades.
No plan, no trade .
A position opens only if the scenario existed before the spike. Fresh "brilliant" ideas during the impulse are placed into the journal, not into the order book.
Move distance limit .
Decide in advance after what percentage move from a key zone the setup becomes invalid.
For example: "if price travels more than 3–4 percent away from the level without a retest, the scenario is cancelled, next entry only after a pause and new base".
Trade from zones, not from the middle of the impulse .
Plans are built around areas where a decision makes sense, not around the fastest part of a candle.
Time filter .
After a sharp move, add a small pause.
Five to fifteen minutes with no new orders, only observation and notes.
What to do when the move has already gone
The smart choice is not "grab at least something".
Better to:
save a screenshot of the move;
mark where the trend started to speed up;
write down whether this symbol was in the plan and why;
prepare a setup for a pullback or the next phase, where entry comes from a level, not from the middle of noise.
Then the missed move turns into material for the system instead of three revenge trades in a row.
A short checklist before pressing the button
Was this symbol in the plan before the run started.
Do I see the exact point where the idea breaks and is the stop parked there.
Is the loss size acceptable if this trade repeats many times.
Can I repeat the same entry one hundred times with the same rules.
If any line sounds weak, skipping this "train" often saves both money and nerves.
The market will send new ones. The task is not to jump into every car, but to board the ones that match the timetable of the trading plan.

NAS100 Trade Set Up Dec 8 2025Price has tapped into supply and has swept London/Asia highs so i will wait to see if price can sweep PDH first to then look for internal 1m-5m IFVG/CISD target LRLR and SSL

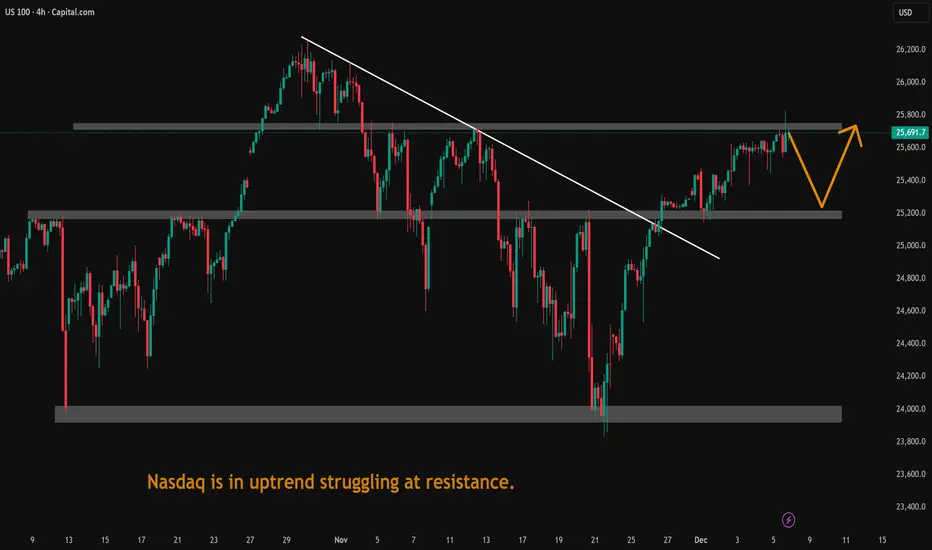
Nasdaq is in uptrend struggling at resistance.Nasdaq is in uptrend struggling at resistance. It may retace next week.
US100 = NASDAQ INDEX big short coming soon ?i think we are at the very end of a very long impulsive wave, we might even be finished it not certain but one thing is certain, we will see a big short in the coming months after another small impulse wave or some range to target wave 5 maybe. gonna be on the watch on this one, my last year target already reached so, add to watch list, might give us very good entry for another long term buy.

NAS100 Trade Opportunity: Will Buyers Defend the Pullback?📊 NAS100 (NASDAQ-100) Swing Trade Opportunity 🚀
Bullish Pullback Setup | Super Trend ATR + TMA Confirmation
🎯 TRADE SETUP OVERVIEW
Instrument: NAS100 (NASDAQ-100 Index)
Timeframe: Swing Trade (4H-Daily)
Bias: BULLISH ✅
Setup Type: Super Trend ATR Line Pullback + Triangular Moving Average (TMA) Confirmation
🎬 ENTRY STRATEGY - "LAYERING METHOD" 📍
This strategy employs multiple limit order placement (Layer Entry Technique) to optimize entry points during the pullback phase.
Recommended Layer Entry Points:
🔵 Layer 1: 24,500
🔵 Layer 2: 24,600
🔵 Layer 3: 24,700
🔵 Layer 4: 24,800
⚡ Pro Tip: Scale layers based on your account size and risk tolerance. Each layer reduces average entry price.
🛑 STOP LOSS (SL)
Primary SL Level: 24,300
Strategy: Placed below the latest swing low + Super Trend confirmation
⚠️ DISCLAIMER: This SL is a guideline only. You must adjust based on your personal risk management strategy and account equity. Risk is YOUR responsibility.
🎁 PROFIT TARGETS (TP)
PRIMARY TARGET (TP1): 25,700 🎯
First resistance zone
Ideal for taking partial profits
Recommended exit: 30-50% position
SECONDARY TARGET (TP2): 26,200 🔥
Strong resistance + Historical overbought zone
⚠️ TRAP ALERT: Expect potential reversal or consolidation
Recommended exit: Remaining 50-70% position
Use trailing stop for final portion
📈 TECHNICAL CONFIRMATION
✅ Super Trend ATR: Aligned bullish
✅ TMA (Triangular MA): Pullback to key level confirmed
✅ Higher Lows Pattern: Intact
✅ Volume Analysis: Supporting move
🔗 RELATED PAIRS TO WATCH 💡
Positive Correlation (Move Together):
🔴 SPY (S&P 500 ETF) - $380-395 Range
Correlation: +0.92 | Often leads NAS100 lower-cap stocks
Key Point: If SPY breaks $390, expect NAS100 momentum confirmation
Watch for divergence signals
🔴 QQQ (Invesco QQQ Trust - Nasdaq 100 ETF) - $450-470 Range
Correlation: +0.99 | DIRECT tracking of NAS100
Key Point: Primary barometer for Nasdaq sentiment
Use for volume + volatility confirmation
🔴 TECH Sector ETF (XLK) - $205-215 Range
Correlation: +0.88 | Tech-heavy holdings overlap
Key Point: Tech rotation affects Nasdaq flow
Monitor for sector strength/weakness
Inverse Correlation (Move Opposite):
🔵 DXY (US Dollar Index) - $103-106 Range
Correlation: -0.65 | Stronger dollar = Risk-off mood
Key Point: If DXY spikes, expect NAS100 pullback extension
Monitor Fed rate expectations
🔵 TLT (20+ Year Treasury ETF) - $75-80 Range
Correlation: -0.58 | Rising yields hurt growth stocks
Key Point: Check 10Y yield trend for rate pressure
Watch Fed policy announcements
Key Monitoring Points:
📌 Earnings Season Impact: Tech earnings can create ±2% moves
📌 Fed Minutes/Announcements: Watch for rate guidance changes
📌 Market Breadth: Compare Advance/Decline lines for confirmation
📌 Volatility Index (VIX): Levels above 20 = Caution; Below 15 = Risk-on
📋 BEFORE YOU TRADE - CHECKLIST ✅
Is price currently at/near Layer 1 entry (24,500)?
Does current 4H chart show TMA pullback + Super Trend confluence?
Is volume confirming the setup?
Have you set your SL below 24,300?
Do you understand you're risking X to make Y?
Is this aligned with your trading plan?
🎓 FINAL NOTES
This is a mechanical swing trade setup designed for traders who use limit orders and layering technique. The confluence of Super Trend ATR + TMA creates higher probability entries during bullish pullbacks.
Remember: Trading involves substantial risk of loss. This idea is shared for educational analysis. Your trading decisions are YOUR responsibility alone.
Happy Trading! 🚀💎

NASDAQ Potential UpsidesHey Traders, in today's trading session we are monitoring NAS100 for a buying opportunity around 25,520 zone, NASDAQ is trading in an uptrend and currently is in a correction phase in which it is approaching the trend at 25,520 support and resistance area.
Trade safe, Joe.

USNAS100 | Watching 25740 After Resistance ReactionUSNAS100 – Technical Overview
USNAS100 has already reached the 25730 resistance highlighted in the previous analysis.
For today, the index is expected to trade with bearish momentum while below 25740, with price likely to test 25570.
A 1H close below 25570 is required to confirm continuation of the bearish trend toward 25430.
However, if the market closes a 1H candle above 25740, bullish momentum will return, opening the way toward 25980 and higher resistance levels.
Key Levels
Pivot Line: 25740
Resistance: 25880 · 25985 · 26170
Support: 25570 · 25470 · 25330
previous idea:

NAS100 Bullish Setup on 1hrNAS100 Bullish Setup on 1hr
Bullish Setup presented on 1hr
- Bullish divergence
- 1hr FVG created in this crazy sell off
- 1hr unfinished candle at my TP level
Entry: 24160
TP: 25000
SL: 23980
RR: 1:5.71

NASDAQDO YOU KNOW WHATS BEHIND THIS OR OTHER IDEAS?? in bio..
Preferably suitable for scalping and accurate as long as you watch carefully the price action with the drawn areas.
With your likes and comments, you give me enough energy to provide the best analysis on an ongoing basis.
And if you needed any analysis that was not on the page, you can ask me with a comment or a personal message.
Enjoy Trading ;)

NAS100 Trade Set Up Dec 4 2025Price remains bullish breaking structure and making HH so i will want to see a tap into demand and internal 1m-5m bullish structure to take buys to BSL and daily FVG above

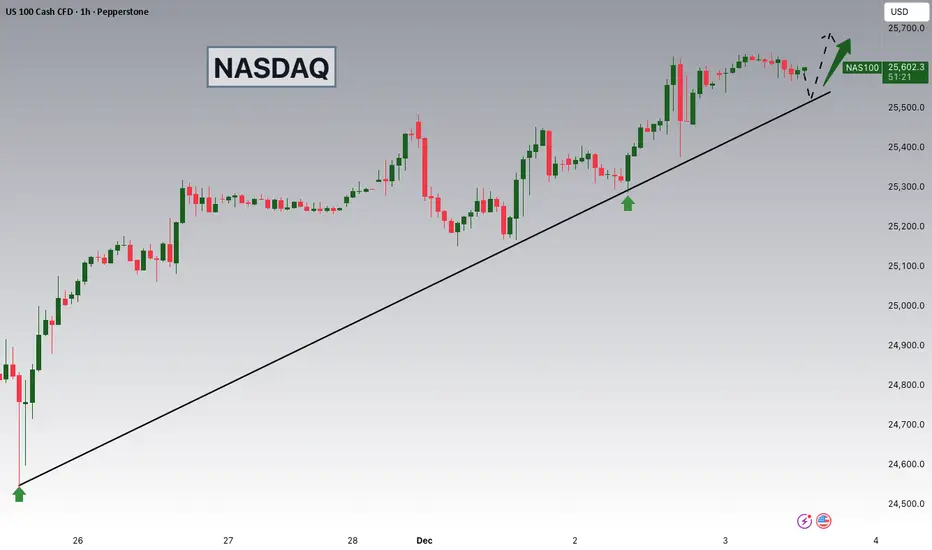
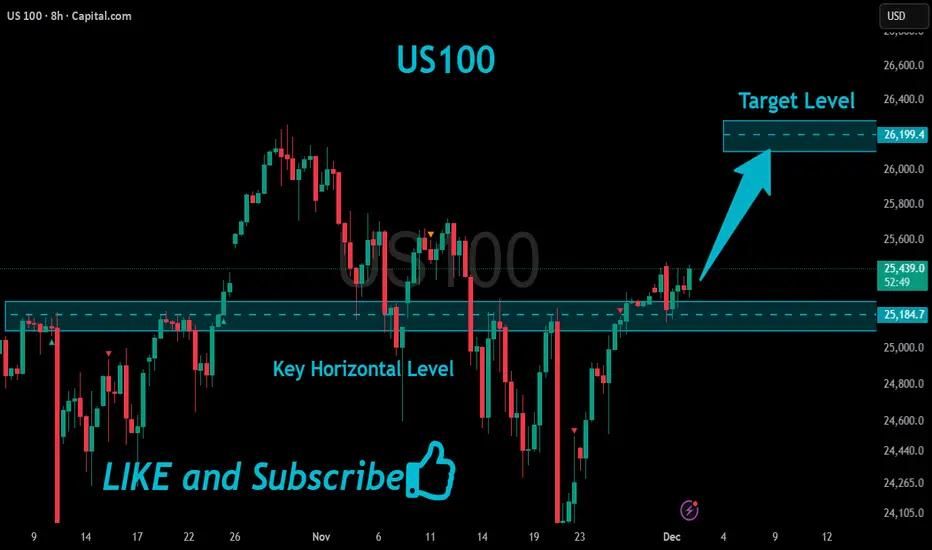
US100 Bullish Breakout!
HI,Traders !
#US100 is going up now
And made a bullish
Breakout of the key horizontal
Level of 25184.7 and the breakout
Is confirmed so we are bullish
Biased and we will be
Expecting a further
Bullish move up !
Comment and subscribe to help us grow !
USNAS100 | Fed Uncertainty & Data Releases Drive Market SetupUSNAS100 – Technical Overview
Risk assets are showing renewed signs of recovery on Wednesday after the broad selloff that began the month, though bonds continue to hold their recent losses.
The U.S. dollar is also easing as attention shifts back to the Federal Reserve, with markets reacting to President Trump’s decision to delay naming the next Fed Chair until 2026.
With the November Nonfarm Payrolls report still pending, investors will closely watch today’s data releases for direction:
Key Events Today
- ADP National Employment Report (November)
- U.S. Industrial Production (September)
- ISM Services PMI (November)
- S&P Global Services & Composite PMIs (Final, November)
Technical Analysis
USNAS100 maintains bullish momentum as long as the price trades above 25570, with upside targets at 25730 and 25980.
A breakout above 25980 could extend the rally toward 26170.
However, a 1H close below 25570 will trigger a corrective move toward 25430, with deeper downside potential into the 25210 support zone.
Key Levels
Pivot Line: 25570
Resistance: 25730 · 25980 · 26170
Support: 25430 · 25210

Nasdaq: To bleed or not to bleed?
STRUCTURE CONTEXT:
Strength Context: Sellers Dominating
RSI Divergence: Present
Control Variant: Sellers Have Full Control
EMA Confluence: 400EMA Reversion
Balance Context: Bearish
Psychology Levels: $24,000 and $25,000
STRUCTURE ANALYSIS:
For the last 10 months we have seen a constant rise in price. Now interrupted in November and momentum now confirmed in December.
Price rejected 4 times when buyers attempted to reclaim price structure. Since then sellers have been dominating for 10 days with no signs of stopping.
With two retracements and an indecision in price on the Daily TF at $23,800, plus a crossover of the 9EMA and the 400EMA with reversion, and the lower lows and lower highs printed, we see great downwards confluence to claim open orders at $23,800 and most likely reverse to try and reclaim trend.
LONG SCENARIO:
- Price continues to retrace down to $23,800 where price was greatly rejected twice.
- Sellers then reach exhaustion and buyers reclaim price and attempt to push price to new highs.
SHORT SCENARIO:
- After price failing to make a new higher high sellers take control once more after exhausting buyers.
- Mitigating 50% of the imbalance in price we see a hard rejection to a new lower low using the strength of the 400 EMA reversion to the downside.


NAS100 – Bias BearishThe daily bias for NAS100 today is bearish.
Yesterday’s daily candle formed a clear bearish signal:
✔️ Swept the previous day’s high (buy-side liquidity taken)
✔️ Closed bearish
✔️ Closed outside the previous day’s range (below the prior day’s low)
This price action shows rejection of premium levels and confirms a shift toward sell-side delivery for today’s session.
Bias Summary:
Daily Bias: Bearish
Narrative: Expansion lower after liquidity sweep
Expectation: Price may seek lower liquidity pools
Outlook: Any retracement into premium could offer short setups
Trade with the narrative, not against it. 🧠🔥

Nasdaq-100: Entry Setup & Pullback in 2026?US100 / Nasdaq-100 long 📈 – today looks like a solid entry opportunity. The volume pool at the ATH from October 30, 2025 is already waiting for me 😏
If I take a bit of a risk, I’d say a short-term dip below 24,500 is possible. For me, though, it’s more likely after checking out the ATH zone, so I see it as a possible scenario for next year. Really excited to see how it plays out!
Happy holidays, everyone! 🎄✨

