Nas100 Trade Set Up Oct 22 2025Price has swept PDH and a daily BSL with a closure under leaving lots of SSL levels and daily FVG that i will target for sells after BSL being swept on the 15m
Trade ideas

NQ SHORTShorting NQ from h4 ote anticipating wed reversal, no news today, short before the news , D crt third candle.

selling offHigh risk low reward entry as price is showing of signs of slowing down it is still bullish. looking at the previous HTF HL areas are target places.

$NDX Make or BreakNDX is consolidating in a triangle, and is now re-test 25200 strong level.
Inability to break above the triangle should see a break below the triangle and a move down to 24700 first.

take asia? nihaumaybe we can take out asia high today and revers?? double top out of the playbook like so many gurus wil say
full margin full risk best of luck to everybody we'll see in a moment

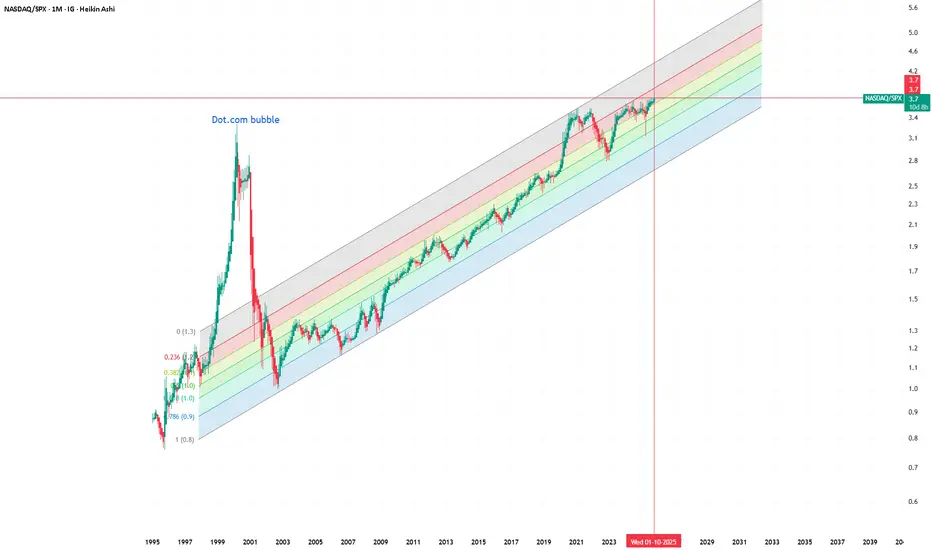
NASDAQ/SPX – Are We Really in an AI Bubble?This chart compares NASDAQ to the S&P 500 (NASDAQ/SPX) on a monthly timeframe, visualized with Heikin Ashi candles and a logarithmic regression channel for long-term context. It highlights the dot-com bubble, where the ratio reached extreme overvaluation levels far above the regression mean.
Recently, many investors have been calling the current market an “AI bubble.” However, when viewed through this historical lens, the ratio still remains within the long-term growth channel and far below the excesses of the early 2000s. This perspective suggests that, at least relative to the broader market, tech doesn’t appear to be in bubble territory yet.
It would still be valuable to compare the composition of the NASDAQ today versus in 2000, as the market structure has changed dramatically — with more diversified revenue streams, profitability, and balance sheet strength. Without this data, one can only speculate. But visually, this ratio helps challenge the popular narrative of an ongoing bubble and invites a more nuanced discussion about valuation, innovation cycles, and sector dominance.
#NASDAQ #SPX #Macro #Tech #AIbubble #DotCom #LongTerm #RatioAnalysis #HeikinAshi #MarketCycle
USNAS100 – Overview | Bearish Correction From ATH ZoneUSNAS100 – Overview | Bearish Correction From ATH Zone
USNAS100 reached a new all-time high but has now stabilized below the supply zone, suggesting a bearish correction phase.
As long as price stays below 25,180, the index remains under pressure toward 25,035 → 24,960 → 24,860.
🕯 Technical View
A 1H close above 25,230 would shift momentum bullish, targeting 25,400 → 25,600.
Pivot: 25,180
Bias: Bearish below 25,180

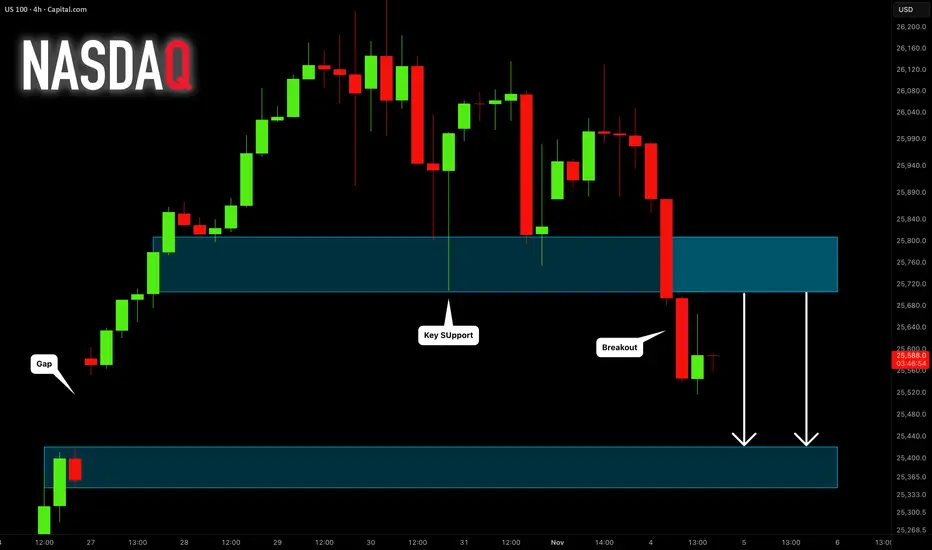
NASDAQ INDEX (US100): Forgotten Gap
A week ago, US100 formed a gap up opening.
It looks like the index is finally ready to fill it.
A breakout of a major horizontal support is a strong bearish signal.
Expect a bearish continuation to 25420.
❤️Please, support my work with like, thank you!❤️
I am part of Trade Nation's Influencer program and receive a monthly fee for using their TradingView charts in my analysis.
NAS100 Trade Set Up Nov 4 2025Price is bearish making LH/LL on the 1h and 15m, has already swept BSL/London highs and inverted 15m FVG so i will be looking for sells down to SSL/London lows


US NAS 100Preferably suitable for scalping and accurate as long as you watch carefully the price action with the drawn areas.
With your likes and comments, you give me enough energy to provide the best analysis on an ongoing basis.
And if you needed any analysis that was not on the page, you can ask me with a comment or a personal message.
Enjoy Trading ;)

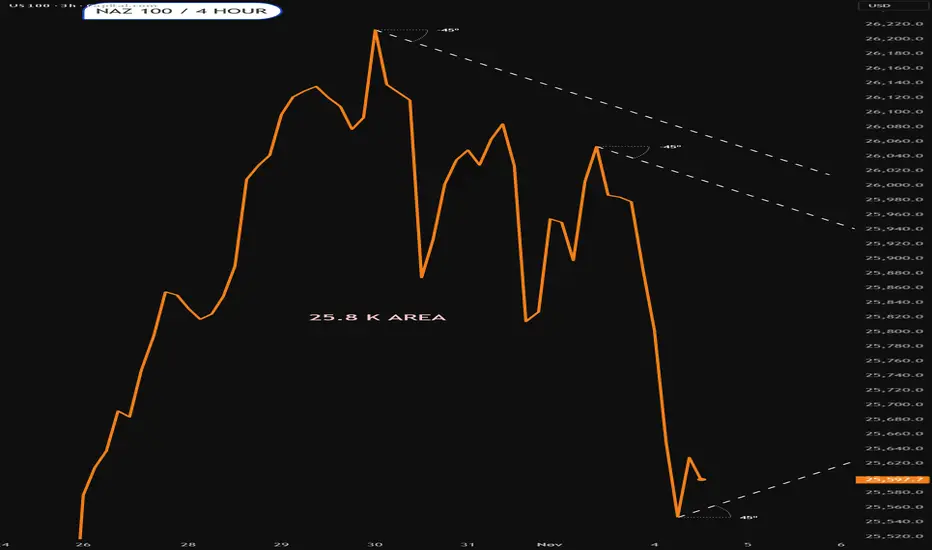
Naz 100.Tuesday 4th NovemberSome might say it looks a tad oversold.Deviation from the trendline.trying to bounce now.lets see if it is succesful
NASD100 8H time frame potential shortBased on technical analysis, NASDAQ 100 has formed a lower low and broken the previous structure on the 8-hour timeframe. A potential pullback toward the upper level is expected, likely forming a lower high — presenting a strong short opportunity from the marked zone for a sizable target. Ensure you apply proper money and risk management to protect your account.

3 NOV 2025: MARKET RECAP NYKZ PMNYKZ PM SHORT SETUP
BREAD AND BUTTER
DISCLAIMER:
The owner of this page is an authorised Representative under supervision of TD MARKETS (PTY) LTD, an authorised Financial Services Provider (FSP No. 49128) licensed by the Financial Sector Conduct Authority (FSCA) under the Financial Advisory and Intermediary Services Act (FAIS).
The FSP is licensed to provide advice and intermediary services in respect of Category I financial products, including but not limited to derivative instruments, long-term deposits, and short-term deposits.
All investment ideas are provided in accordance with the scope of the FSP's license and applicable regulatory requirements. Derivative instruments is a leveraged products that carry high risks and could result in losing all of your capital, and past performance is not indicative of future results.
This idea and any attachments are informational/education and does not constitute a recommendation to buy/sell.
No guarantee is made regarding the accuracy or outcome of this trade idea.
If you choose to accept this idea, please do so at your own risk.


Nasdaq long then short: Expecting one last wave upIn this analysis, I talk about the wave structure for Nasdaq and highlighted that wave 1 is currently the longest wave and that means wave 5 cannot be longer than wave 3. This gives us a maximum target of 26300 that is already hit on 30th Oct. So while I do expect another up wave for Nasdaq, this will likely be a double top with the same high as 30th Oct before we start on a longer-term move down.

3 NOV 2025: US100 MARKET RECAPNOT YOUR STANDARD DAY - LESSONS WERE LEARNT. ALL TRADES WERE WON
DISCLAIMER:
The owner of this page is an authorised Representative under supervision of TD MARKETS (PTY) LTD, an authorised Financial Services Provider (FSP No. 49128) licensed by the Financial Sector Conduct Authority (FSCA) under the Financial Advisory and Intermediary Services Act (FAIS).
The FSP is licensed to provide advice and intermediary services in respect of Category I financial products, including but not limited to derivative instruments, long-term deposits, and short-term deposits.
All investment ideas are provided in accordance with the scope of the FSP's license and applicable regulatory requirements. Derivative instruments is a leveraged products that carry high risks and could result in losing all of your capital, and past performance is not indicative of future results.
This idea and any attachments are informational/education and does not constitute a recommendation to buy/sell.
No guarantee is made regarding the accuracy or outcome of this trade idea.
If you choose to accept this idea, please do so at your own risk.

Naz 100 into the open .Monday 3rd NovemeberCan it keep above 26 K .?
Lets see what happens
Bullish chart
Could easily pullback

NAS BUY 11.3.25Step 1 - Market State
-market consolidated during asian and london, established a test of the low during london, high was created in asian
Step 2 - Location
-price breaks above the support are so we look for a retest, get one at 6am and another around 8am.
Step 3 - Entry would have been 26000, SL 25975, TP 1 26050, tp 2 26100 TP 3 is trailing stop loss at TP 2 that we adjust using the fib retracement to look for exit

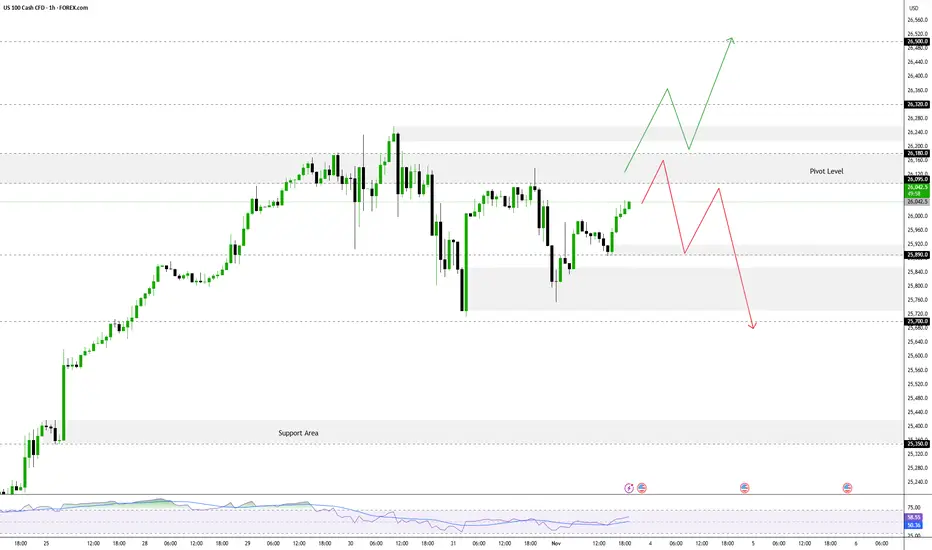
NASDAQ Testing Pivot Zone, Awaiting Breakout The FOREXCOM:NAS100 is currently testing a key zone called the Pivot Zone (a direction-determining area). The short-term trend will be determined by whether the price manages to stay below or break above this zone.
Pivot Zone: 26,095 – 26,180
As long as the price trades below this zone, short-term momentum remains bearish (tending to fall).
➡️ Bearish Scenario
If the price remains below 26,180, the negative bias will continue, with the following main targets:
- Target 1: 25,890
- Target 2: 25,700
- Target 3: 25,340
⬆️ Bullish Scenario
If a breakout and confirmation occurs above 26,180, this could signal the start of a new bullish trend, with the following targets:
- Target 1: 26,500
- Target 2: 26,850
USNAS100 remains bearish below 26,180, but a confirmed break above this level could signal the start of a new bullish leg.
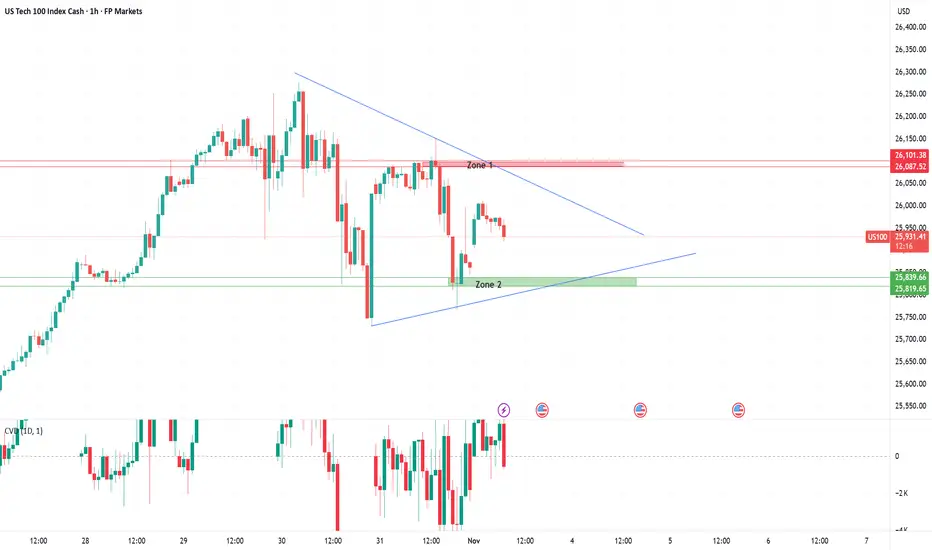
US100 – Key levels in focusUS100 – 1H Technical Zone Analysis
Zone 1: Friday’s High
This zone marks Friday’s high and the upper boundary of the current consolidation structure. It represents the point where bullish momentum paused before the weekend, and now acts as immediate resistance. A clean break and hold above Zone 1 would confirm renewed buyer strength and could open the path toward fresh all-time highs. Until then, traders are likely to view this level as a short-term decision point for directional bias.
Zone 2: Friday’s Low
This zone defines Friday’s session low — the level where buyers regained control and pushed price higher into the weekly close. It now serves as key intraday support and aligns closely with the ascending trendline structure. Holding above Zone 2 keeps market sentiment constructive and suggests that buyers remain in control of short-term direction. A clean break below would signal fading momentum and could invite a deeper pullback toward 25,700–25,750.
Market Recap – US100 Overview
The US100 closed last week on a strong note, extending its rally to fresh all-time highs as optimism spread across global markets. Sentiment was fueled by renewed progress in U.S.–China trade negotiations, with reports suggesting a potential framework deal and discussions over easing tariffs on rare-earth materials and agricultural goods. This reduced geopolitical risk and boosted risk appetite across equities.
Tech and AI-related stocks once again led the charge, highlighted by NVIDIA reaching a record $5 trillion valuation, reinforcing the dominance of the growth and semiconductor sectors. The Federal Reserve maintained a cautious stance, signalling that rate cuts are not guaranteed, but investors largely shrugged off policy uncertainty amid the ongoing government data blackout.
Overall, the tone was constructively bullish: optimism on trade and strong tech momentum outweighed concerns about stretched valuations and limited macro visibility. Heading into the new week, traders remain focused on whether the rally can hold as markets navigate high levels, thin data, and potential volatility from fresh headlines.
31 OCT 2025: US100 MARKET RECAPBREAD & BUTTER SETUP
DISCLAIMER:
The owner of this page is an authorised Representative under supervision of TD MARKETS (PTY) LTD, an authorised Financial Services Provider (FSP No. 49128) licensed by the Financial Sector Conduct Authority (FSCA) under the Financial Advisory and Intermediary Services Act (FAIS).
The FSP is licensed to provide advice and intermediary services in respect of Category I financial products, including but not limited to derivative instruments, long-term deposits, and short-term deposits.
All investment ideas are provided in accordance with the scope of the FSP's license and applicable regulatory requirements. Derivative instruments is a leveraged products that carry high risks and could result in losing all of your capital, and past performance is not indicative of future results.
This idea and any attachments are informational/education and does not constitute a recommendation to buy/sell.
No guarantee is made regarding the accuracy or outcome of this trade idea.
If you choose to accept this idea, please do so at your own risk.

30 OCT 2025: US100 MARKET RECAPLONDON KILL ZONE
BREAD & BUTTER SETUP
DISCLAIMER:
The owner of this page is an authorised Representative under supervision of TD MARKETS (PTY) LTD, an authorised Financial Services Provider (FSP No. 49128) licensed by the Financial Sector Conduct Authority (FSCA) under the Financial Advisory and Intermediary Services Act (FAIS).
The FSP is licensed to provide advice and intermediary services in respect of Category I financial products, including but not limited to derivative instruments, long-term deposits, and short-term deposits.
All investment ideas are provided in accordance with the scope of the FSP's license and applicable regulatory requirements. Derivative instruments is a leveraged products that carry high risks and could result in losing all of your capital, and past performance is not indicative of future results.
This idea and any attachments are informational/education and does not constitute a recommendation to buy/sell.
No guarantee is made regarding the accuracy or outcome of this trade idea.
If you choose to accept this idea, please do so at your own risk.
