NAS100 (15M) – Breakout & Continuation SetupThe NAS100 is showing strong bullish momentum on the 15-minute timeframe with Heikin Ashi candles confirming trend strength.
🔹 Structure:
After multiple consolidations and corrections, price formed higher lows (blue lines) and broke out of recent resistance (red zone).
A clean bullish structure with impulsive legs is visible (green trend lines).
🔹 Indicators:
The Alligator lines are opening upward, signaling trend continuation.
RSI is holding above 70, confirming bullish strength (but caution for potential pullback).
🔹 Setup:
Entry near 23,693 – 23,699.
Stop loss below 23,617.
Target around 23,841, giving a favorable risk-to-reward ratio.
📈 Bias: Bullish continuation towards 23,800+ as long as support holds.
📉 A break below 23,617 would invalidate the setup.
US100 trade ideas

us100 on buy till 23810 to sell#US100 we await for breakout 23700 2 times breakout to buy or M30 closure above there.
Possible target 23810-23850, stop loss at 23614.
Above 23810-23850 holds bearish reversal, price will fall till 23584.

US100 – Breakout or a Classic Bull Trap?
The US100 (Nasdaq Index) has recently shown what looks like a breakout on the 4-hour timeframe after a phase of consolidation. On the surface, this can easily be perceived as a bullish continuation. However, a closer look reveals that the breakout might just be setting up for a classic bull trap.
I am currently positioned short on the index with a view that the current move could fail to sustain. The price has entered into my marked supply zone, an area where selling pressure historically outweighs demand. If this zone holds true to its nature, we can see a strong rejection from here.
• LTP (Last Traded Price): 23,690
• Supply Zone: Highlighted on chart
• Downside Target: Around 22,500
The broader structure still suggests that while short-term euphoria pulls prices higher, the underlying momentum may not support sustained gains. If the bulls lose control here, the downside could open up swiftly, validating this thesis.
I’ll be watching how price reacts in this zone closely. For now, I remain short-biased, anticipating a rejection and a move towards the 22,500 mark.

Head and shoulder, right shoulder buildingShorting here, nullifed if it closed above 23800 today.
tp: 22000
NVDIA earning done and selling off now.
Core CPI and PPI have been hot, PCE might come high.
Movement into small cap and spread.
Not financial advice.

SHORT ON NAS100Using the 1h, 15m, and 5m bearish fvg the market need fill the gaps above 50% Fib range. Targeting the lows as the TPs

ict conceptsTrading foreign currencies can be a challenging and potentially profitable opportunity for investors. However, before deciding to participate in the Forex market, you should carefully consider your investment objectives, level of experience, and risk appetite. Most importantly, do not invest money you cannot afford to lose.
There is considerable exposure to risk in any foreign exchange transaction. Any transaction involving currencies involves risks including, but not limited to, the potential for changing political and/or economic conditions that may substantially affect the price or liquidity of a currency. Investments in foreign exchange speculation may also be susceptible to sharp rises and falls as the relevant market values fluctuate. The leveraged nature of Forex trading means that any market movement will have an equally proportional effect on your deposited funds. This may work against you as well as for you. Not only may investors get back less than they invested, but in the case of higher risk strategies, investors may lose the entirety of their investment. It is for this reason that when speculating in such markets it is advisable to use only risk capital.

watching 15m chartno news, we pushed pretty down just now. going to watch 1m for entry to short. if 1m close too high won't enter.
Same trade 2 days back, but yesterday was good.
if price goes up here, looking to short it to tp. or half way from 1m high and low.

NSDQ100 ovrsold rebound supported at 23350US equities advanced, with the S&P 500 +0.41%, closing just shy of record highs, as solid US data offset Fed uncertainty. Conference Board consumer confidence (97.4 vs. 96.5 exp) and core capital goods orders (+1.1% vs. +0.2% exp) signaled resilience, while the Richmond Fed index (-7 vs. -11 exp) improved.
Focus today is Nvidia earnings, which could be pivotal for NASDAQ 100 given its AI leadership and sensitivity to US-China trade tensions. Asian tech strength overnight reflects bullish positioning ahead of results.
Meanwhile, hedge funds are running record shorts in VIX, betting on low volatility—an extreme stance that has historically preceded sharp market moves, something to watch around Nvidia’s release.
In the UK, BoE’s Mann argued for keeping rates high for longer, but impact is limited for US tech trading focus.
For NASDAQ 100: near-record highs, tech sentiment riding on Nvidia, but positioning risk in volatility markets could amplify any surprise.
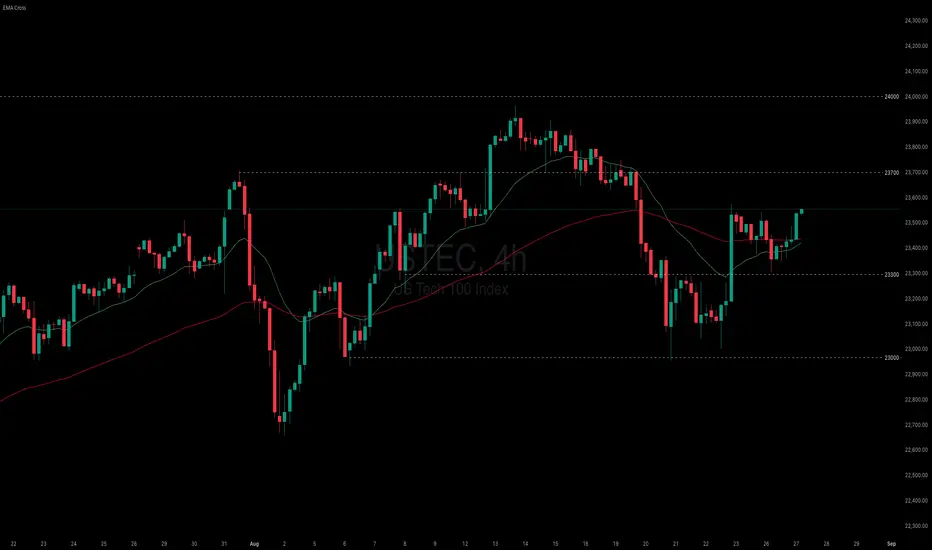
Key Support and Resistance Levels
Resistance Level 1: 23700
Resistance Level 2: 23830
Resistance Level 3: 23920
Support Level 1: 23350
Support Level 2: 23250
Support Level 3: 23100
This communication is for informational purposes only and should not be viewed as any form of recommendation as to a particular course of action or as investment advice. It is not intended as an offer or solicitation for the purchase or sale of any financial instrument or as an official confirmation of any transaction. Opinions, estimates and assumptions expressed herein are made as of the date of this communication and are subject to change without notice. This communication has been prepared based upon information, including market prices, data and other information, believed to be reliable; however, Trade Nation does not warrant its completeness or accuracy. All market prices and market data contained in or attached to this communication are indicative and subject to change without notice.

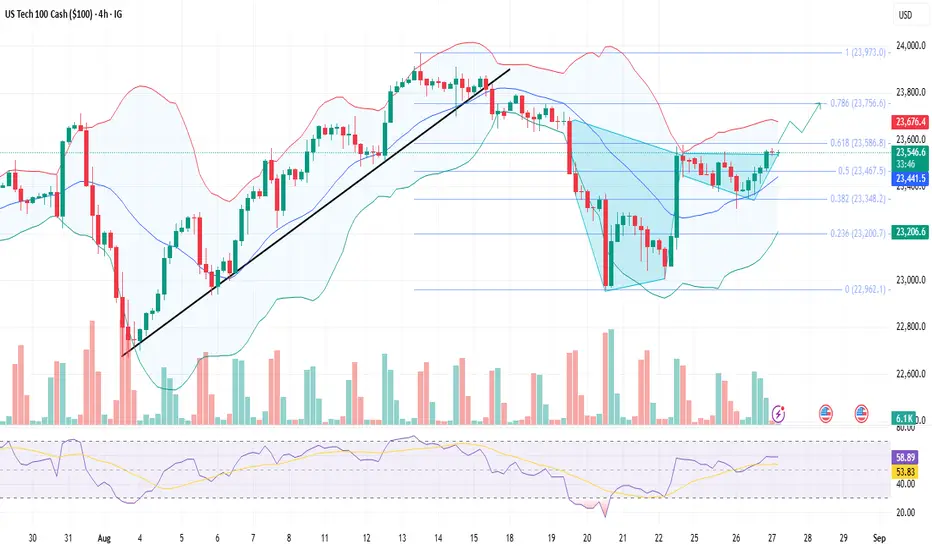
Nasdaq Intraday AnalysisOn the chart, Nasdaq is consolidating above crucial psychological support of 23500, creating a bullish cup & handle pattern
However, the prices despite Governor Cook's news failed to break the 0.618 Fib level (23586),
Still, Trump’s firing of Fed Governor Lisa Cook has created majority in the Fed, which has risen prospects of deeper rate cuts.
And lower rates historically support tech stocks.
Therefore, if prices breaches the immediate resistance at 0.618 Fib level (23586), then the US tech index will continue its bullish momentum toward 23756–23,970.
What Indicators are indicating:
1) RSI is hovering in the buying zone near 58, showing momentum is recovering but not yet overbought — room for further upside.
2) Bollinger Bands are widening slightly and turning their trend toward up-side, hinting at increasing volatility and potential for breakout trades.
Overall bias: Buy on dips toward 23500–23450 zones with targets at 23756 and 23950 intraday.
nasdaq buyhi evryone the nasdaq index can rise to the specifed target. please don't forget capital managment

US equities advanced despite concerns over Fed independence
Despite the uncertainty following President Trump’s dismissal of Fed Governor Cook, USTEC advanced slightly.
President Trump dismissed Fed Governor Cook due to allegations of mortgage fraud, raising concerns over the Fed's independence. JPMorgan warned the move could set a precedent for politically driven dismissals of other board members.
Meanwhile, the August CB Consumer Confidence Index rose to 97.4, indicating a more positive outlook on current conditions. However, 12-month inflation expectations rose from 5.7% to 6.2%, while the share of respondents viewing jobs as plentiful decreased from 29.9% to 29.7%.
USTEC has risen above both EMAs, signaling an attempt at a trend reversal. The narrowing distance between EMA21 and EMA78 suggests a potential shift toward bullish momentum. If USTEC holds above both EMAs, the index may gain upward momentum toward the resistance at 23700. Conversely, if USTEC falls back below both EMAs, the index could retreat toward the support at 23300.
about the last analysis i shared with u my anlysis and u can check it in the start of the week unti now two wonderful trades now only waiting for gdp and i will confirm the next days direction
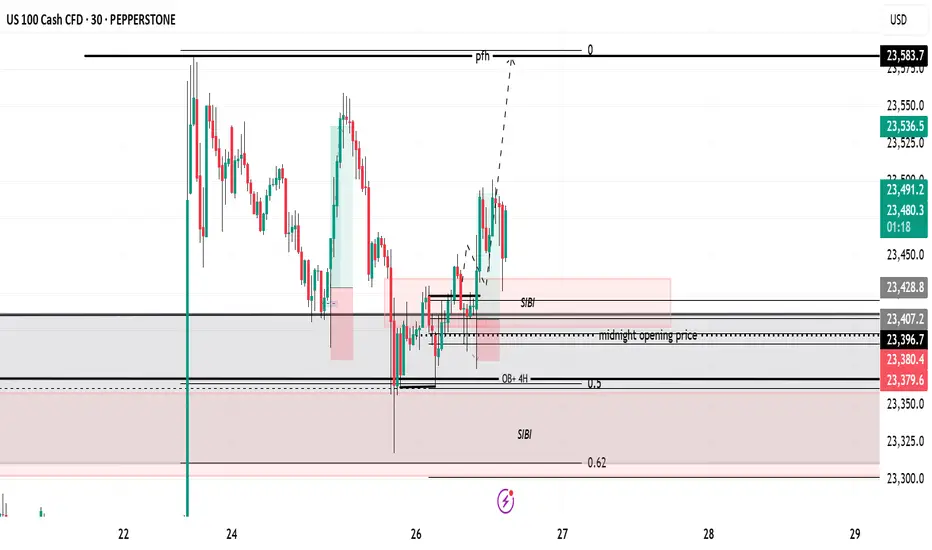
NASDAQ 1H STRUCTURE : ICT + SMC Nasdaq Buying Zones
Choch + OB Area Buy Zone : 23,430
FVG Buy Zone : 23,415
TS Buy Zone : 23,3370
Nasdaq Selling Zones
FVG SELL ZONE : 23,500 / 23,535
Thats All The Zones
Good Luck With Your Trade 🔥

US100 / NASDAQ Technical AnalysisThe Nasdaq index is currently trading near 23,400, heading for a price correction after its recent rally.
🔻 Bearish Scenario:
If the price remains consistently below the 23,400 area, it will likely test the 23,200 level, which is a potential bounce zone.
🔺 Bullish Scenario:
Should a rebound signal appear and the price successfully breaks and holds above 23,560, this could support a continued rally toward 23,800.
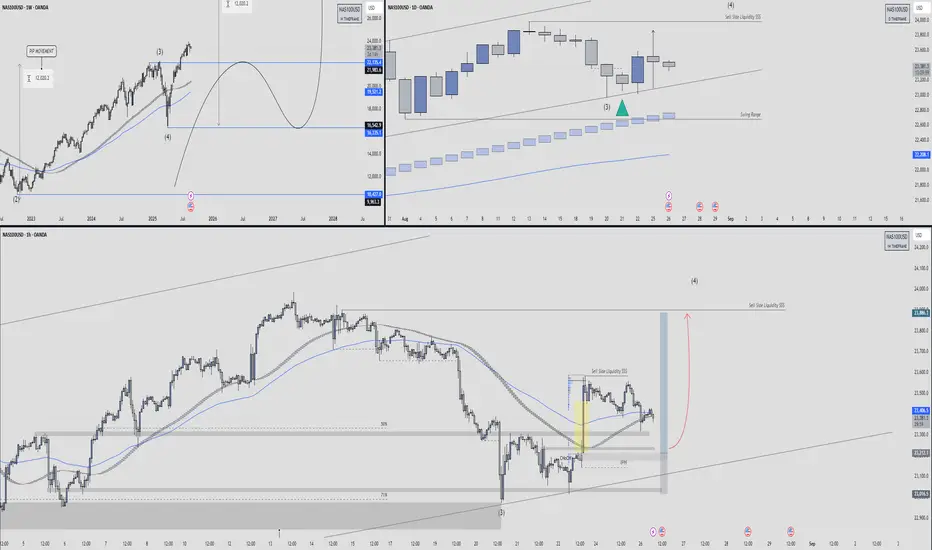
Nas100 Breakdown with Trade Setup🕰 Weekly Structure
Price has completed a Wave (3) high and is now transitioning into a corrective Wave (4) phase.
The broader market cycle suggests sell-side liquidity is being targeted before any new impulsive leg higher.
The EMA structure is still bullish long-term, but retracements are healthy after extended rallies.
Key downside zones:
21,985 – 22,135 (mid-support pocket)
16,962 – 16,353 (deeper retracement if correction extends)
📉 Daily Timeframe
Current daily candles are rejecting the upper levels after tagging swing-high liquidity.
Price is consolidating near the swing range support line (~22,700–23,200).
Buyers are defending the level marked by the green triangle, aligning with a previous Wave (3) pivot.
If this level holds, we may see a relief rally targeting 23,800–24,200 before deciding the next move.
⏱ 1H Short-Term View
Price recently tapped into sell-side liquidity (SSS) and bounced from the 71% fib retracement + demand zone.
A change of character (ChoCH) is visible from the highlighted yellow candle, indicating buyers are stepping in.
Expect a possible bullish leg toward 23,800 – 24,000 if higher-low structure confirms.
If 23,200 fails, downside liquidity sits at 23,000 → 22,700.
🎯 Trade Plan
Bias: Short-term bullish relief rally inside larger corrective Wave (4).
Entry Zone: 23,200 – 23,400 demand retest.
Target 1: 23,800 (SS liquidity pocket)
Target 2: 24,000–24,200 (daily resistance)
Invalidation: Sustained close below 23,000 → opens path to 22,200.
📌 Summary
NAS100 looks corrective after a strong multi-month bullish wave. Near-term, liquidity sweep setups favor a bounce into 23,800+ as long as 23,000 holds. Medium-term, Wave (4) correction could extend deeper into 22k–20k levels before the next major bullish wave.
NAS 100 TARGET?The setup feels just right, makes me want to budget to trade long term, been a while since I followed charts this wide.
What's your take??

nas short term short retest trade1m close near entry, this looks interesting, look at 1m for better view.
should have a liquidty grab there.
if price closes too high, on 1m, then cancel trade.

US100 (Nasdaq) - NY Session Looks like the price might pullback a bit after hitting resistance, then keep heading up. 24k still seems likely. Wait for a reaction after the correction is over.
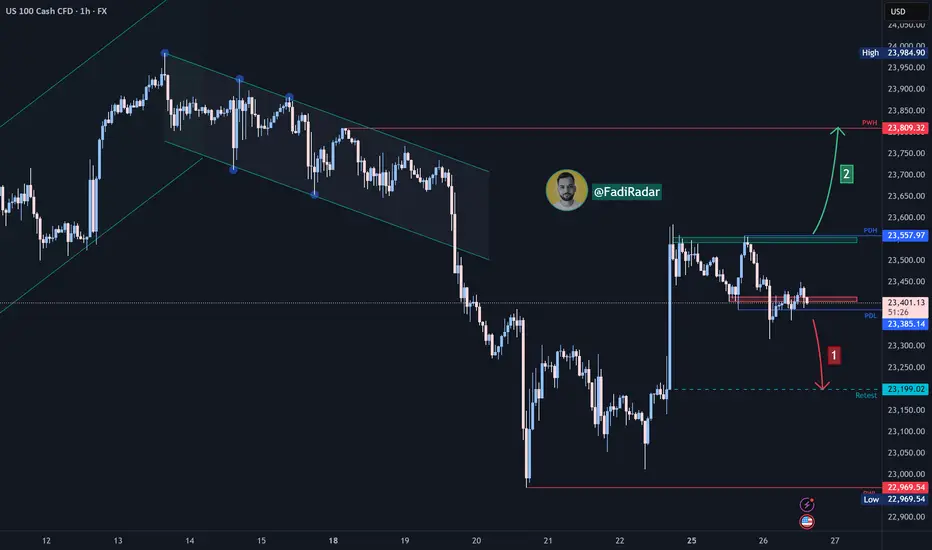
Nas100 Trade Set Up Aug 25 2025FX:NAS100
www.tradingview.com
Nas100 Trade Set Up: price has formed a big gap between HH/HL and a 15m sellside so i want to see if price either sweeps SSl and closes above to continue higher or i test of demand zone

US100 / NASDAQ Technical AnalysisThe Nasdaq index is currently trading near 23,430, heading for a correction after a recent price rally.
🔻 Bearish Scenario:
If the price remains below the 23,450 area, it may head toward testing 23,200, which is a potential bounce zone.
🔺 Bullish Scenario:
If we see signs of a rebound and the price successfully breaks and holds above 23,580, this could support a continued rally toward 23,800.

NAS100 - Bearish Setup!Markets gaps to fill, starting off in the higher time frame price plumeted from the supply zone. From there we had a strong support thats been formed.
We are AIMING for that support zone. Change Of Character HAS been created already giving me confirmation to look for selling opportunities in this market range.
Reacting of the smaller supply zone I will be anticipating a 71% retracement back into the supply to fill imbalance before shorting into that support that we suggested would be our target.
Good luck to anyone that follows

Nasdaq's Bearish Drift: Key Levels in FocusFenzoFx—Nasdaq's short-term trend is bearish. Friday's rally eased after the price filled the fair value gap with resistance at $23,569.00. Today, NQ displaced below the recent lows, currently trading inside the bullish FVG.
There is a relevant equal low at $23,012.00. From a technical perspective, the bearish outlook remains valid if the price holds below $23,569.00. In this scenario, we expect the market to fill the FVG with immediate support at $23,277.00.
Furthermore, if the selling pressure persists, Nasdaq could sweep the equal low by targeting the support at $22,950.00.

Nasdaq Eyes the 23,700 Resistance Ahead of NVDIA EarningsOn the Nasdaq front, all eyes are on NVIDIA’s Q2 earnings, with expectations for revenue around 45.9B and EPS between 1.00–1.01. While enthusiasm around AI continues to drive tech optimism, concerns remain over tariff risks with China, particularly regarding potential backdoors or tracking technologies in NVIDIA chips. These risks could limit revenue potential from the Chinese market
Nasdaq's rebound from the 22,900 mark appears sustainable, with daily RSI holding above the 50 neutral-barrier. A clean hold above 23,700 and 24,100 could pave the way toward new highs at 24,400 and 24,700, in line with continued AI-driven growth.
Downside: A break below 23,200, 22,900, and especially 22,700 would signal broader tech sector weakness, potentially aligning price action with 22,300 and 21,900 support zones.
Written by Razan Hilal, CMT
