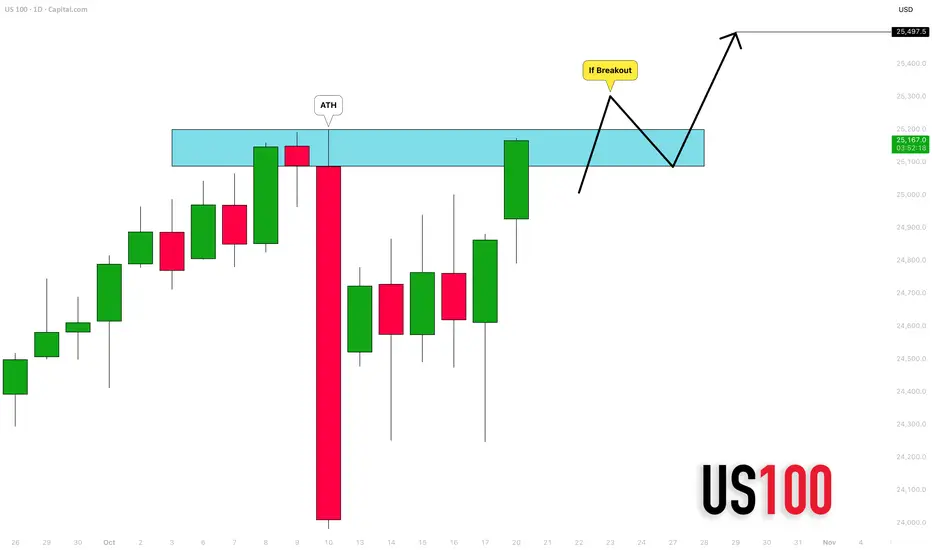
NASDAQ INDEX (US100): Get Ready for Breakout
Nasdaq index is currently testing a resistance based on a current
all-time high.
With a high probability, the market is going to break that.
A daily candle close above will confirm a violation.
A further growth will be expected at least to 25500 level then.
❤️Please, support my work with like, thank you!❤️
I am part of Trade Nation's Influencer program and receive a monthly fee for using their TradingView charts in my analysis.
Trade ideas
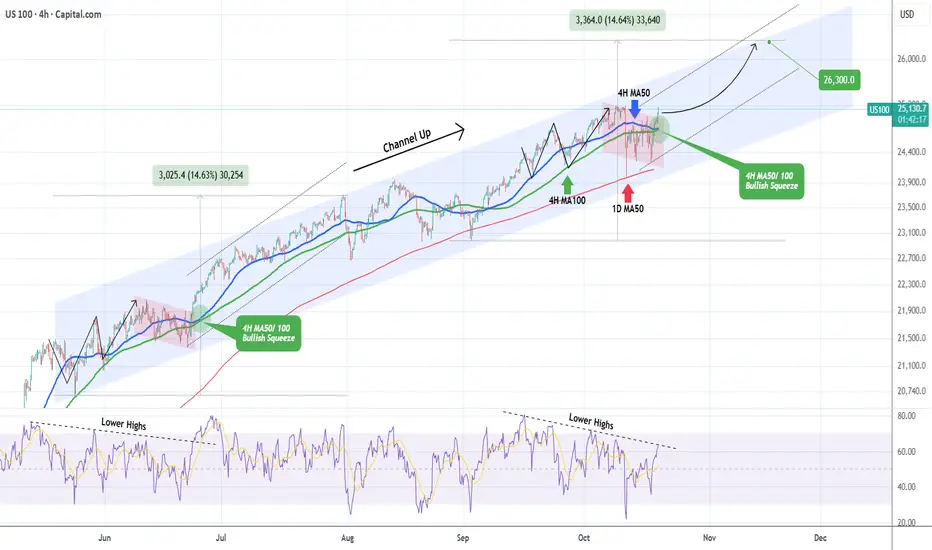
NASDAQ This bullish squeeze can push it to 26300.Nasdaq (NDX) has been trading within a Channel Up since the May 23 Low on its 4H MA100 (green trend-line). It appears that the index is getting out of the red Bearish Leg, which on the whole pattern serves as a Bull Flag for the next rally (Bullish Leg). Once the 4H RSI breaks above its Lower Highs trend-line, it will confirm the new Bullish Leg.
The last such RSI Lower Highs break-out was on June 23 when a similar 4H MA50/ 100 Bullish Squeeze took place. That was almost in the middle of a +14.63% rally in total before the index pulled back to its 1D MA50 (red trend-line).
As a result, once the 4H RSI break-out is finalized, we expect this run to reach at least 26300 (+14.63%).
-------------------------------------------------------------------------------
** Please LIKE 👍, FOLLOW ✅, SHARE 🙌 and COMMENT ✍ if you enjoy this idea! Also share your ideas and charts in the comments section below! This is best way to keep it relevant, support us, keep the content here free and allow the idea to reach as many people as possible. **
-------------------------------------------------------------------------------
💸💸💸💸💸💸
👇 👇 👇 👇 👇 👇
Clown market deserves the best tricksCan Trump save the world again by the end of the day? In this market anything is possible. It looks like the weekly open will hold.

Nas100 Trade Set Up Oct 20 2025I want to see price sweep BSL/London highs then make internal bearish structure on the 1m/5m forming a IFVG and CISD to take sells toward SSL/Asia lows

USNAS100 | Weakness Persists Below PivotUSNAS100 – Overview | Bearish Bias Below 25,035
USNAS100 has stabilized below the pivot zone at 25,035, indicating potential downside movement toward 24,860.
A break below 24,860 would strengthen the bearish trend, targeting 24,750 → 24,510 in the short term.
On the other hand, if price closes a 1H candle above 25,035, it would confirm a bullish reversal, opening the path toward 25,200 → 25,400.
Pivot: 25,035
Support: 24,860 – 24,750 – 24,510
Resistance: 25,200 – 25,400 – 25,540

NASDAQ 100 Resistance Reaction and Countertrend Short SetupThe NASDAQ 100 has rallied strongly and is now trading near the top of its current range 📊. Price is approaching a key resistance level, and I’m expecting a potential reaction from liquidity above the highs, followed by a retracement back to equilibrium — around 50% of the current price swing 📉.|
A countertrend short setup could be considered here, with the option to take partial profits early to reduce risk 💡. Full details of the trade idea and execution are explained clearly in the video.
⚠️ Disclaimer: This is for educational purposes only and not financial advice.

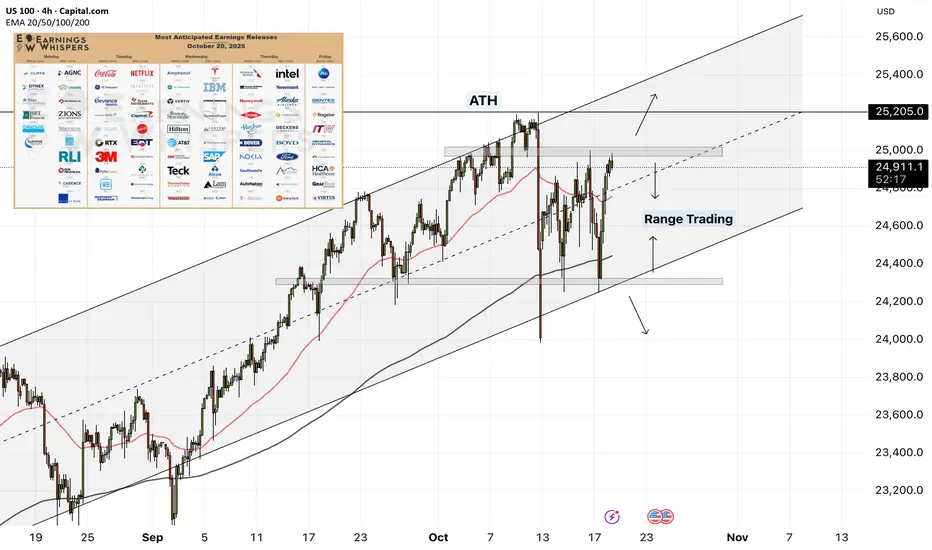
NAS100 - Stock Market, Waiting for a Decisive Week?!The index is above the EMA200 and EMA50 on the four-hour time frame and is in its long-term ascending channel. As long as the Nasdaq is in its range, you can be a seller at the top of the range and a buyer at the bottom. If this range is broken, you can look for new trends in the Nasdaq.
The U.S. Bureau of Labor Statistics (BLS) announced that the Consumer Price Index (CPI) report for September 2025 will be released on Friday, October 24 at 8:30 a.m. New York time (4:00 p.m. Tehran time). This release comes as most other economic data have been delayed due to the ongoing federal government shutdown, which has suspended normal operations.
The CPI report is particularly important for the U.S. Social Security Administration, as it serves as the basis for calculating annual adjustments to retirement benefits and other statutory payments.
In a statement released on Friday, the agency confirmed that it would temporarily recall a limited number of furloughed employees to ensure the timely publication of the CPI report. Originally scheduled for October 15, the release has now been rescheduled for October 24.
This CPI release will be among the few remaining economic datasets published by federal agencies during the shutdown. Since October 1, most data-producing institutions have ceased operations amid political deadlock between Democrats and Republicans that has halted large portions of federal services.
With the federal shutdown continuing, U.S. markets are increasingly relying on private-sector data to gauge the state of the economy. In the upcoming week, indicators such as housing sales and private manufacturing surveys will be released, serving as alternative references for traders and analysts.
Without access to official government data, investors, businesses, and consumers face a heightened level of uncertainty, making it difficult to plan for spending, hiring, and saving decisions.
The CPI report could play a crucial role in shaping the Federal Reserve’s monetary policy decisions, as the FOMC will have access to the data ahead of its October 28–29 policy meeting. Fed officials are currently debating whether to cut interest rates further, and if so, how quickly.
In September, the Federal Reserve lowered its benchmark interest rate to support a weakening labor market by reducing borrowing costs across short-term loans. Another rate cut is widely expected in October, though elevated inflation could slow or prevent further easing.
The Chief Financial Officer of Bank of America (BOFA) stated that the bank expects two additional rate cuts by the Fed before the end of this year.
Meanwhile, Fed Chair Jerome Powell recently warned about downside risks to the labor market, sparking speculation that he might have had early access to the yet-unreleased September employment report. However, a closer examination of his remarks shows no confirmation or denial of such access.
The key takeaway from Powell’s speech was his firm reaffirmation of market expectations for a rate cut later this month, delivered without any sign of hesitation or opposition — a clear and confident signal to investors.
In another commentary, Bank of America highlighted that the current boom in AI data centers is fundamentally different from the dot-com bubble of the early 2000s. The bank attributed today’s expansion to strong semiconductor utilization, healthy cash flows, lower valuations, and a more favorable interest rate environment.
Nonetheless, it acknowledged ongoing concerns about excessive spending and stretched valuations in certain AI sectors.
Finally, the October Bank of America investor survey revealed that recession fears have fallen to their lowest level since February 2022, while optimism about economic growth has seen its strongest jump since 2020:
• 33% expect a “no-landing” scenario (up from 18%)
• 54% foresee a “soft landing” (down from 67%)
• 8% anticipate a “hard landing” (down from 10%).
NQ long idea for the week.SELLSIDE LIQUIDITY PURGE, THEN NEW ALL TIME HIGH ON NQ. PATIENCE AND DISCIPLINE.
Sellside liquidity purge, then new all time high on NQ. Patience and discipline

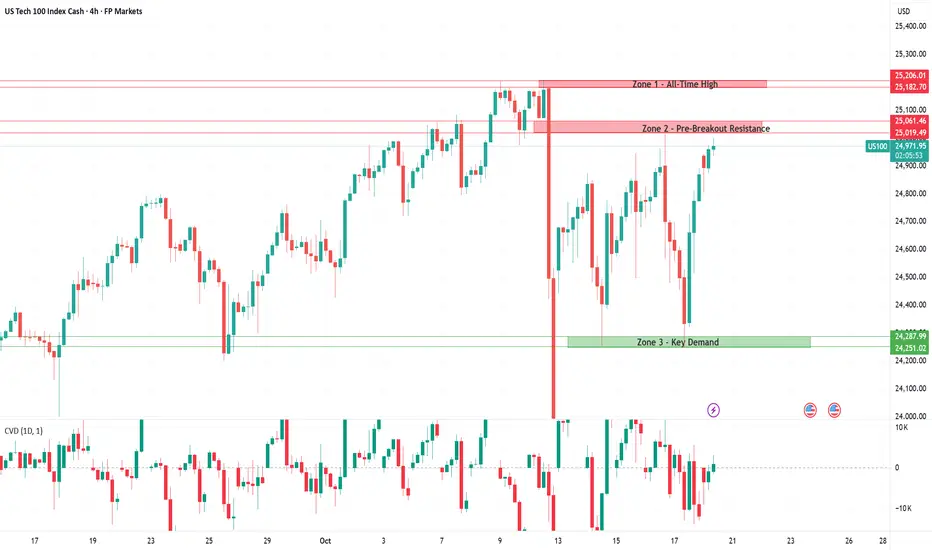
US100 Opens the Week with Cautious Optimism After Trade TensionsUS100 – 4H Technical Zone Analysis
Zone 1: All-Time High
This level represents the current top of the market and a heavy supply region. Until price closes decisively above this range with volume confirmation, it remains a key ceiling. Any push into this zone is high-risk for longs and ideal for short-term fade setups or liquidity hunts.
Zone 2: Pre-Breakout Resistance
This is the immediate resistance just below the all-time high. While a breakout through this zone may appear bullish on lower timeframes, traders should exercise caution. The proximity of the all-time-high resistance above significantly reduces reward-to-risk for fresh longs, price can easily reject from the upper zone and reverse quickly. A cleaner confirmation would require acceptance above both Zone 2 and Zone 1 before considering continuation trades.
Zone 3: Key Demand
This demand zone remains the foundation of the current bullish structure. It marks the origin of the recent rally and continues to attract responsive buyers on dips. As long as price holds above this level, the broader bias stays constructive. A clean break below would, however, shift short-term sentiment bearish and open the door for a deeper correction.
Market Sentiment: Cautious Optimism
After a volatile end to last week, US100 is starting the new week with a tone of cautious optimism. On Friday, renewed tension between the US and China rattled markets, as Washington floated new tariffs and export restrictions while Beijing hinted at countermeasures. However, over the weekend the tone softened, US officials signaled that they did not intend to escalate the trade conflict further, which helped calm investor nerves and lifted sentiment in global markets, particularly in Asia.
Today, the index is trading slightly higher, supported by renewed risk appetite and continued strength in tech and AI-related stocks. Still, confidence remains fragile. Oil prices have weakened, raising questions about global growth, and the ongoing US government shutdown continues to delay key economic data releases. With limited visibility into real fundamentals, investors are largely trading on headlines and policy expectations.
Overall, sentiment around the US100 is positive but delicate, the market is recovering from last week’s uncertainty, yet it remains highly sensitive to any renewed trade tension or negative macro surprises.
NAS100 SELL WITH LIMIT ORDER!!!!!NAS100 Sell limit order will be after my inducement liquidity sweep at 25k then confirmation with min chart for sniper setup entry and will be selling down to new low...

Sell US100NAS100 Support and Resistance Trade. Price is ranging from the resistance to the support at 24000. A bearish flag has been printed. We can expect sharp bearish moves this week

BIAS FOR THE WEEK: 20 OCT TO 24 OCT 2025AN IDEA OF WHAT I WOULD LIKE TO SEE OCCUR IN PRICE.
IF NOT, THEN I WILL LOOK TO ADJUST MY BIAS ACCORDINGLY.
DISCLAIMER:
The owner of this page is an authorised Representative under supervision of TD MARKETS (PTY) LTD, an authorised Financial Services Provider (FSP No. 49128) licensed by the Financial Sector Conduct Authority (FSCA) under the Financial Advisory and Intermediary Services Act (FAIS).
The FSP is licensed to provide advice and intermediary services in respect of Category I financial products, including but not limited to derivative instruments, long-term deposits, and short-term deposits.
All investment ideas are provided in accordance with the scope of the FSP's license and applicable regulatory requirements. Derivative instruments is a leveraged products that carry high risks and could result in losing all of your capital, and past performance is not indicative of future results.
This idea and any attachments are informational/education and does not constitute a recommendation to buy/sell.
No guarantee is made regarding the accuracy or outcome of this trade idea.
If you choose to accept this idea, please do so at your own risk.

Bearish ContinuationPrice has broken previous lows and currently correcting. On the 4hr tf, it is clear consolidation, however, looking for price to correct a little further to the upside then possibility of a bigger drop.
Patience is key.

nas100looking for buys in now now time as retetsted acoordingly to my will take it join me enter with low risk

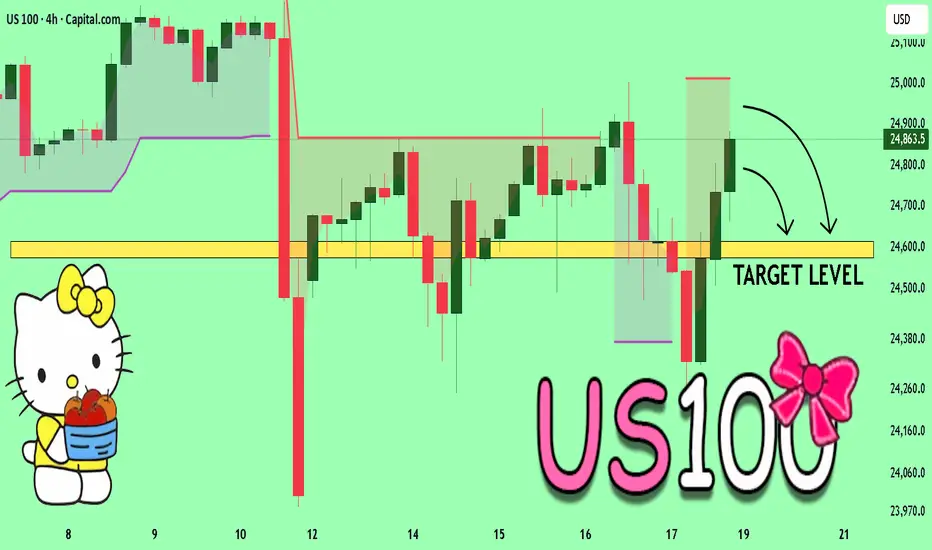
US100 A Fall Expected! SELL!
My dear friends,
Please, find my technical outlook for US100 below:
The instrument tests an important psychological level 24.863
Bias - Bearish
Technical Indicators: Supper Trend gives a precise Bearish signal, while Pivot Point HL predicts price changes and potential reversals in the market.
Target - 24.615
About Used Indicators:
Super-trend indicator is more useful in trending markets where there are clear uptrends and downtrends in price.
Disclosure: I am part of Trade Nation's Influencer program and receive a monthly fee for using their TradingView charts in my analysis.
———————————
WISH YOU ALL LUCK
Weekly NASDAQ Outlook (NQ!)Last Friday, NQ! closed at 23,998.6, after a strong decline into the weekly close. When the market reopened on Monday, it gapped up — likely due to weekend events and news.
That gap has since been completely filled, and price has shown a solid push to the upside during the week.
For the coming week, I’m expecting NQ! to take out the all-time high and possibly form a new high.
However, before that happens, I’d like to see a retracement toward the 24,692.8 level, which could provide high-probability long setups.
There’s also a possibility that price won’t revisit this level and instead continues pushing higher directly, but a clean pullback into 24,692.8 would offer a great entry opportunity for longs.
📊 Outlook Summary:
- Expecting bullish continuation.
- Ideal retracement zone: 24,692.8.
- Main target: New all-time high above previous peak.

Big Bearish Day- A Weakness or Buying OpportunityNasdaq is in a strong uptrend. It broke above 23,966 and shot up to 25,191
As it has been taking support at 50EMA multiple times on daily chart, the recent fall of more than 1200 points was contained exactly near the same level.
From the price action point of view-
The fall ceased near the previous breakout zone near 23966, previous resistance acted as support.
A single candle on the daily chart with no continuation has to be an attempt to sweep liquidity below important swing lows near 24200 and 24000 (see 4H chart).
The action near 24250 is also reflecting absorption.
The psychological round number of 25000 could stay as resistance for some time and again push it back in the 24,400 to 24,500 zone offering a short-term low risk buying opportunity.
In this backdrop, 24000 to 24250 zone, accompanied by the strong trend in the background, may again cushion the price back to new highs.
What is your point of view?
Is the recent fall a sign of weakness or an opportunity to buy?
#Educational post not a recommendation to buy or sell.

US100 Bearish Bias!
HI,Traders !
#US100 keeps growing
But a horizontal resistance
Level of 25039.3 is nearby
So after the retest of the
Level we will be expecting
A local bearish correction
On Monday !
Comment and subscribe to help us grow !

NAS100 Technical Outlook (18–25 Oct 2025)Trend Summary:
NASDAQ 100 remains in a corrective phase after rejecting near the 25,200–25,300 resistance zone. Recent price action forms a potential Wave 4 retracement within a medium-term bullish Elliott structure.
1D Chart View:
The index is hovering around key support at 24,750, aligned with the 3 8.2% Fib retracement of the prior leg and near daily EMA50. A bullish reversal from this zone would confirm continuation toward 25,800–26,000.
4H Structure:
A descending channel is observed, acting as a corrective pullback. Ichimoku Cloud shows price testing the lower edge; a break above 25,050 could signal momentum recovery. Volume divergence hints at accumulation beneath.
1H / 30M:
RSI forming a higher low while price prints a lower low — a bullish divergence setup. Bollinger Bands are tightening, suggesting volatility expansion ahead. Watch VWAP reclaim above 25,000 for confirmation of short-term trend reversal.
15M / 5M Intraday Bias:
Short-term traders should monitor the 24,800–24,750 zone for a bounce. Failure below this area exposes 24,620, while a decisive break above 25,050 may trigger an intraday rally targeting 25,250–25,300.
🎯 Trading Plan
Bullish Scenario:
Buy Zone: 24,750–24,800
Targets: 25,050 → 25,250 → 25,800
Stop Loss: 24,580 (below structure low)
Bearish Scenario (alternative):
Sell Zone: 25,250–25,300 (resistance rejection)
Targets: 25,000 → 24,750 → 24,620
Stop Loss: 25,400
🔍 Confluence Factors:
Elliott Wave: Wave 4 correction likely ending.
Fibonacci: 38.2–50% retracement aligning with structure support.
Ichimoku: Testing lower cloud — potential bullish crossover setup.
RSI Divergence: Positive momentum building.
VWAP: Reclaim signals early buyer strength.
Volume: Accumulation noted during low volatility phase.
📘 Outlook Summary:
Bias remains cautiously bullish above 24,750, targeting 25,800–26,000.
Break below 24,620 invalidates bullish structure and opens path to 24,300–24,200.
NAS100 traders should monitor intraday reactions and volume confirmations near key zones. This week may define whether the correction phase transitions into a new impulsive wave or deeper retracement.


US NAS 100Preferably suitable for scalping and accurate as long as you watch carefully the price action with the drawn areas.
With your likes and comments, you give me enough energy to provide the best analysis on an ongoing basis.
And if you needed any analysis that was not on the page, you can ask me with a comment or a personal message.
Enjoy Trading ;)

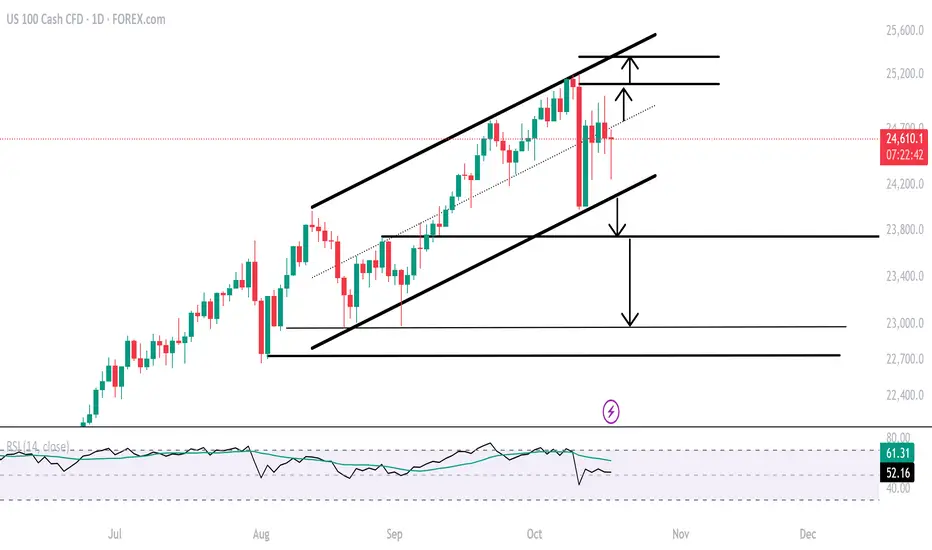
Nasdaq Outlook: Is the Correction Over?Despite the ongoing AI sector growth, the index remains under pressure alongside the broader risk-off sentiment. It is once again facing the 24,000 support and the August–October trendline. The daily RSI is leaning near the neutral 50 level, suggesting that a sustained break below 24,000 could extend the decline by another 1,000 points, testing key supports near 23,700, 23,100 and 22,700 — potentially offering another “buy-the-dip” opportunity.
On the upside, if the Nasdaq manages to hold above 24,000 and, more importantly, close above 24,800 — the mid-zone of the ascending channel respected since August 2025 — prices could advance toward the upper boundary, aligning with levels 25,000 and 25,300, marking new record highs.
- Written by Razan Hilal, CMT
NSDQ100 Key trading levelsKey Support and Resistance Levels
Resistance Level 1: 24908
Resistance Level 2: 25050
Resistance Level 3: 25200
Support Level 1: 24376
Support Level 2: 24205
Support Level 3: 23920
This communication is for informational purposes only and should not be viewed as any form of recommendation as to a particular course of action or as investment advice. It is not intended as an offer or solicitation for the purchase or sale of any financial instrument or as an official confirmation of any transaction. Opinions, estimates and assumptions expressed herein are made as of the date of this communication and are subject to change without notice. This communication has been prepared based upon information, including market prices, data and other information, believed to be reliable; however, Trade Nation does not warrant its completeness or accuracy. All market prices and market data contained in or attached to this communication are indicative and subject to change without notice.
