NSDQ100 corrective pullback support at 23420US Macro:
Q2 headline PCE revised down: +2.0% (vs +2.1%), core PCE steady: +2.5%.
Jobless claims: 229k (vs 230k), continuing 1.954m (vs 1.966m).
→ Soft-landing narrative reinforced, easing recession fears.
US Equities:
S&P 500 +0.32% → 3rd straight gain, fresh ATH.
NASDAQ +0.53% led by tech.
Nvidia -0.79% on slowing revenue growth post-earnings.
Europe:
STOXX 600 -0.20%, FTSE 100 -0.42% lagged.
Eurozone econ sentiment index fell to 95.2 vs 96.0 exp. → weaker sentiment backdrop.
What’s next:
US July PCE inflation + spending data (today) → key for Fed path.
Eurozone CPI flash (Germany/France/Italy) → ECB watch.
Japan Tokyo CPI + activity data → BoJ implications.
Alibaba/BYD earnings → China sentiment gauge.
Key Support and Resistance Levels
Resistance Level 1: 23760
Resistance Level 2: 23880
Resistance Level 3: 23760
Support Level 1: 23420
Support Level 2: 23276
Support Level 3: 23050
This communication is for informational purposes only and should not be viewed as any form of recommendation as to a particular course of action or as investment advice. It is not intended as an offer or solicitation for the purchase or sale of any financial instrument or as an official confirmation of any transaction. Opinions, estimates and assumptions expressed herein are made as of the date of this communication and are subject to change without notice. This communication has been prepared based upon information, including market prices, data and other information, believed to be reliable; however, Trade Nation does not warrant its completeness or accuracy. All market prices and market data contained in or attached to this communication are indicative and subject to change without notice.
US100 trade ideas

Correction TrendlineThe price has formed a correction after a sharp pullback from a bearish move, now the price has broken out followed by a pullback and now the price looks to go long after the higher high
WE ONLY TRADE PULLBACKS

NAS BEARISH SETUPNas has tested 23.737 for the third Time confirming it as a 100% fib retracement level, second test on H1 is possible but we going down all in all

US100-POTENTIAL SELL IDEAThe long awaited sell opportunity that we envisaged on US100 is confirmed today and we’re ready to ride the sell from the current market price. Our first take profit level is at 23258.5 our stop loss is at 23699
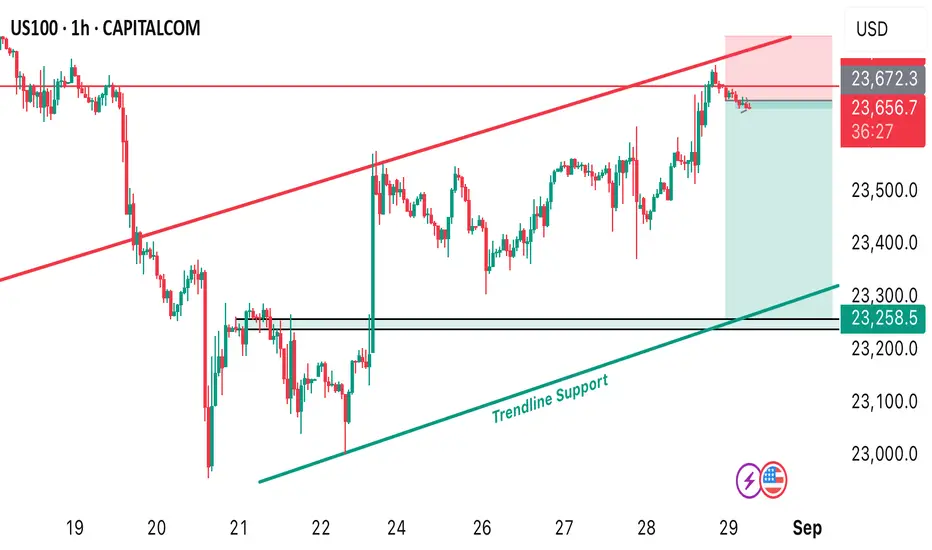
Bullish momentum to extend?US100 is falling towards the support level, which is an overlap support that aligns with the 23.6% Fibonacci retracement and could bounce from this level to pir tale prpft.
Entry: 23,546.52
Why we like it:
There is an overlap support level which aligns with the 23.6% Fibonacci retracement.
Stop loss: 23,300.44
Why we like it:
There is a pullback support that lines up with the 61.8% Fibonacci retracement.
Take profit: 23,938.06
Why we like it:
There is a swing high resistance.
Enjoying your TradingView experience? Review us!
Please be advised that the information presented on TradingView is provided to Vantage (‘Vantage Global Limited’, ‘we’) by a third-party provider (‘Everest Fortune Group’). Please be reminded that you are solely responsible for the trading decisions on your account. There is a very high degree of risk involved in trading. Any information and/or content is intended entirely for research, educational and informational purposes only and does not constitute investment or consultation advice or investment strategy. The information is not tailored to the investment needs of any specific person and therefore does not involve a consideration of any of the investment objectives, financial situation or needs of any viewer that may receive it. Kindly also note that past performance is not a reliable indicator of future results. Actual results may differ materially from those anticipated in forward-looking or past performance statements. We assume no liability as to the accuracy or completeness of any of the information and/or content provided herein and the Company cannot be held responsible for any omission, mistake nor for any loss or damage including without limitation to any loss of profit which may arise from reliance on any information supplied by Everest Fortune Group.

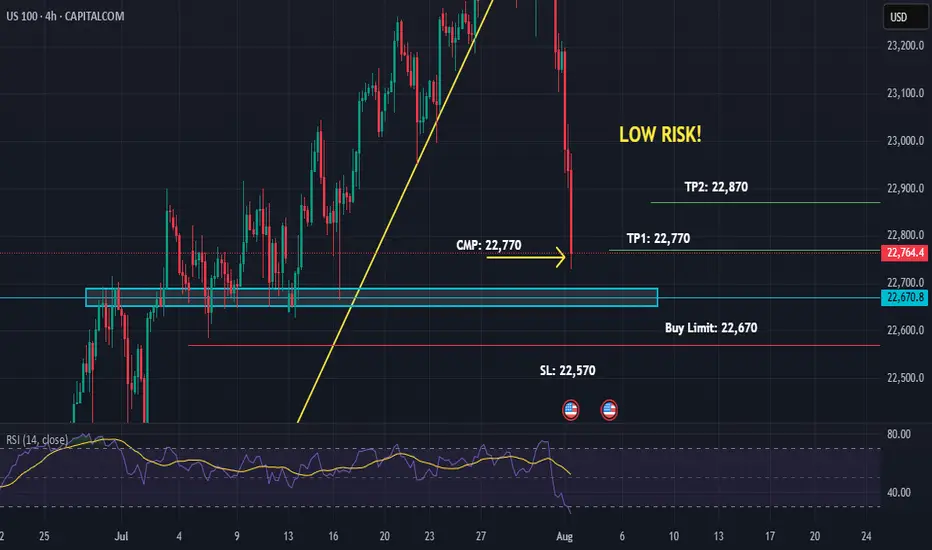
US100 Buy-Limit on Support 4HUS100 Buy-Limit on Support 4H
01-08-25
06:57 PM
Low Risk Trade because market is bearish!
NAS100 - 1D OutlookDear Friends in Trading,
## CORE PCE TODAY - Be safe!
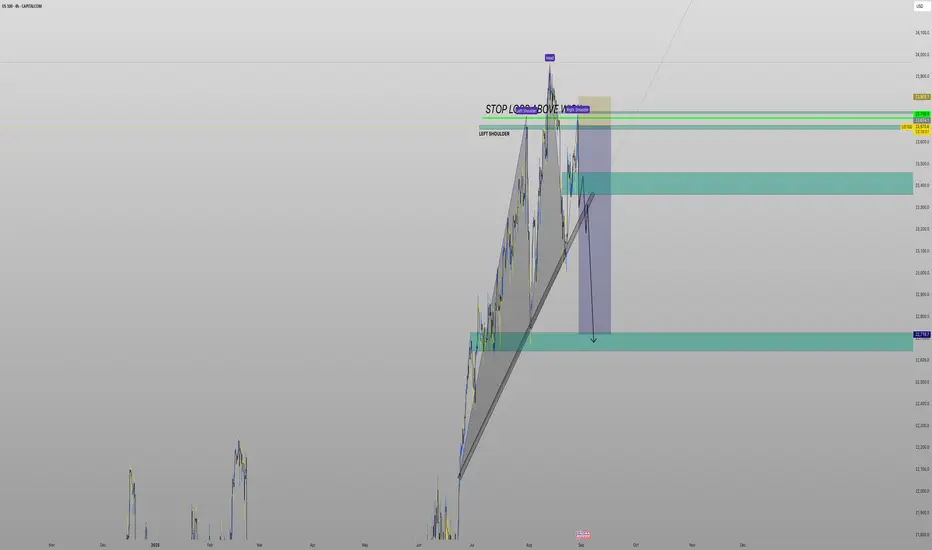
Giant Bull Flag. - Will require a "Giant Break-Out".
Can yellow confluence area hold a correction test?
The green demand trajectory will be the first trend support.
Keynote:
We close three crucial candles today. 1D + 1W + 1M
I know I'm stating the obvious.
Let's see what September brings.
I sincerely hope my point of view offers a valued insight.
Thank you for taking the time study my analysis.

Possible ShortIm seeing Head & Shoulders on the 4hr time frame and I believe it has created a right shoulder to push to the downside
Nasdaq-100 Wave Analysis – 28 August 2025- Nasdaq-100 reversed from support zone
- Likely to rise to resistance level 24000.00
Nasdaq-100 index recently reversed from the support zone between the strong support level 23000.00 (which has been reversing the price from the middle of July), lower daily Bollinger Band and the 38.2% Fibonacci correction of the upward impulse from June.
The upward reversal from this support zone created the daily Japanese candlesticks reversal pattern Hammer – which started the active impulse wave (iii).
Given the strong daily uptrend, Nasdaq-100 index can be expected to rise to the next resistance level 24000.00 (which stopped the earlier impulse wave i).

NAS100 (15M) – Breakout & Continuation SetupThe NAS100 is showing strong bullish momentum on the 15-minute timeframe with Heikin Ashi candles confirming trend strength.
🔹 Structure:
After multiple consolidations and corrections, price formed higher lows (blue lines) and broke out of recent resistance (red zone).
A clean bullish structure with impulsive legs is visible (green trend lines).
🔹 Indicators:
The Alligator lines are opening upward, signaling trend continuation.
RSI is holding above 70, confirming bullish strength (but caution for potential pullback).
🔹 Setup:
Entry near 23,693 – 23,699.
Stop loss below 23,617.
Target around 23,841, giving a favorable risk-to-reward ratio.
📈 Bias: Bullish continuation towards 23,800+ as long as support holds.
📉 A break below 23,617 would invalidate the setup.

us100 on buy till 23810 to sell#US100 we await for breakout 23700 2 times breakout to buy or M30 closure above there.
Possible target 23810-23850, stop loss at 23614.
Above 23810-23850 holds bearish reversal, price will fall till 23584.

US100 – Breakout or a Classic Bull Trap?
The US100 (Nasdaq Index) has recently shown what looks like a breakout on the 4-hour timeframe after a phase of consolidation. On the surface, this can easily be perceived as a bullish continuation. However, a closer look reveals that the breakout might just be setting up for a classic bull trap.
I am currently positioned short on the index with a view that the current move could fail to sustain. The price has entered into my marked supply zone, an area where selling pressure historically outweighs demand. If this zone holds true to its nature, we can see a strong rejection from here.
• LTP (Last Traded Price): 23,690
• Supply Zone: Highlighted on chart
• Downside Target: Around 22,500
The broader structure still suggests that while short-term euphoria pulls prices higher, the underlying momentum may not support sustained gains. If the bulls lose control here, the downside could open up swiftly, validating this thesis.
I’ll be watching how price reacts in this zone closely. For now, I remain short-biased, anticipating a rejection and a move towards the 22,500 mark.

Head and shoulder, right shoulder buildingShorting here, nullifed if it closed above 23800 today.
tp: 22000
NVDIA earning done and selling off now.
Core CPI and PPI have been hot, PCE might come high.
Movement into small cap and spread.
Not financial advice.

A Crucial Test Lies Ahead for the Nasdaq 100The Nasdaq 100 faces a major test over the remainder of this week, with Nvidia reporting results after the close on 27 August and the US PCE report due on the morning of 29 August. The index has struggled to regain its losses after peaking on 13 August, facing stiff resistance just below the 61.8% retracement level at 23,670. In addition, the 10- and 20-day moving averages have proved to be sticking points, with the index unable to break away from either.
Momentum, as measured by the relative strength index, has also turned lower, forming a series of lower highs. Furthermore, a bearish divergence has emerged, with the RSI making lower highs while the Nasdaq 100 registered higher highs from the end of July through to mid-August.
Looking more closely, we see that the Nasdaq 100 had a straight-line rally on 22 August, and such rallies can sometimes be treated in a similar fashion to gaps. As a result, it is entirely possible that the index could give back its recent gains and fall back to 23,210, especially if it continues to struggle to surpass resistance at 23,620.
A breakout above 23,620 would be a bullish development despite a number of bearish signals. It would suggest the potential for the index to rise to 23,800 and possibly back to the previous highs.
Written by Michael J. Kramer, founder of Mott Capital Management.
Disclaimer: CMC Markets is an execution-only service provider. The material (whether or not it states any opinions) is for general information purposes only and does not take into account your personal circumstances or objectives. Nothing in this material is (or should be considered to be) financial, investment or other advice on which reliance should be placed.
No opinion given in the material constitutes a recommendation by CMC Markets or the author that any particular investment, security, transaction, or investment strategy is suitable for any specific person. The material has not been prepared in accordance with legal requirements designed to promote the independence of investment research. Although we are not specifically prevented from dealing before providing this material, we do not seek to take advantage of the material prior to its dissemination.

Nas100 Trade Set Up Aug 28 2025FX:NAS100
www.tradingview.com
Price has made HH/HL but is approaching PDH so if we sweep it i will look for internal structure and IFVG on the 1m-3m to target SSL and PDL

US100: Ready to rise further after good US dataUS100: Ready to rise further after good US data
Today the US reported very good data in general. Despite being preliminary data, they are still showing signs of a strong economy.
Tomorrow the US will report the final data and they have a good chance of being higher than expected.
Given that the US continues to have strong data despite the mess that Trump is creating, there is a good chance that the indices will continue to rise further. They are a clear indicator of the US economy. We must be careful of any manipulation that may occur or from Trump's comments.
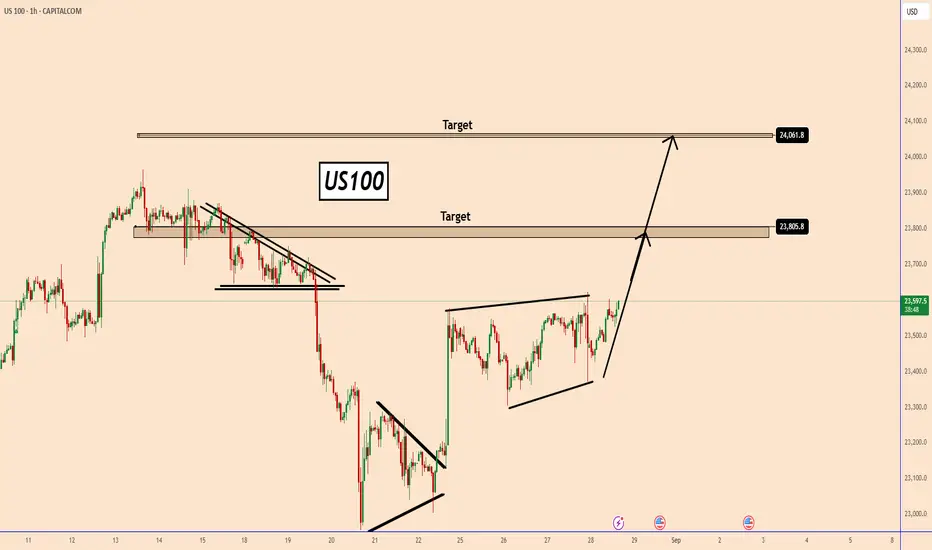
US100 completed a clear bullish pattern and it could reach 23800 and 24100 soon
You may find more details in the chart!
Thank you and Good Luck!
PS: Please support with a like or comment if you find this analysis useful for your trading day
US initial jobless claims 229K vs 230K expected
US GDP 2nd estimate for Q2 3.3% vs 3.1% estimate
US PCE prices preliminary 2.0% vs 2.1% preliminary
PCE ex food and energy housing 2.2% versus 2.2% preliminary

NAS100 ShortElite Analysis
Executed off 4H structured liquidity
Targeting lower liquidity pools
Executed in a smaller time frame

Nasdaq 100 Awaits Breakout After Earnings ReactionUSNAS100 – Overview
On Thursday, the Nasdaq saw only slight moves as investors assessed Nvidia’s quarterly earnings. Price action is consolidating around a key support level.
Technical Outlook
If price holds above 23,560, bullish momentum remains in place, targeting 23,690 → 23,870.
A drop below 23,560 would keep the index range-bound between 23,560 – 23,435.
A confirmed breakdown requires a close below 23,435, which would signal bearish continuation.
Key Levels
Resistance: 23,560 – 23,435.
Support: 23,690 – 23,870.


NAS100 H4 | Bearish Reversal off Pullback Resistance"NAS100 is rising towards the sell entry at 23,679.28, which is a pullback resistance and could reverse from this level ot the take profit.
Stop loss is at 23,939.64, which is a swing high resistance.
Take profit is at 23,292.38, which is a pullback support that alignss with the 50% Fibonacci retracement.
High Risk Investment Warning
Trading Forex/CFDs on margin carries a high level of risk and may not be suitable for all investors. Leverage can work against you.
Stratos Markets Limited (tradu.com ):
CFDs are complex instruments and come with a high risk of losing money rapidly due to leverage. 65% of retail investor accounts lose money when trading CFDs with this provider. You should consider whether you understand how CFDs work and whether you can afford to take the high risk of losing your money.
Stratos Europe Ltd (tradu.com ):
CFDs are complex instruments and come with a high risk of losing money rapidly due to leverage. 66% of retail investor accounts lose money when trading CFDs with this provider. You should consider whether you understand how CFDs work and whether you can afford to take the high risk of losing your money.
Stratos Global LLC (tradu.com ):
Losses can exceed deposits.
Please be advised that the information presented on TradingView is provided to Tradu (‘Company’, ‘we’) by a third-party provider (‘TFA Global Pte Ltd’). Please be reminded that you are solely responsible for the trading decisions on your account. There is a very high degree of risk involved in trading. Any information and/or content is intended entirely for research, educational and informational purposes only and does not constitute investment or consultation advice or investment strategy. The information is not tailored to the investment needs of any specific person and therefore does not involve a consideration of any of the investment objectives, financial situation or needs of any viewer that may receive it. Kindly also note that past performance is not a reliable indicator of future results. Actual results may differ materially from those anticipated in forward-looking or past performance statements. We assume no liability as to the accuracy or completeness of any of the information and/or content provided herein and the Company cannot be held responsible for any omission, mistake nor for any loss or damage including without limitation to any loss of profit which may arise from reliance on any information supplied by TFA Global Pte Ltd.
The speaker(s) is neither an employee, agent nor representative of Tradu and is therefore acting independently. The opinions given are their own, constitute general market commentary, and do not constitute the opinion or advice of Tradu or any form of personal or investment advice. Tradu neither endorses nor guarantees offerings of third-party speakers, nor is Tradu responsible for the content, veracity or opinions of third-party speakers, presenters or participants.

Nas100 market analysis #NAS100 technical analysis. Price has dropped down to our trend line in support levels. Price should continue to go up here back to resistance levels.

SHORT ON NAS100Using the 1h, 15m, and 5m bearish fvg the market need fill the gaps above 50% Fib range. Targeting the lows as the TPs
