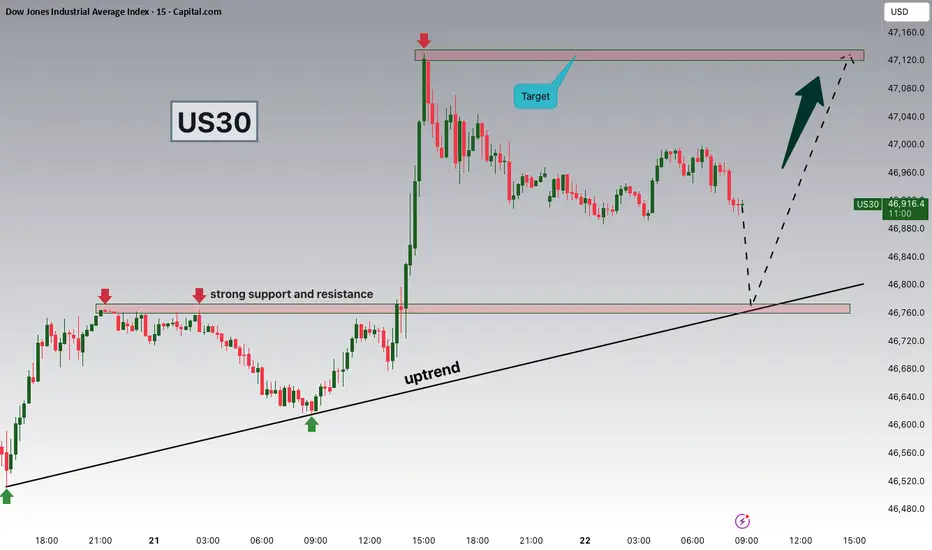
US30 Eyes 47,200 for Potential BounceHey Traders, in today’s trading session we’re monitoring US30 for a potential buying opportunity around the 47,200 zone.
The Dow Jones continues to trade in a broader uptrend, and price action is currently in a correction phase, approaching the 47,200 support and resistance confluence area — a key zone where buyers may look to step back in.
Watching for a bullish reaction at this level to confirm continuation of the prevailing trend.
Share your view below — do you think US30 holds this zone or breaks lower?
Trade safe,
Joe.
Trade ideas

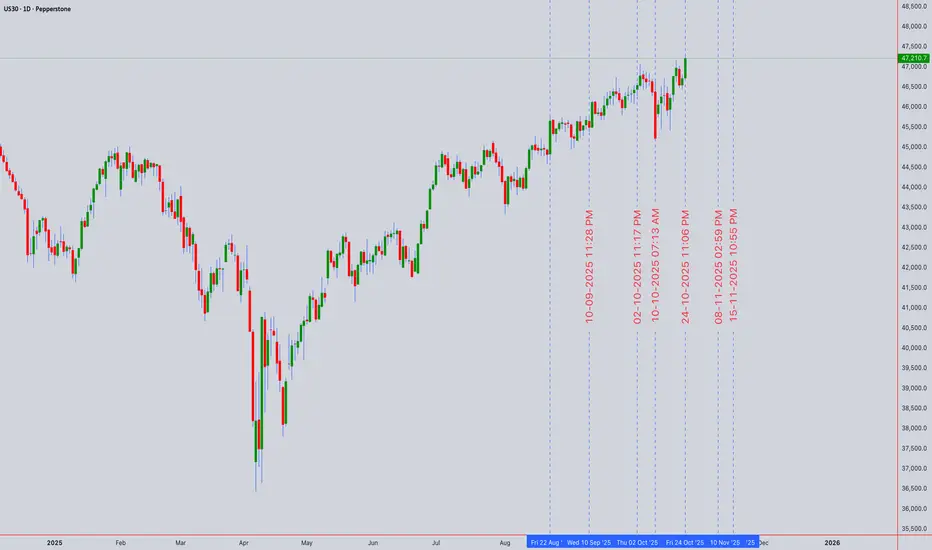
DOW JONES approaching the end of its Bull Cycle?Dow Jones (DJI) has been trading within a 16-year Channel Up ever sine the March 02 2009 market bottom of the U.S. Housing Crisis. As this chart shows, we have divided this pattern into three different phases.
Since the March 2020 COVID crash, it appears that the Cycle got restarted as the index broke below its 1W MA200 (orange trend-line) again after 10 years. Technically that was the only time that multi-year Support trend-line broke in 15 years.
In any case, following that Cycle 'restart', it appears that the index is currently inside the Megaphone pattern that in 2015 concluded Phase 2. The conclusion came with a second test on the 1W MA200 (Double Bottom). The first test was the April 07 2025 Low.
With their 1W RSI sequences also identical, having the first 1W MA200 forcing a 30.00 (oversold) RSI rebound, we expect the index to start a new Bearish Leg that might potentially test the 1W MA200 around 39000. For long-term investors, that is the market's next Buy Entry.
-------------------------------------------------------------------------------
** Please LIKE 👍, FOLLOW ✅, SHARE 🙌 and COMMENT ✍ if you enjoy this idea! Also share your ideas and charts in the comments section below! This is best way to keep it relevant, support us, keep the content here free and allow the idea to reach as many people as possible. **
-------------------------------------------------------------------------------
💸💸💸💸💸💸
👇 👇 👇 👇 👇 👇

US30 Looking bearish trend a short-term ForecastThe US30 index has retested its recent highs, and a short-term pullback appears likely as the new trading week begins.
Technically, price action suggests that after reaching the top once again, the index may retrace to recover lost ground. Local investors are closely watching the midweek release of September economic data, which will provide further insight into the Federal Reserve’s potential interest rate path. Market participants largely anticipate a rate cut later this week, which could inject renewed volatility into equities.
The market opened with a gap, indicating possible short-term indecision If the gap is filled, a rejection from resistance could trigger a decline toward the support zone between 46,800 and 46,000 Sustained buying pressure above resistance would invalidate the bearish setup and could signal further upside momentum.
You may find more details in the chart.
Trade wisely best of Luck buddies.
Ps; Support with like and comments for better analysis Thanks for Supporting.

DJI (US30) SPOT TECHNICAL ANALYSIS 📊 DJI (US30) SPOT TECHNICAL ANALYSIS | Oct 27-31, 2025 | Intraday Swing Trading Blueprint 🚀
Current Price: 42,210.7 | Timeframe Focus: 5M, 15M, 30M, 1H, 4H & 1D ⏰
━━━━━━━━━━━━━━━━━━━━━━━━━━━━━━━━━━━━━━━━━━━━━━━
🔍 DAILY (1D) ANALYSIS - Swing Trade Framework
On the daily timeframe, DJI exhibits strong bullish momentum with price trading above key exponential moving averages (EMA 50 & 200). 📈 The Ichimoku Cloud shows bullish alignment with price above the cloud, indicating sustained uptrend. Elliott Wave analysis suggests we're in Wave 3 or Wave 5 of an impulse sequence.
Key Support: 41,800-42,000 | Key Resistance: 42,500-42,800
Bollinger Bands on 1D are expanding, confirming rising volatility . RSI hovers near 60-70 zone (approaching overbought but not critical). Volume profile shows accumulation phases at lower levels with distribution emerging at current price action. Dow Theory confirms higher highs and higher lows pattern intact. 💪
━━━━━━━━━━━━━━━━━━━━━━━━━━━━━━━━━━━━━━━━━━━━━━━
⚡ 4-HOUR (4H) SWING TRADE Setup - PRIMARY ENTRY SIGNAL
4H chart displays bullish breakout potential above 42,400 resistance. Harmonic Pattern analysis reveals potential Gartley reversal at support (41,950-42,050). RSI at 65 indicates strong momentum without extreme overbought conditions. 📊
Wyckoff Accumulation: Identified spring pattern suggesting buyers in control
VWAP Analysis: Price above VWAP = bullish bias maintained
Volume Breakout: Watch for volume spike above 42,400 for confirmation
Gann Theory Angle: 45° resistance level aligns with psychological 42,500 mark. Entry on breakout with stop loss at 42,050. Target: 42,650 for quick swing profits! 🎯
━━━━━━━━━━━━━━━━━━━━━━━━━━━━━━━━━━━━━━━━━━━━━━━
🎯 1-HOUR (1H) INTRADAY SCALP SETUP
Hourly timeframe shows consolidation within 42,100-42,300 range . Elliott Wave suggests completion of Wave 2 correction with Wave 3 breakout imminent. 💥 Bollinger Bands are contracting = volatility squeeze incoming!
RSI oscillates near 50 (neutral zone) - PERFECT setup for directional bias confirmation. Support holds at 42,150 (VWAP cluster). Resistance breakout at 42,350 triggers aggressive long entry.
Harmonic Pattern Recognition: Butterfly reversal pattern forming near support zone. Risk/Reward ratio: 1:3 on breakout trades! 📈
━━━━━━━━━━━━━━━━━━━━━━━━━━━━━━━━━━━━━━━━━━━━━━━
⏱️ 30-MINUTE (30M) TACTICAL ENTRY GUIDE
30M timeframe is CRITICAL for entry timing ! Currently showing micro-consolidation with 3 candle reversal pattern forming. Ichimoku Cloud on 30M provides dynamic support around 42,200.
Watch for: Channel breakout above 42,280 for aggressive long setup
Simple Moving Average (SMA 20) acts as dynamic support. Exponential Moving Average (EMA 9) shows bearish crossover risk - key reversal indicator! ⚠️ RSI dip below 50 offers contrarian entry for counter-trend scalps.
Volume Spike Incoming: Wyckoff Distribution phase detected - anticipate volatility expansion into London/US session open! 🌍
━━━━━━━━━━━━━━━━━━━━━━━━━━━━━━━━━━━━━━━━━━━━━━━
🚀 15-MINUTE (15M) MOMENTUM BREAKOUT SETUP
Perfect swing trade entry timeframe ! 15M displays textbook Elliott Wave 5-wave pattern completing. Price oscillating in 42,150-42,350 box. 📦
Bollinger Band Squeeze: Expansion breakout imminent this week
RSI Divergence: Bullish reversal divergence between last two lows
VWAP Bounce: Strong rejection from VWAP = trend resumption likely
Dow Theory Confirmation: Higher lows maintained perfectly. Harmonic Pattern (Gartley) completion nearing 42,050-42,100. Gann angles converge at 42,420 - MAJOR BREAKOUT ZONE! 🎯
━━━━━━━━━━━━━━━━━━━━━━━━━━━━━━━━━━━━━━━━━━━━━━━
⚡ 5-MINUTE (5M) ULTRA-SCALP ENTRIES - EXECUTION TIMING
5M chart = TRADE EXECUTION window ! Shows tight consolidation within 15 pips range (42,210-42,225). Japanese candlestick patterns reveal Doji + Hammer reversal formations. 🔨
Ichimoku Cloud on ultra-low timeframe provides micro S&R; levels. RSI oscillating 45-55 zone = prepare for directional breakout. Volume surge on breakout candle = GREEN LIGHT for entry! 💚
Bollinger Bands on 5M are at tightest compression - expect violent move incoming! Stop losses tight at 42,190 for risk management.
Target 1: 42,280 | Target 2: 42,350 | Target 3: 42,420
━━━━━━━━━━━━━━━━━━━━━━━━━━━━━━━━━━━━━━━━━━━━━━━
📌 WEEKLY TRADING STRATEGY (Oct 27-31)
BULLISH BIAS DOMINATES across all timeframes! Wyckoff accumulation + Elliott Wave Wave 3 setup = explosive move likely. RSI proximity to overbought (not yet extremes) = continuation room.
Key Trading Rules:
Harmonic Pattern targets hit first = take 50% profits
Gann angles breached = add to position
VWAP rejection at support = reversal setup triggered
Volume confirmation on breakouts = only trade valid entries
Volatility Expected: Bollinger Band width expansion + options expiry week = 150-200 pips potential range! 🔥
Reversals Watch: Identifying overbought RSI extremes above 75 triggers pullback potential. Support zones (42,050-42,100) act as reversal pivots. Breakout failures at 42,500 = harmonic reversal zones activate.
Risk Management Critical: Use tight stops at 42,190. Take profits at Gann angles. Scale in using Wyckoff distribution signals. Ichimoku Cloud breakouts = strong follow-through probability.
━━━━━━━━━━━━━━━━━━━━━━━━━━━━━━━━━━━━━━━━━━━━━━━
🎯 FINAL VERDICT: BUY breakout above 42,400 | HOLD through 42,500-42,650 targets | EXIT on harmonic reversal signals
#DJI #US30Spot #TechnicalAnalysis #ElliottWave #SwingTrading #IntraDayTrading #Harmonic #WyckoffMethod #TradingView #ForexAnalysis #StockMarket #CryptoCommunity #TradersOfTwitter #TechnicalAnalyst #BreakoutTrade #MomentumTrading #VolumeAnalysis #VWAP #BollingerBands #RSI #Ichimoku #GannTheory #DowTheory #TradingSignals #Oct2025 🚀📊💹
━━━━━━━━━━━━━━━━━━━━━━━━━━━━━━━━━━━━━━━━━━━━━━━
Disclaimer: This analysis is educational only. Not financial advice. Always trade with proper risk management and your own analysis. Past performance ≠ future results. Trade at your own risk! ⚠️
Study the charts, confirm setups, and execute with precision! Happy trading! 🎯💰
US30 Ready for shorts?Momentum on US30 is finally slowing. Character of price action is indicating short term shorts for a continuation of longs. Price is very overextended currently. I would have preferred a few pips in longs to major key level before sells, but current price action is hinting at shorts, and you do not want to miss it if that is the case. Waiting for my entry criteria to enter sells. Best of luck. Manage Risk!

Dow Jones – Bearish Leg Expected Toward 46,500
After several attempts to hold above the 48,000 zone, the **Dow Jones Index (US30)** is showing clear signs of exhaustion on the higher timeframes.
The current market structure suggests a potential **corrective move toward 46,500**, which aligns with the 0.618 Fibonacci retracement level and previous demand zone.
If the 47,800–48,000 resistance area continues to hold, sellers are likely to push the price lower in the coming sessions.
A clean break below **47,200** could confirm further downside momentum.
⚠️ I’ll be watching the 46,500 area for potential reversal signals or signs of accumulation.
---
#US30 #DowJones #DJI #Index #Trading #MarketStructure #TechnicalAnalysis #PriceAction #Bearish #Forex

DowJones Key Trading LevelsKey Support and Resistance Levels
Resistance Level 1: 48085
Resistance Level 2: 48255
Resistance Level 3: 48500
Support Level 1: 47260
Support Level 2: 47040
Support Level 3: 46880
This communication is for informational purposes only and should not be viewed as any form of recommendation as to a particular course of action or as investment advice. It is not intended as an offer or solicitation for the purchase or sale of any financial instrument or as an official confirmation of any transaction. Opinions, estimates and assumptions expressed herein are made as of the date of this communication and are subject to change without notice. This communication has been prepared based upon information, including market prices, data and other information, believed to be reliable; however, Trade Nation does not warrant its completeness or accuracy. All market prices and market data contained in or attached to this communication are indicative and subject to change without notice.

DOW JONES 30 HIGH PROBABILITY SETUP SOON!!!🚨 DJ30 HIGH PROBABILITY SELL SETUP 🚨
* Here We Can See Clearly The Next Potential Moves For US30 Coming Hours/Days.
* Keep Your Eyes Close On Your Trading Positions.
* Happy PIP Hunting Traders.
FXKILLA.

US30US30 has taken the top one more time, now we are expecting a Pullback to start this week.
Disclosure: We are part of Trade Nation's Influencer program and receive a monthly fee for using their TradingView charts in our analysis.

US30 Trade Set Up Oct 27 2025Price ended up making ATH in Asia session closing above PDH and creating a 4h FVG which has been filled along with Asia lows/SSL being swept so i am expecting price to continue bullish to London highs/BSL

Dow Jones Testing 46,760 – Bounce or Breakdown Ahead?Hey Traders, in today’s trading session we’re closely monitoring US30 for a buying opportunity around the 46,760 zone. The Dow Jones remains in a broader uptrend and is currently undergoing a correction phase, approaching a key support and resistance confluence at 46,760.
Market Structure:
The index continues to print higher highs and higher lows, confirming bullish market structure. The current retracement could offer a potential continuation setup if buyers regain control near this level.
Key Level:
46,760 — an important technical zone where trendline support meets horizontal structure, providing a potential reaction point for bulls.
Outlook:
If buying pressure emerges from this area, a move toward 47,400–47,600 could be on the table in the coming sessions.
💬 What’s your take on US30 here?
Do you see a bounce from support or a deeper pullback coming? Share your view in the comments!
Trade safe,
Joe.
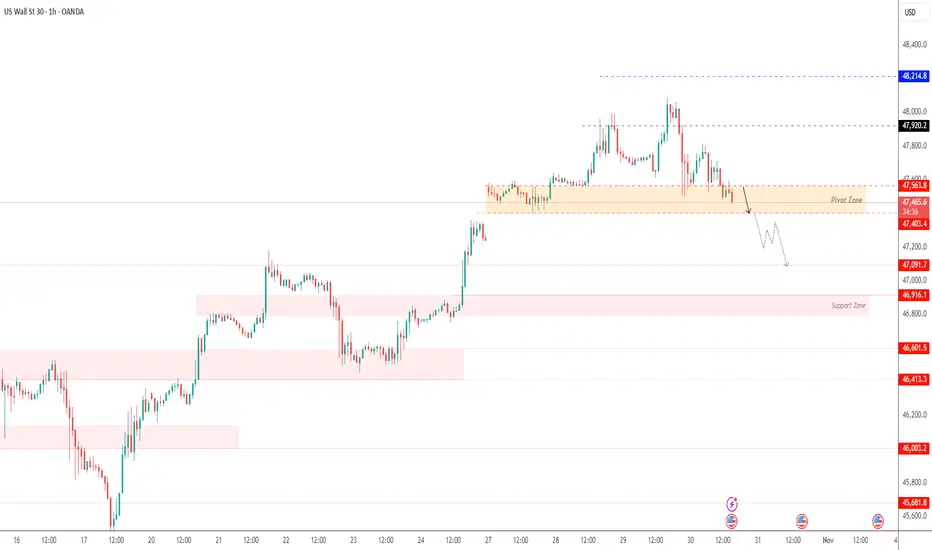
US30 - Testing Key Support Zone Amid Bearish PressureUS30 – MARKET OUTLOOK | Testing Key Support Zone Amid Bearish Pressure 🇺🇸
The Dow Jones is testing the 47,400 support zone, with downside pressure still dominant.
A 1H close below 47,400 would confirm continuation toward 47,090 → 46,920.
However, a 1H close above 47,620 may trigger a bullish rebound toward 47,920 → 48,000.
Pivot: 47,565
Support: 47,400 · 47,100 · 46,920
Resistance: 47,670 · 47,920 · 48,000
US30 remains bearish below 47,565, but a breakout above 47,620 could shift momentum to bullish.
US 30 UpdateNext move on the way, focus on proper risk management & stay discipline. Wishing you successful trades..!
Key Reason:
1. Market structure was bullish.
2. H1 support area fresh and unmitigated.
3. Hidden OB formation.
4. Wait for retracement and confirmation.
This is not a financial advise take it with your own risk. Let's see how it will work.

US30The Dow Jones index is at the end of its upward movement. The maximum level of increase is 48150, and then the price will decrease and correct, and we will definitely have sharp spikes to the downside with the release of economic news. This weekend and the week ahead will be exciting days for the indices. The price reduction levels are indicated in the analysis. The risk of short positions is very low.
This was a personal opinion and the trading responsibility lies with each person.

DOW JONES INDUSTRIAL HIGH PROBABILITY SETUP SOON!!!🚨 DJ30 HIGH PROBABILITY SELL SETUP 🚨
* Here We Can See Clearly The Next Potential Move For US30 Coming Hours/Days.
* Keep Your Eyes Close On Your Trading Positions.
* Happy PIP Hunting Traders.
FXKILLA.

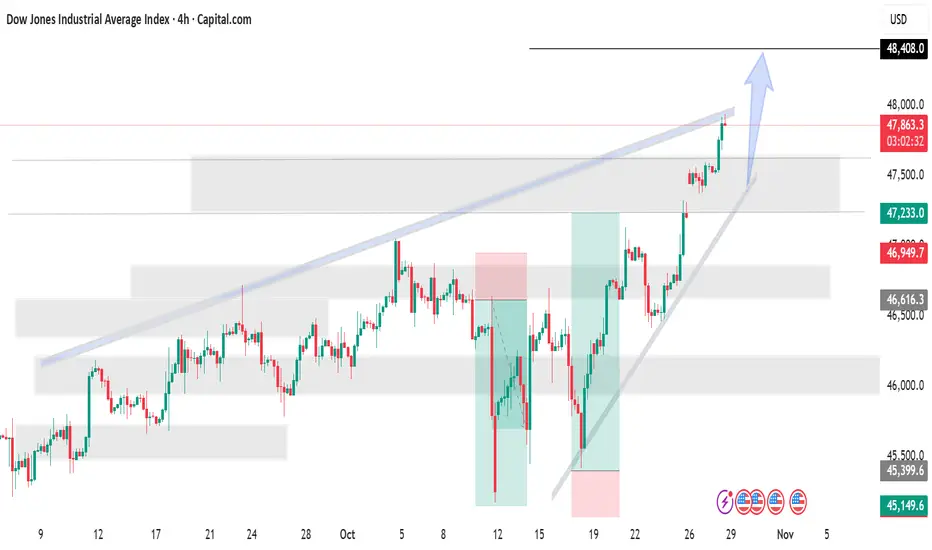
DOWJONES Strong Gains Continue on Solid Earnings and Trade HopesUS30 – MARKET OVERVIEW | Strong Bullish Momentum Continues 🇺🇸
The Dow Jones continues to extend its strong gains, adding more than +400 points since yesterday, supported by optimism surrounding tariff developments and solid corporate earnings.
The index maintains a bullish structure, and as long as it trades above 47,570, the trend is expected to continue toward 48,220.
A short-term retest toward 47,570 would be considered normal within the ongoing bullish momentum.
However, a confirmed 15-minute candle close below 47,370 would shift sentiment to bearish, targeting 47,090 as the next key support.
Key Technical Levels
Pivot Line: 47,570
Resistance: 48,210 · 48,550
Support: 47,090 · 46,900
Outlook:
US30 remains bullish while above 47,570, targeting 48,220 and possibly higher.
Only a 15-minute close below 47,370 would signal a short-term correction toward 47,090.

The Great Reset In a modern equivalent of the 1929 stock market crash, a rapid and severe market collapse would be triggered by a combination of overleveraged speculation, inflated tech valuations, and sudden shifts in global monetary policy. Within days, trillions in market value could vanish as algorithmic trading amplifies the sell-off, investor panic spreads through social media, and liquidity dries up. Major financial institutions could face insolvency risks, prompting emergency interventions from central banks and triggering a global recession reminiscent of the Great Depression—now unfolding at digital speed.

US30 - Potential TargetsDear friends in trading,
As long as equities are making HH's it's going up...
The yellow line will serve as breakout support for the new ATH.
Keynote:
The government shutdown has the markets uneasy and unpredictable - BE SAFE
Thank you for taking the time to study my analysis.

DJIShift prediction to the right.
Global market cooler anticipated. Crypto should be hit the hardest and fastest.
Most anticipating rally continuation like post-COVID...
I think that will cause a surprise.

US30Trading forex based on strong fundamentals is beneficial because it allows investors to make informed decisions grounded in real economic data rather than speculation. By analyzing key indicators like interest rates, inflation, GDP growth, employment, and geopolitical stability, a trader can anticipate currency movements driven by macroeconomic forces. This approach helps identify long-term trends and reduces emotional or impulsive trading, offering more consistent and sustainable profits. In essence, good fundamentals turn forex trading from a gamble into a strategic investment rooted in economic reality.

Us30 long US30 (Dow Jones Index) – Market Outlook & Trade Setup
Currently observing a potential bullish reaction from the demand zone around the 47,500 region after multiple rejections at this level.
If price maintains above this support, I’m anticipating a continuation toward the 48,180 area — aligning with prior liquidity and supply levels.
This setup combines:
• Structure confirmation from previous higher lows
• Demand zone retest for potential entry
• Clear risk-to-reward framework with defined targets
Patience and precision remain key. Let’s see how price action develops going into the next session. 📊
#US30 #MarketAnalysis #TradingInsights #DowJones #TechnicalAnalysis #FinancialMarkets

US30 ForecastThe Dow Jones Industrial Average Index is showing strong bullish momentum breaking above the ascending channel resistance. Price is holding above the 47,800 support zone and aiming toward the next key resistance near 48,400. The clear uptrend structure and breakout projection suggest further upside continuation, with buyers maintaining firm control.
"Thank you for your support! If you found this idea valuable or learned something new, please consider liking and leaving a comment. I’d really appreciate hearing your feedback and thoughts."
US30 Trade Set Up Oct 30 2025price is making bearish structure on the 1h and 15m so i want to see a sweep of BSL and/or tap into 15m FVG before looking for internal 1m-5m IFVG/CISD to target daily FVG and SSL
