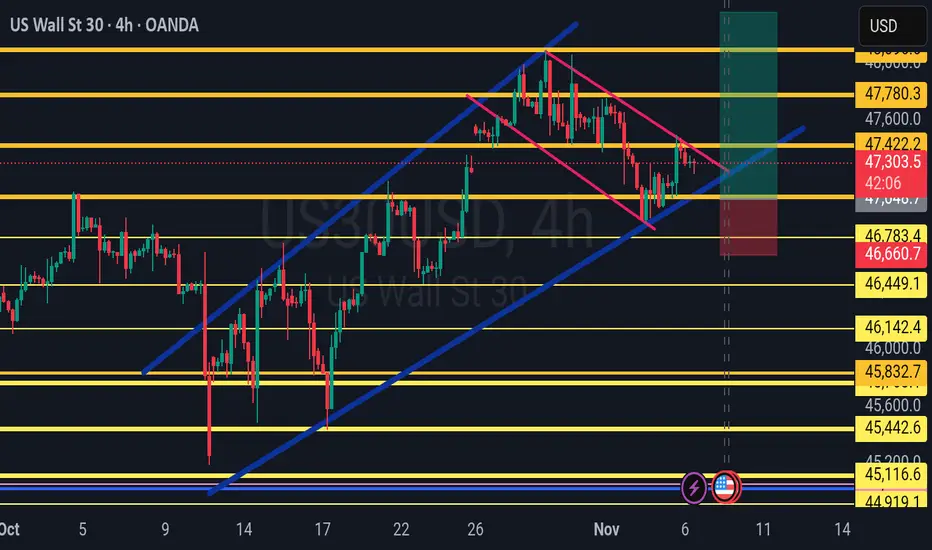
US30 LONG SETUP Price is looking to test 48.000 again after a strong correction that pushed it back to 47. region. Healthy support around 47 has been met on point with the 50% fib level. Strong push back to 48 is promising.
Trade ideas
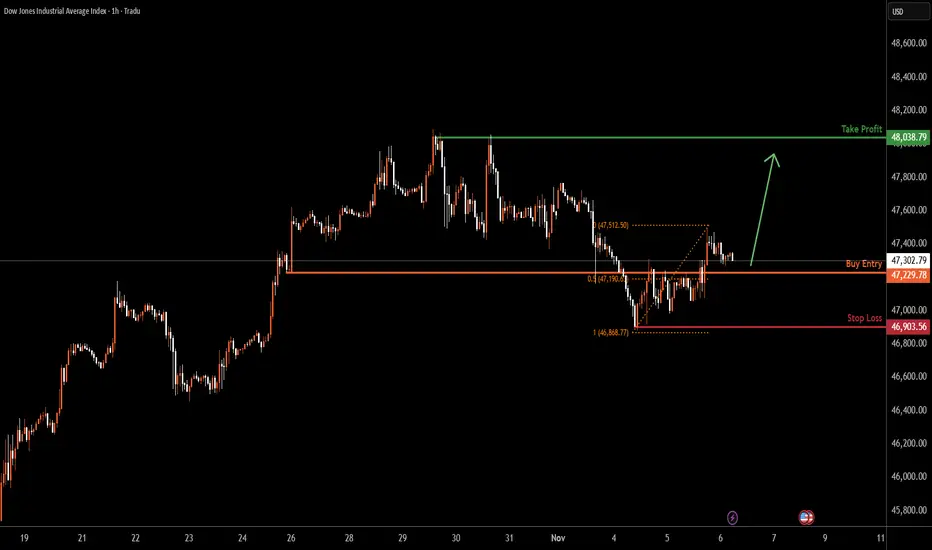
US30 H1 | Bullish Bounce Off 50% Fibonacci SupportUS30 is falling towards the buy entry at 47,229.78, whichis an overlap support that aligns witht he 50% Fibonacci retracement and could bounce from this level to the upside.
Stop loss is at 46,903.56, which is a swing low support.
Take profit is at 48,038.79, which is a multi swing high resistance.
Stratos Markets Limited (tradu.com ):
CFDs are complex instruments and come with a high risk of losing money rapidly due to leverage. 68% of retail investor accounts lose money when trading CFDs with this provider. You should consider whether you understand how CFDs work and whether you can afford to take the high risk of losing your money.
Stratos Europe Ltd (tradu.com ):
CFDs are complex instruments and come with a high risk of losing money rapidly due to leverage. 70% of retail investor accounts lose money when trading CFDs with this provider. You should consider whether you understand how CFDs work and whether you can afford to take the high risk of losing your money.
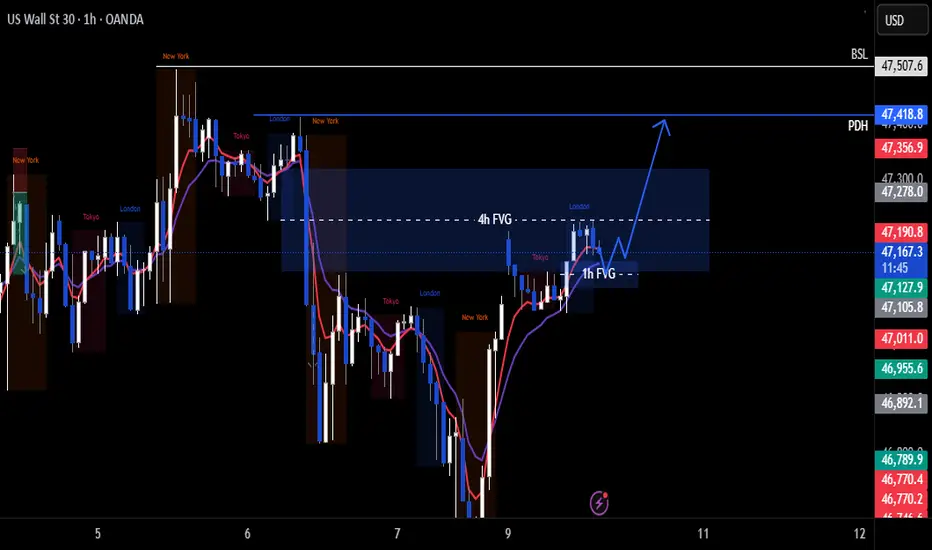
US30 Trade Set Up Nov 10 2025Price has changed state to a bullish trend making HH/HL on the 4h and 1h so i will wait for more internal structure to form and/or a tap into bullish 1h FVG before looking for IFVG/CISD on the 1m-5m to target higher BSL/PDH
BUY NOW US30!!!!!US30 made a strong price rejections off my poi after a wild moves in the market yesterday am looking forward to see price made a strong pull back up to 48k trend is still bullish we just closed a gap without taking out our internal structure lows....

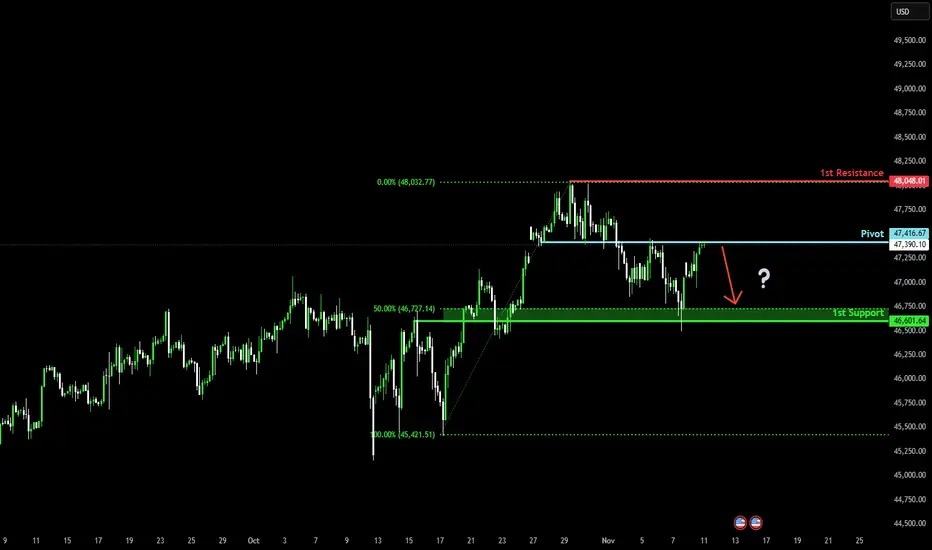
Could we see a reveral from here?Dow Jones (US30) is reacting off the pivot, which is an overlap resistance, and could reverse to the 1st support.
Pivot: 47,416.67
1st Support: 46,601.64
1st Resistance: 48,048.01
Disclaimer:
The above opinions given constitute general market commentary, and do not constitute the opinion or advice of IC Markets or any form of personal or investment advice.
Any opinions, news, research, analyses, prices, other information, or links to third-party sites contained on this website are provided on an "as-is" basis, are intended only to be informative, is not an advice nor a recommendation, nor research, or a record of our trading prices, or an offer of, or solicitation for a transaction in any financial instrument and thus should not be treated as such. The information provided does not involve any specific investment objectives, financial situation and needs of any specific person who may receive it. Please be aware, that past performance is not a reliable indicator of future performance and/or results. Past Performance or Forward-looking scenarios based upon the reasonable beliefs of the third-party provider are not a guarantee of future performance. Actual results may differ materially from those anticipated in forward-looking or past performance statements. IC Markets makes no representation or warranty and assumes no liability as to the accuracy or completeness of the information provided, nor any loss arising from any investment based on a recommendation, forecast or any information supplied by any third-party.
US30 Day Trader Analysis US30 Day TraderAnalysis - 10 Nov 2025
Dow Jones 30 at 47,171 (4:30 PM UTC+4) — consolidation breakout setup forming.
📌 Market Context: Wyckoff Phase D accumulation post-October rally; Dow Theory primary uptrend intact with minor pullback; Gann Square-of-9 targets 47,600/46,800.
🗺️ Multi-Timeframe Pulse:
1D: Broadening wedge 46,800-47,500; RSI 61 (mild bearish divergence); Ichimoku cloud support 46,500; bullish pennant nearing breakout.
4H: Rising channel 47,000-47,400; EMA21>EMA50>EMA200 (golden cross); VWAP anchored Oct 1 = 46,950 (buy support).
1H: Cup-and-handle breakout base 47,050; BB expanding; VWAP slope bullish after morning dip test.
30M: Symmetrical triangle 47,100-47,250; hidden bull divergence on RSI; volume contracting pre-expansion.
15M: Bull flag above 47,120; Tenkan>Kijun bullish alignment; stochastic RSI reset ready for next leg.
5M: Falling wedge retest 47,140; hammer candlestick confirms demand; watch false breakout above 47,280.
🎯 PRIMARY LONG SETUP
Entry: 47,120-47,155 (triangle support + VWAP) — confirm on 15M bullish close >47,180.
Stop Loss: 47,050 (below triangle base).
Target 1: 47,250 (+80-130 pips).
Target 2: 47,400 (+230-280 pips — channel top).
Target 3: 47,550 (+400 pips — harmonic extension).
Confirmation: RSI>55, volume +20%, VWAP support holding.
⚡ MOMENTUM ADD: Scale above 47,400 ONLY if RSI>65 + volume surge; trail stop to 47,350.
🔻 REVERSAL SHORT SETUP
Entry: 47,500-47,600 (supply zone) — trigger on bearish engulfing + RSI divergence.
Stop Loss: 47,700 (above channel resistance).
Targets: 47,350 → 47,200 → 47,000 (Gann support).
Confirmation: 5M/15M RSI bearish divergence; BB upper band rejection.
🚨 BREAKOUT PROTOCOL:
BULL: 1H close >47,400 confirms wedge breakout; target 47,700; move stop to BE+20.
BEAR: 1H close <47,100 with volume expansion triggers retest 46,800 Gann support.
📊 INDICATOR SNAPSHOT: BB squeeze (30M) tightening; MACD histogram positive; VWAP slope up; EMA21 acting as trigger line on 1H.
⚠️ PATTERN ALERTS: Harmonic bat PRZ at 47,600; pennant breakout target aligns 47,550; channel failure <47,120 = Wyckoff spring risk; watch H&S if neckline 47,000 breaks.
📈 TIMING & VOLATILITY: US market close 21:00 UTC; earnings whispers elevate volatility; Gann 90° cycle 20:30 UTC. ATR(14) ≈150 pts expect 1.5% range. Risk ≤1% per setup; lock gains TP1; avoid chasing.
Educational analysis only. Align with your plan, manage risk diligently, adapt to live price action.

check the trendThe uptrend is expected to continue to the specified resistance levels, then a continuation of the downtrend is likely.
If the index breaks through the 78.6% level, an uptrend is possible.

US30 Technical Breakdown – 11/10/2025📍 US30 Technical Breakdown – 11/10/2025
US30 is still trading within a wide consolidation range as price tests the mid-zone around 47,200–47,400. After last week’s dip toward 46,500, buyers stepped back in to defend structure — but momentum remains mixed. ⚖️
📊 Market Behavior:
🔹 Price reclaimed 47,000 support after a sharp bounce
🔹 EMAs converging → showing indecision / balance
🔹 Range remains between 46,500 – 47,400, with 48K still acting as the upper ceiling
📌 Key Levels:
🔹 Resistance:
47,400–47,410 → intraday supply zone
47,800 → minor reaction area
48,000 → strong psychological cap
🔹 Support:
47,000 → intraday structure
46,520 → range floor
45,550 → major swing low
🧠 Bias:
Neutral with slight bullish tilt 📈
⬆️ Break above 47,400 → opens road to 47,800–48,000
⬇️ Drop below 47,000 → could send price back toward 46,500

Potential bullish bounce off?Dow Jones (US30) has bounced off the pivot, which is a pullback support and could rise to the 1st resistance, which is a swing high resistance.
Pivot: 46,869.22
1st Support: 46,429.35
1st Resistance: 48,012.20
Disclaimer:
The above opinions given constitute general market commentary, and do not constitute the opinion or advice of IC Markets or any form of personal or investment advice.
Any opinions, news, research, analyses, prices, other information, or links to third-party sites contained on this website are provided on an "as-is" basis, are intended only to be informative, is not an advice nor a recommendation, nor research, or a record of our trading prices, or an offer of, or solicitation for a transaction in any financial instrument and thus should not be treated as such. The information provided does not involve any specific investment objectives, financial situation and needs of any specific person who may receive it. Please be aware, that past performance is not a reliable indicator of future performance and/or results. Past Performance or Forward-looking scenarios based upon the reasonable beliefs of the third-party provider are not a guarantee of future performance. Actual results may differ materially from those anticipated in forward-looking or past performance statements. IC Markets makes no representation or warranty and assumes no liability as to the accuracy or completeness of the information provided, nor any loss arising from any investment based on a recommendation, forecast or any information supplied by any third-party.

us30bias: sell
setup EW (Ride Wave 5)
EP: fvg-h4 (pening US Open)
SL: Previous Daily High
TP: Previous Daily Low

US30 - Bearish Momentum Extends After 1.5% DropUS30 – MARKET OUTLOOK | Bearish Momentum Extends After 1.5% Drop 🇺🇸
The Dow Jones remains under pressure after a sharp 1.5% decline, with sellers maintaining control in the short term.
🔽 Below 46,920: Bearish continuation toward 46,800 → 46,600 → 46,410.
🔼 Above 46,920: Bullish recovery toward 47,100 → 47,440.
Pivot: 46,920
Support: 46,790 · 46,450 · 46,020
Resistance: 47,100 · 47,440 · 47,560
US30 stays bearish while below 46,920, but a confirmed 1H close above this level could shift tone to bullish in the near term.

US30 Trade Set Up Nov 4 2025Price pushed down hard during Asia and London and is making bearish structure so i will be looking for sells either after a sweep of BSL and tap into 4h FVG or if we invert this 15m FVG with a retest i will take sells down to SSL/London lows and lower 4h FVG

Dow Jones – Bearish Leg Expected Toward 46,500
After several attempts to hold above the 48,000 zone, the **Dow Jones Index (US30)** is showing clear signs of exhaustion on the higher timeframes.
The current market structure suggests a potential **corrective move toward 46,500**, which aligns with the 0.618 Fibonacci retracement level and previous demand zone.
If the 47,800–48,000 resistance area continues to hold, sellers are likely to push the price lower in the coming sessions.
A clean break below **47,200** could confirm further downside momentum.
⚠️ I’ll be watching the 46,500 area for potential reversal signals or signs of accumulation.
---
#US30 #DowJones #DJI #Index #Trading #MarketStructure #TechnicalAnalysis #PriceAction #Bearish #Forex

US30 BULLHI
Simple market structure.
The chart speaks for itself
Quick resume, the market is currently goin through correction for bullish continuation.

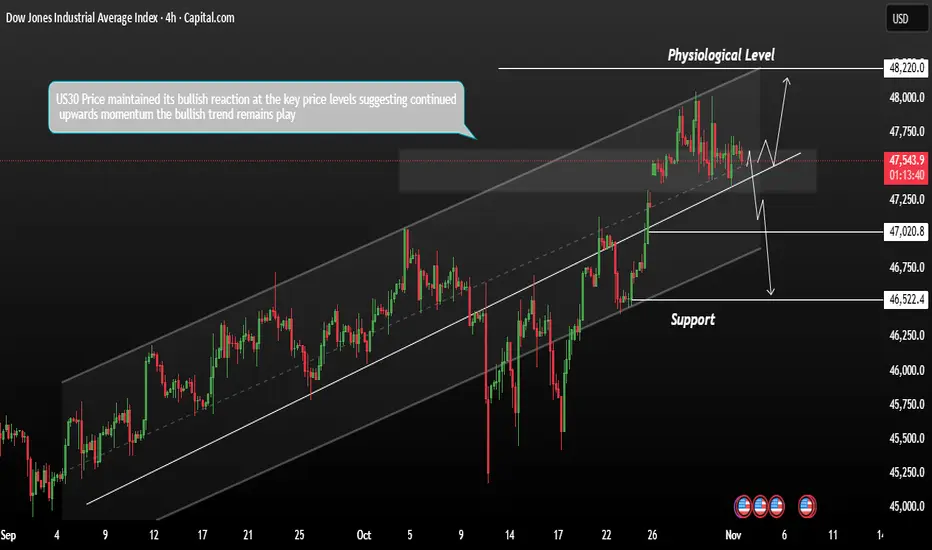
US30 Technical Outlook – Bullish Momentum IntactThe US30 maintained its bullish reaction at key price levels, suggesting continued upward momentum. As November begins, the index futures gained on Monday, supported by optimism around U.S.–China trade relations and stronger demand sentiment.
Currently, the bullish trend remains in play. If price continues to react positively to current support zones, we could see a potential move toward the next major psychological resistance level at 48,220.
However, if price fails to hold above current levels and we see a bearish reaction, a pullback could be triggered toward the support area between 47,030 and 46,520.
You may find more details in the chart.
Trade wisely best of Luck Buddies,
Ps; Support with like and comments for better analysis Thanks for Supporting.
us30Dow Jones on the 4H timeframe is moving in a downtrend in my view. Based on the data on the chart, it’s time for a correction. The price may rise to the highlighted area 1 hour timeframe before continuing the corrective targets shown on the chart, or it may complete the correction around the 50% Fibonacci retracement level. It’s unlikely to rise beyond that level."


US30 Trade Set Up Nov 3 2025For price to go bullish i want to see a test of the 15m FVG and respect it to then make internal 1m-5m IFVG/CISD to target BSL/London highs but if price inverts the 15m gap i will look for sells to PDL


$DJIDJI is showing signs of weakness we may be entering a correction phase.
With the government searching for capital to “keep America great,” it’s coming at a big cost.
We could see a sell-off of weaker assets to clear the path for the next bullish wave in 2026. 📉➡️📈

US30 H4 | Bullish Bounce Off OBUS30 is having a temporary correction towards the downside. However, there is a Fair Value Gap and Order Block present, which could cause price to bounce from that area.
Our buy entry is in between the FVG and OB, at 46,883, which also aligns with the 75% FIbonacci retracement level.
The stop loss is at 46,509, which is at the swing low support level, while the take profit is at 47,460, which is at the pullback resistance level.
Stratos Markets Limited (tradu.com/uk ):
CFDs are complex instruments and come with a high risk of losing money rapidly due to leverage. 68% of retail investor accounts lose money when trading CFDs with this provider. You should consider whether you understand how CFDs work and whether you can afford to take the high risk of losing your money.
Stratos Europe Ltd (tradu.com/eu ):
CFDs are complex instruments and come with a high risk of losing money rapidly due to leverage. 70% of retail investor accounts lose money when trading CFDs with this provider. You should consider whether you understand how CFDs work and whether you can afford to take the high risk of losing your money.

US30 Eyes 47,200 for Potential BounceHey Traders, in today’s trading session we’re monitoring US30 for a potential buying opportunity around the 47,200 zone.
The Dow Jones continues to trade in a broader uptrend, and price action is currently in a correction phase, approaching the 47,200 support and resistance confluence area — a key zone where buyers may look to step back in.
Watching for a bullish reaction at this level to confirm continuation of the prevailing trend.
Share your view below — do you think US30 holds this zone or breaks lower?
Trade safe,
Joe.

Bullish bounce off?DJ30 is falling towards the support level, which is a pullback support that aligns with the 38.2% Fibonacci retracement and could bounce from this level to our take-profit.
Entry: 47,0090.29
Why we like it:
There is a pullback support that aligns with the 38.2% Fibonacci retracement.
Stop loss: 46,642.72
Why we like it:
There is an overlap support that is slightly below the 50% Fibonacci retracement.
Take profit: 48,056.22
Why we like it:
There is a swing high resistance level.
Enjoying your TradingView experience? Review us!
Please be advised that the information presented on TradingView is provided to Vantage (‘Vantage Global Limited’, ‘we’) by a third-party provider (‘Everest Fortune Group’). Please be reminded that you are solely responsible for the trading decisions on your account. There is a very high degree of risk involved in trading. Any information and/or content is intended entirely for research, educational and informational purposes only and does not constitute investment or consultation advice or investment strategy. The information is not tailored to the investment needs of any specific person and therefore does not involve a consideration of any of the investment objectives, financial situation or needs of any viewer that may receive it. Kindly also note that past performance is not a reliable indicator of future results. Actual results may differ materially from those anticipated in forward-looking or past performance statements. We assume no liability as to the accuracy or completeness of any of the information and/or content provided herein and the Company cannot be held responsible for any omission, mistake nor for any loss or damage including without limitation to any loss of profit which may arise from reliance on any information supplied by Everest Fortune Group.
