US30 Long Trade, US30 to hit 47,317CAPITALCOM:US30 Long Trade
Entry: 46,321 - 46,700
TP: 47,317
This is good trade.
Don't overload your risk like Greedy gambler!!!
Be Disciplined Trader, risk what you can afford.
Use proper risk management.
Disclaimer: Trading is risky, only idea, not advice.
Trade ideas

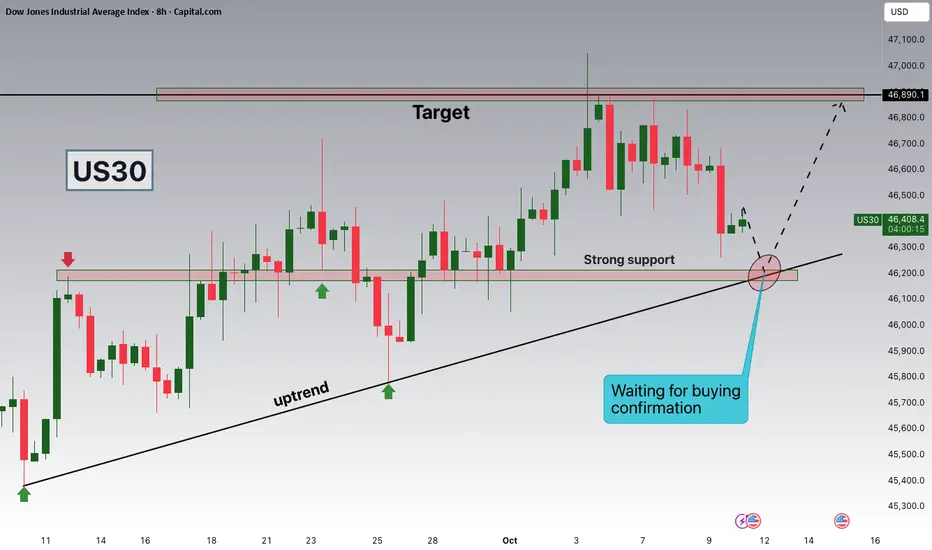
US30 Eyes 46,200 Support as Bulls Prepare for Next Leg Higher!Hey Traders,
In today’s session, we’re monitoring US30 for a potential buying opportunity around the 46,200 zone. The Dow Jones remains within a clear uptrend, and price is currently in a healthy correction phase, approaching a key confluence of support and trendline structure near 46,200.
A sustained reaction from this level could signal a continuation of bullish momentum in the broader equity market.
Trade safe,
Joe.
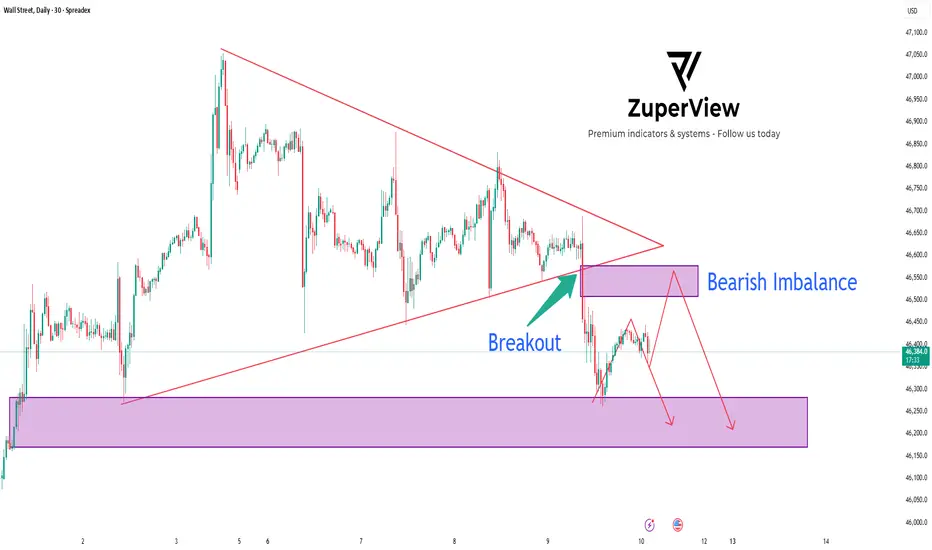
US30: Triangle breakout signal deeper sell move
📉 US30 Analysis: 4-Layer Resistance, Bearish Imbalance & Triangle Breakout | TradingView
The SPREADEX:DJI just printed a clean bearish breakout from a symmetrical triangle pattern on the 30-minute chart 🕒.
What makes this setup stand out is the 4-layer resistance zone perfectly overlapping with a Bearish Imbalance, creating a strong confluence for a potential continuation to the downside.
________________________________________
🧠 Technical Overview
On TradingView, the chart shows multiple lower highs forming inside a symmetrical triangle — a sign of buying exhaustion and seller accumulation. After several attempts, price finally broke below the structure, confirming a bearish market shift.
Key zones:
🔴 4-Layer Resistance: 46,850 → 46,550
⚫ Bearish Imbalance: 46,500 – 46,550
🟣 Demand Zone / Support: 46,150 – 46,250
Each resistance layer acted as a rejection point, showing how Smart Money continues to distribute orders and defend that area aggressively.
________________________________________
📊 Breakout – Retest – Continuation Setup
Following the breakout, price made a quick pullback to retest the 4-layer resistance zone — right where the Bearish Imbalance sits.
This is a textbook Breakout–Retest–Continuation pattern on TradingView, confirming that sellers are still in control.
1️⃣ Breakout: Price breaks below the triangle.
2️⃣ Retest: Price retraces to test the 4-layer resistance and imbalance.
3️⃣ Continuation: Strong rejection signals the next bearish leg.
________________________________________
💡 Trading Plan
Our trading plan for this setup is straightforward. I’m waiting for price to retest the 46,500–46,550 zone and show clear signs of rejection — such as a bearish engulfing candle or a break of structure on lower timeframes.
If confirmed, I’ll look to enter a short position targeting the Demand Zone around 46,150–46,250.
A stop loss would be placed just above 46,650, beyond the resistance cluster, to protect against false breakouts.
This plan aligns perfectly with Smart Money Concept (SMC) and Price Action trading, offering a strong risk-to-reward ratio 📈.
________________________________________
🧩 Market Psychology
✅ The four consecutive rejections at the same price zone clearly show how institutional traders are defending supply levels.
✅ Every time price pushes higher, Smart Money sells into liquidity, leaving wicks and imbalances behind.
✅ This behavior reinforces the bearish bias and supports the idea of a continued drop once short-term liquidity is collected.
________________________________________
🔎 Summary
✅ Bearish breakout confirmed from the triangle pattern
🔴 Strong 4-layer resistance overlapping with Bearish Imbalance
📉 Expecting price to continue toward the lower Demand Zone
This setup is clean, confluence-rich, and ideal for traders using TradingView, Price Action, and Smart Money Concepts.
A well-timed short from this zone could deliver a high-probability trade with excellent structure confirmation 🔥.
Please like and comment below to support our traders. Your reactions will motivate us to do more analysis in the future 🙏✨
Harry Andrew @ ZuperView
US30Seeing Bullish opportunity on US30.
The market has presented buy bias based on support & resistance strat.

DowJones trend change? Key resistance zone at 46262Key Support and Resistance Levels
Resistance Level 1: 46262
Resistance Level 2: 46476
Resistance Level 3: 46700
Support Level 1: 45433
Support Level 2: 45253
Support Level 3: 45025
This communication is for informational purposes only and should not be viewed as any form of recommendation as to a particular course of action or as investment advice. It is not intended as an offer or solicitation for the purchase or sale of any financial instrument or as an official confirmation of any transaction. Opinions, estimates and assumptions expressed herein are made as of the date of this communication and are subject to change without notice. This communication has been prepared based upon information, including market prices, data and other information, believed to be reliable; however, Trade Nation does not warrant its completeness or accuracy. All market prices and market data contained in or attached to this communication are indicative and subject to change without notice.

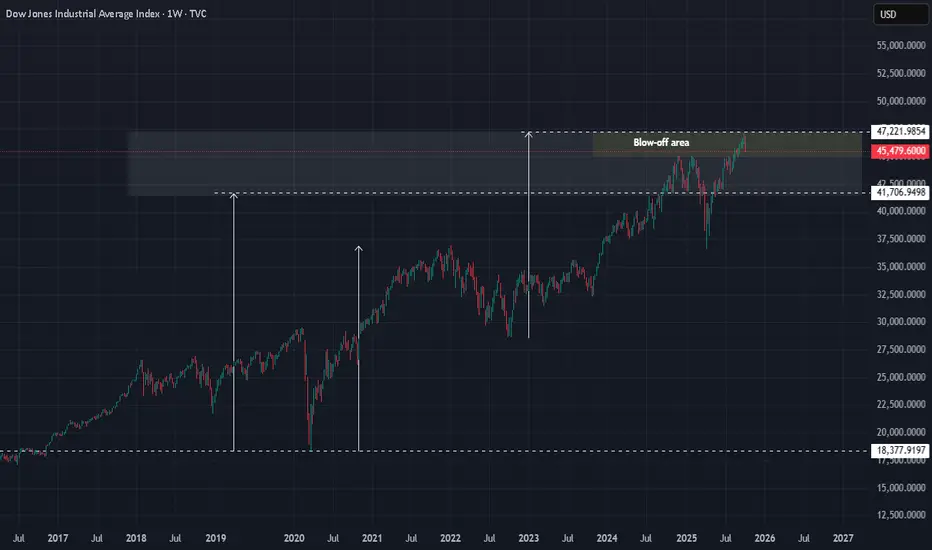
DJI : Remember what I wrote on 26/11/2024Long ago, I put up this chart.
Thanks to Trump, it is finally a reality.
Price has nowhere else to go but DOWN.
This is the kind of MONEY you can make by being patient.
Good luck.

SELLER'S WIN-MARKET TOOK A DEEP DIVE-US30Today was total domination by the Seller's. FVG's on higher timeframes were in totally in sync. 4hr,1hr,30min,15min,3min,1min.

US30 SENDS CLEAR BULLISH SIGNALS|LONG
US30 SIGNAL
Trade Direction: long
Entry Level: 45,553.8
Target Level: 46,661.5
Stop Loss: 44,818.8
RISK PROFILE
Risk level: medium
Suggested risk: 1%
Timeframe: 1D
Disclosure: I am part of Trade Nation's Influencer program and receive a monthly fee for using their TradingView charts in my analysis.
✅LIKE AND COMMENT MY IDEAS✅

US30 remains in a broader bearish trendThe US30 futures advanced on Monday, recovering from Friday’s pullback as investors shifted back into risk assets following reports of a softer stance from former President Trump on China. This improved sentiment led to short-term buying across U.S. equity futures.
Technical Analysis
Technically, the US30 remains in a broader bearish trend, with the recent bounce seen as a potential pullback toward resistance As long as price holds below key resistance levels, the bias remains bearish, and a reversal to the downside is likely.
Resistance zone: 46,000 – 46,300
Support levels: 45,200 → 44,500
A rejection from resistance could confirm continuation of the downtrend, targeting the support zones mentioned above. However, a break and close above 46,300 would invalidate the bearish structure and open the way for further upside momentum.
You may find more details in the chart.
Trade wisely best of Luck.
Ps; Support with like and comments for better analysis Thanks for Supporting.

$DJI – Buy the Dip Opportunity | Target: 51,000TVC:DJI – Buy the Dip Opportunity | Target: 51,000 🚀
The Dow Jones is offering a high-probability dip-buying setup within a strong macro bullish structure. Wave alignment and smart money positioning suggest continuation toward the 51,000 zone. Price is respecting key Fibonacci levels and institutional support zones. Momentum is building — this could be the launchpad.
📍 Watch for confirmation on lower timeframes.
📈 Trend remains intact — stay with structure.
#ElliottWave #SmartMoney #Fibonacci #DowJones #DJI #TradingView #TechnicalAnalysis #BuyTheDip

Us30US30 have had a drop last week due to tariff news, if we don't open with the gap then we will push up otherwise further drop can happen.
Disclosure: We are part of Trade Nation's Influencer program and receive a monthly fee for using their TradingView charts in our analysis.

US30 Short From Resistance!
HI,Traders !
#US30 went up sharply
But the price will soon hit
A wide horizontal resistance
Of 46641.8 from where we will
Be expecting a pullback and
A local move down !
Comment and subscribe to help us grow !

US30 Inverse Head and Shoulders on M15Bullish confirmations are strong here also. If you get a pullback in NYSE and a bullish confirmation then ride it to supply or new ATHs for that matter.

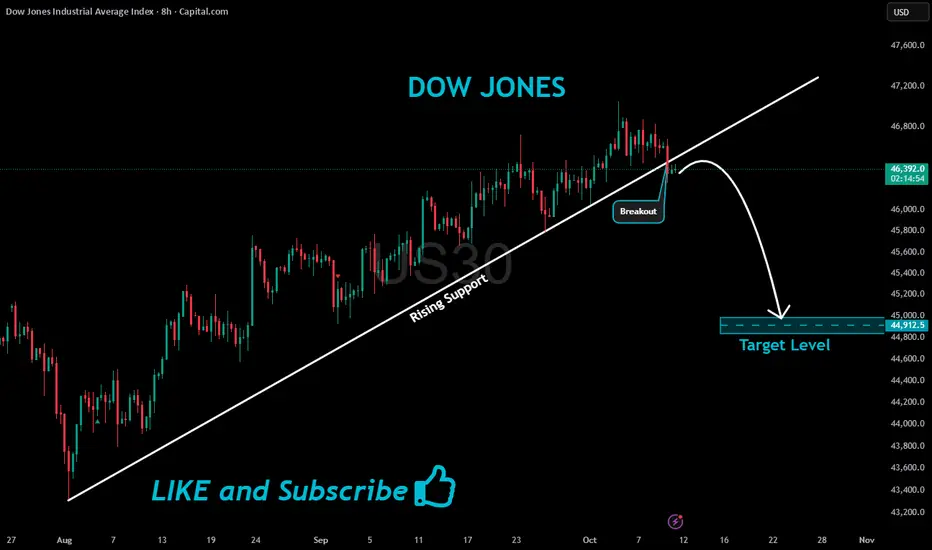
US30 Bearish Breakout!
HI,Traders !
#US30 made a bearish
Breakout of the rising support
Line and we are bearish biased
So we will be expecting a
Further bearish move down !
Comment and subscribe to help us grow !
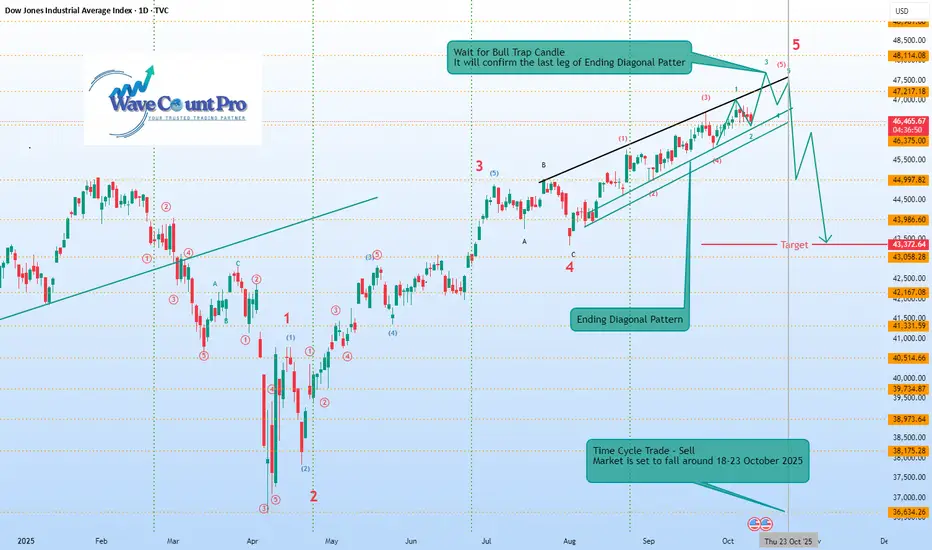
US30 all set to fall 5% starting 18-23rd OctHere’s a summary of the chart you provided:
Index: Dow Jones Industrial Average (DJIA), Daily timeframe (2025).
Pattern: Ending Diagonal Pattern forming in Wave 5.
Wave Count:
Major impulse structure labeled 1–5, with sub-waves marked inside the Ending Diagonal.
Current move is in the final 5th wave, nearing completion.
Key Message:
A Bull Trap Candle is expected — it will confirm the final leg of the Ending Diagonal.
After that, a sharp correction (sell-off) is anticipated.
Target Zone: Around 43,372–43,058.
Time Cycle Note:
A Time Cycle Trade (Sell) is suggested.
Market is projected to fall between October 18–23, 2025.
In short, the chart forecasts the completion of an Ending Diagonal near 47,200–47,500 levels, followed by a significant downside move toward the 43,000 zone starting late October 2025.
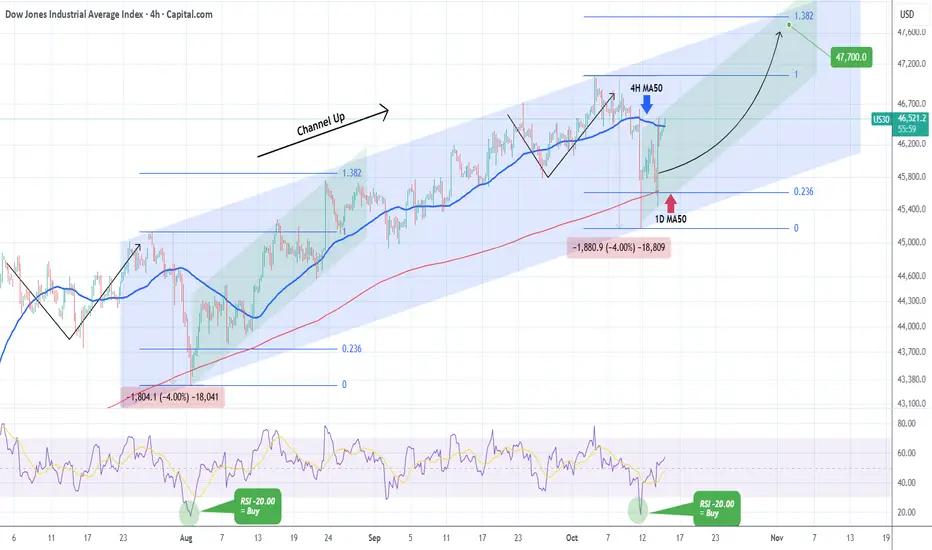
DOW JONES bounced at the bottom of the Channel Up. Buy signal.Dow Jones (DJI) has been trading within a 3-month Channel Up, with last Friday's flash crash breaching marginally below its 1D MA50 (red trend-line). That touched the bottom of the pattern and is technically a Higher Low, identical to the what the previous Bearish Leg did on the August 01 Low.
As you can see both Legs declined by -4.00% with their 4H RSIs touching the -20.00 level and rebounded. That is a technical Buy Signal, the strongest you can get within this Channel Up, and as long as the pattern's bottom holds, we expect another rise to the 1.382 Fibonacci extension (Our Target is 47700), similar to August's Bullish Leg.
-------------------------------------------------------------------------------
** Please LIKE 👍, FOLLOW ✅, SHARE 🙌 and COMMENT ✍ if you enjoy this idea! Also share your ideas and charts in the comments section below! This is best way to keep it relevant, support us, keep the content here free and allow the idea to reach as many people as possible. **
-------------------------------------------------------------------------------
💸💸💸💸💸💸
👇 👇 👇 👇 👇 👇
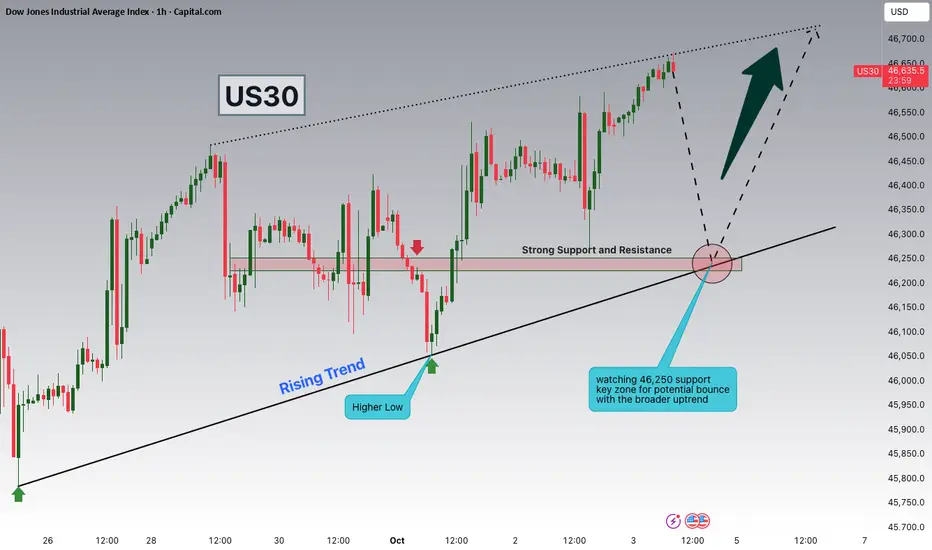
Dow Jones Watching 46,250 Support for Potential ContinuationHey Traders, in today’s trading session we are monitoring US30 for a potential buying opportunity around the 46,250 zone. The Dow Jones is trading in an uptrend and currently in a correction phase, with price moving toward this key support/resistance level.
Structure: The broader trend remains bullish, with pullbacks serving as corrections within the uptrend.
Key level in focus: 46,250 — an important support zone where price could stabilize and attract buyers.
Next move: Holding above 46,250 could open the door for continuation toward higher highs, while a breakdown would suggest a deeper retracement.
Trade safe,
Joe.
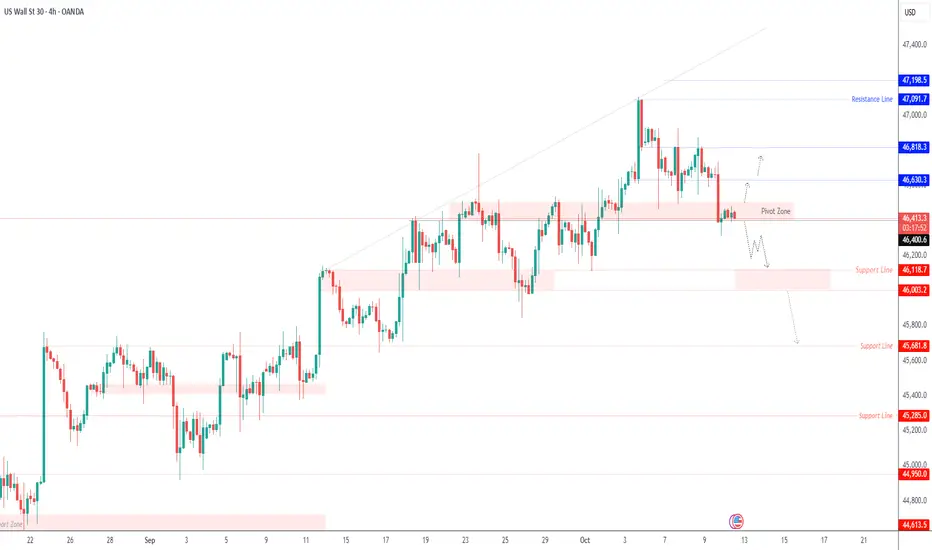
US30 – Key Pivot Test at 46,400 Before Directional BreakoutUS30 – Overview | Key Levels in Focus Before Next Move
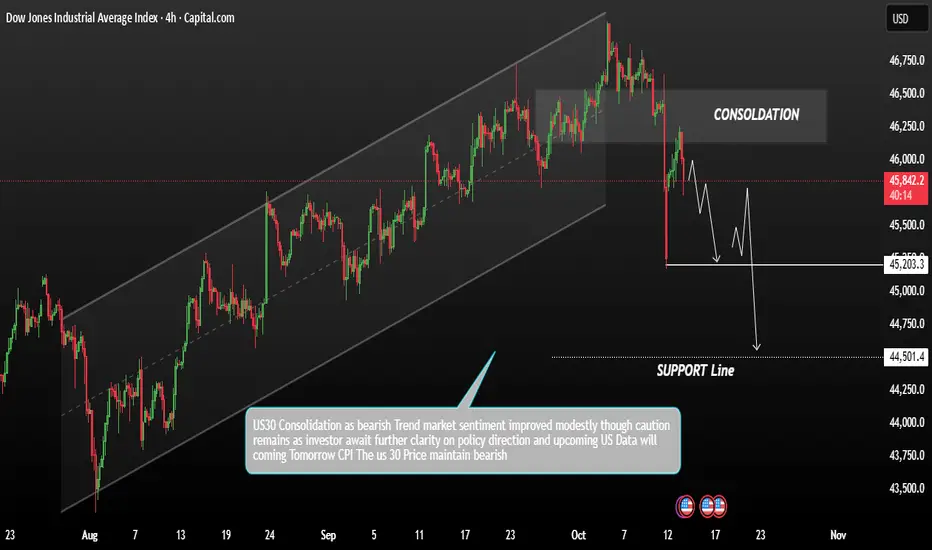
The Dow Jones remains in a consolidation phase, awaiting a clear breakout signal as traders weigh broader U.S. market uncertainty.
The price is holding around a key technical zone, with 46,400 acting as the short-term pivot between bullish and bearish momentum.
Technical Outlook
A 1H close below 46,400 would confirm a bearish continuation, targeting 46,120 → 46,000, and a sustained break below this zone could extend toward 45,680.
On the other hand, if the price closes above 46,510, it would reinforce bullish momentum toward 46,630 → 46,810, with potential to test 47,090 if buying pressure strengthens.
Pivot Line: 46,400
Resistance: 46,630 · 46,810 · 47,090
Support: 46,120 · 46,000 · 45,680
US30 - Futures Rebound as Trump Calms U.S.–China Trade TensionsUS30 – Overview | Futures Rise as Trump Softens Tone on China
U.S. stock index futures advanced Monday, recovering from Friday’s pullback, as investors shifted back to risk assets following President Donald Trump’s softer stance on China.
Trump signaled a more measured approach, easing concerns over trade escalation after previously announcing steep tariffs and export restrictions tied to rare earth controls.
Market sentiment improved modestly, though caution remains as investors await further clarity on policy direction and upcoming U.S. data.
Technical Outlook
The Dow Jones maintains a bearish bias while trading below the pivot zone at 46,000.
As long as the price holds under this level, momentum favors downside toward 45,680 → 45,470, with increased pressure if a 1H candle closes below 45,680.
A 1H close above 46,120 would shift sentiment to bullish, targeting 46,400 → 46,630, potentially confirming a short-term reversal.
Pivot Line: 45,920
Resistance: 46,120 · 46,400 · 46,630
Support: 45,680 · 45,500 · 45,285
Summary:
US30 remains bearish below 46,000, with a possible retest of key supports at 45,680–45,470.
A break above 46,120 would invalidate the bearish view and open the way for a recovery toward 46,400.
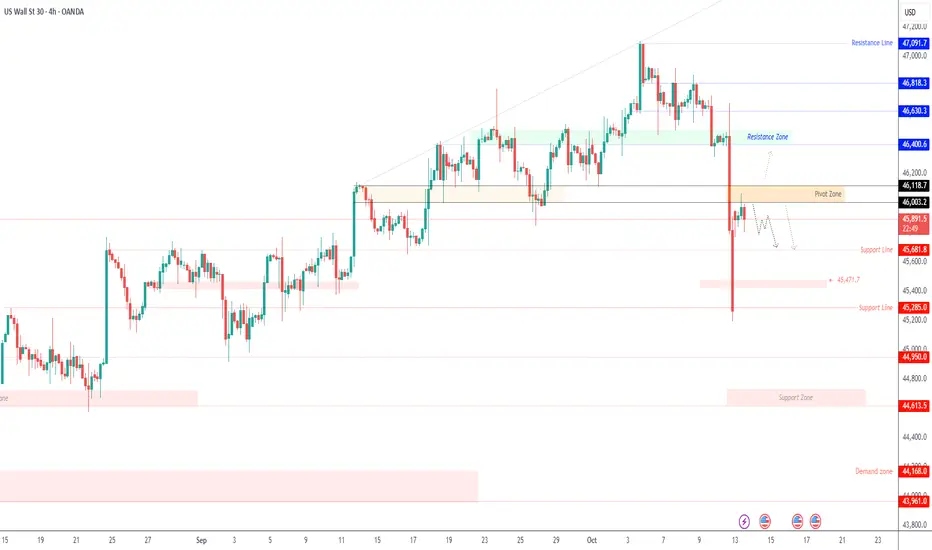
US30 / Overview | Bearish Pressure Below 46,000US30 – Overview | Bearish Momentum
The price retested its resistance zone and then reversed into bearish momentum.
As long as the index trades below 46,000, the bearish trend is expected to continue toward 45,690, and a 1H close below this level would extend losses toward 45,470.
To shift into a bullish trend, price must close a 1H candle above 46,000, which would open the way toward 46,120 → 46,250.
Pivot: 46,000
Support: 45,680 – 45,470 – 45,280
Resistance: 46,120 – 46,250 – 46,400

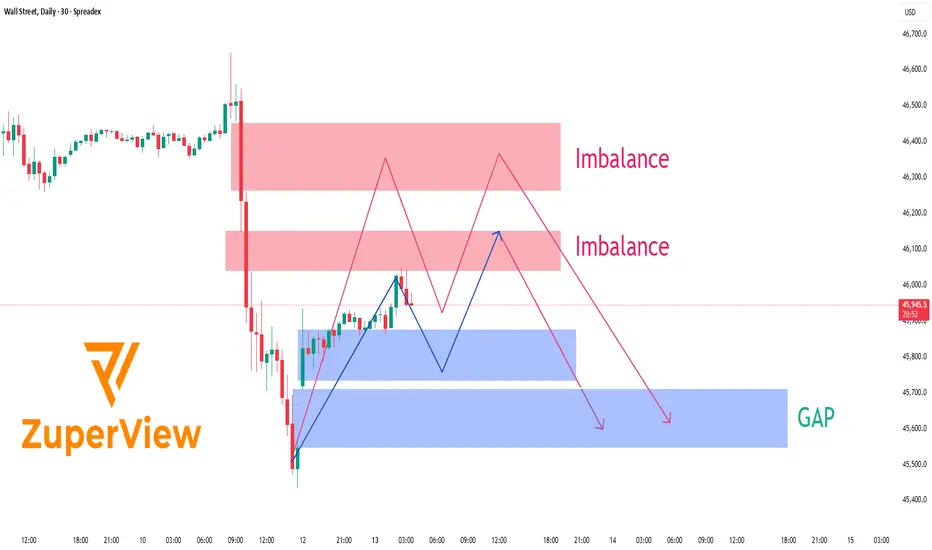
US30: Rebound before the stormTechnical Outlook – Wall Street Index (30-Minute Chart)
After the announcement that the U.S. will impose a 100 % tariff on Chinese imports, Wall Street ⚡ plunged sharply, leaving behind distinct Imbalance zones and an unfilled GAP lurking below current price levels.
At present, price is hovering around 45,950 💵, showing a modest rebound after tapping into a short-term demand zone. Above, two notable Imbalance areas stand out — around 46,000-46,150 and 46,250-46,450 - both formed as aggressive sell orders flooded the market following the latest wave of trade-war headlines 🌍.
The likely scenario 🎯:
Price could continue to retrace upward ↗️ to test one of these supply/imbalance zones before sellers re-enter the market. If selling pressure remains dominant, the index may resume its decline toward the GAP area around 45,500 - 45,650 📉, where liquidity is still unfilled and buyers may look to step back in.
Current price action indicates a corrective pullback rather than a full reversal. Trading volume is thinning 📉, candlestick patterns show signs of exhaustion 🕯️, and the upper imbalance zones remain untouched — all signaling that sellers still hold the upper hand.
________________________________________
🌍 Fundamental Context – U.S. vs. China Tensions Heating Up
On October 10, President Trump officially declared a 100 % additional tariff on Chinese goods, effective November 1, 2025 — the most aggressive move since the 2018-2019 trade war.
Beijing immediately condemned the plan, warning of “corresponding countermeasures”, including restrictions on rare-earth exports and higher port fees on U.S. vessels. While strong in tone, China has so far stopped short of announcing a direct tariff retaliation, signaling a cautious approach while keeping the door open for talks.
Washington, meanwhile, insists the measure aims to “protect American interests and reduce over-reliance on China’s supply chains,” but officials also noted that negotiations remain possible if China shows “substantive goodwill.”
Financial markets reacted swiftly 💥:
• U.S. and Asian equities dropped 2–3 % on average.
• USD strengthened, while gold and JPY rallied as safe-haven flows increased.
• Tech and industrial stocks with strong China exposure saw the largest losses.
Overall, risk sentiment remains fragile as investors brace for a prolonged phase of trade uncertainty.
________________________________________
💡 Trading Summary
Short-term structure favors a sell-the-rally approach. The market may retest upper imbalance zones before resuming its downtrend toward the 45,500 USD GAP area.
If U.S.–China tensions intensify further, downside momentum could accelerate. Conversely, any sign of renewed dialogue or tariff delay could trigger a short-term rebound — but bias remains bearish until the market reclaims 46,300 USD convincingly.
In short: patience, risk control, and reaction to headlines are key this week. ⚖️
Please like and comment below to support our traders. Your reactions motivate us to do more analysis in the future 🙏✨
Harry Andrew @ ZuperView