Bullish continuation?Dow Jones (US30) is reacting off the pivot which acts as an overlap support and could bounce to the 1st resistance which has been identified as a swing high resistance.
Pivot: 46,123.56
1st Support: 45,765.51
1st Resistance: 46,704.98
Disclaimer:
The above opinions given constitute general market commentary, and do not constitute the opinion or advice of IC Markets or any form of personal or investment advice.
Any opinions, news, research, analyses, prices, other information, or links to third-party sites contained on this website are provided on an "as-is" basis, are intended only to be informative, is not an advice nor a recommendation, nor research, or a record of our trading prices, or an offer of, or solicitation for a transaction in any financial instrument and thus should not be treated as such. The information provided does not involve any specific investment objectives, financial situation and needs of any specific person who may receive it. Please be aware, that past performance is not a reliable indicator of future performance and/or results. Past Performance or Forward-looking scenarios based upon the reasonable beliefs of the third-party provider are not a guarantee of future performance. Actual results may differ materially from those anticipated in forward-looking or past performance statements. IC Markets makes no representation or warranty and assumes no liability as to the accuracy or completeness of the information provided, nor any loss arising from any investment based on a recommendation, forecast or any information supplied by any third-party.
US30 trade ideas

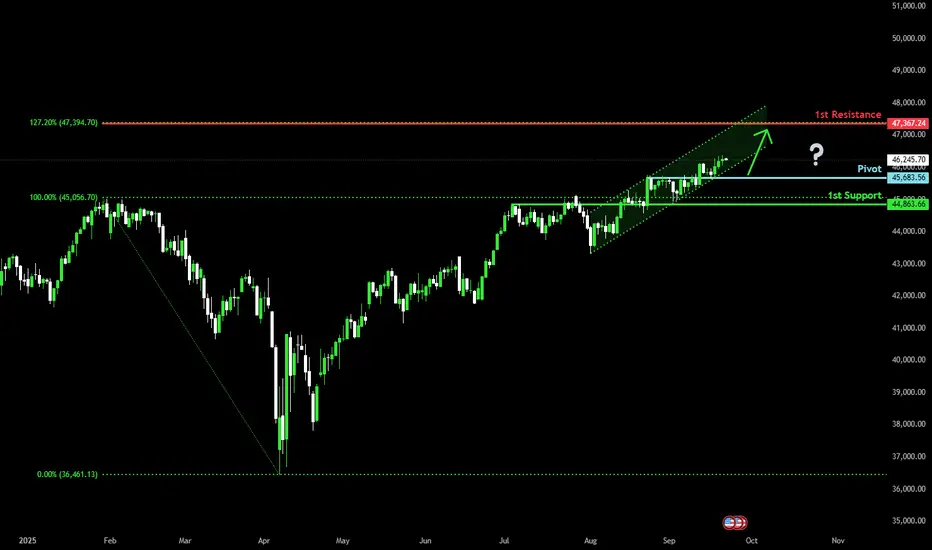
Bullish momentum to extend?Dow Jones (US30) is falling towards the pivot and oculd bounce to the 1st resistance.
Pivot: 45,683.56
1st Support: 44,863.66
1st Resistance: 47,367.24
Disclaimer:
The above opinions given constitute general market commentary, and do not constitute the opinion or advice of IC Markets or any form of personal or investment advice.
Any opinions, news, research, analyses, prices, other information, or links to third-party sites contained on this website are provided on an "as-is" basis, are intended only to be informative, is not an advice nor a recommendation, nor research, or a record of our trading prices, or an offer of, or solicitation for a transaction in any financial instrument and thus should not be treated as such. The information provided does not involve any specific investment objectives, financial situation and needs of any specific person who may receive it. Please be aware, that past performance is not a reliable indicator of future performance and/or results. Past Performance or Forward-looking scenarios based upon the reasonable beliefs of the third-party provider are not a guarantee of future performance. Actual results may differ materially from those anticipated in forward-looking or past performance statements. IC Markets makes no representation or warranty and assumes no liability as to the accuracy or completeness of the information provided, nor any loss arising from any investment based on a recommendation, forecast or any information supplied by any third-party.
US30 hits new all-time high amid robust AI fever
US equities rallied to fresh record highs, fueled by the Fed’s rate cut, resilient US economic data, and optimism over progress in US-China trade negotiations. Ongoing enthusiasm for AI also boosted technology stocks.
Nvidia (NVDA) drove the strongest market reaction after announcing a \$5 bln purchase of more than 4% of Intel (INTC). Sentiment was further buoyed by reports that Chinese regulators halted their antitrust probe into Google (GOOGL), ending a long-running investigation into Android’s dominance.
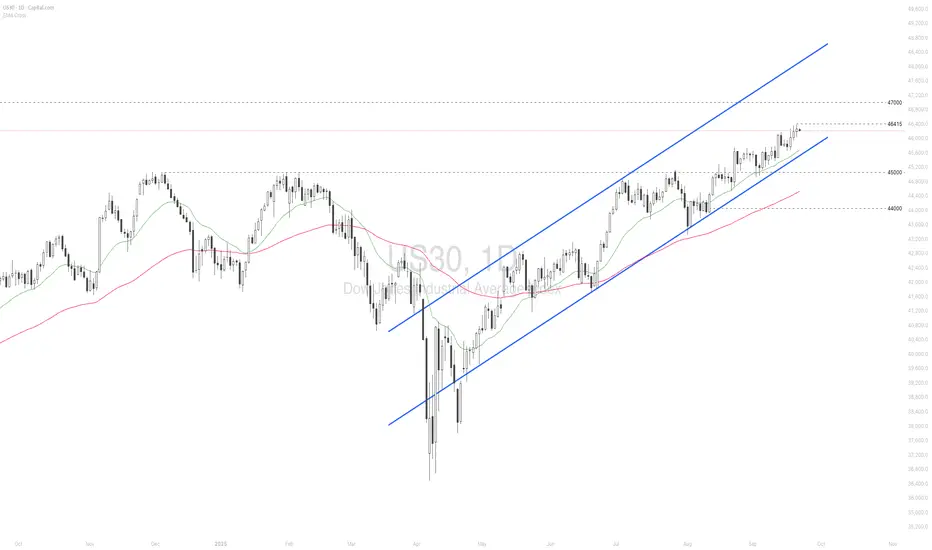
US30 maintained a solid uptrend within the ascending channel, setting a new high. The index holds above both EMAs, indicating the potential continuation of the bullish momentum. If US30 breaches above the 46415 high, the index may gain upward momentum toward the psychological resistance at 47000. Conversely, if US30 breaks below EMA21 and the channel’s lower bound, the index could retreat toward 45000.
Can You Escape the US30 High Voltage Trap in Time?💎 US30/DJ30 High Voltage Bullish Heist Plan 💎
💰 Asset: US30 / DJ30 Index CFD
🚀 Plan: Bullish — Thief OG Layered Buy Attack 🏴☠️
📍 Entry: Any price level — we’re layering in with the Bull Grid Strategy like a true market bandit.
🎯 Layered Buy Limits:
44,900 💵
44,700 💵
44,400 🔥
(💡 You can add more layers — the more vault doors you crack, the more loot you grab!)
🛑 Stop Loss: Thief SL @ 44,000 🛑 — adjust to your own risk appetite & strategy, ladies & gentlemen of the Thief OG Crew.
💎 Target: 46,300 🎯 — ⚡ high-voltage electric trap ahead! Escape with the stolen money at 46,200 before the market guards catch you.
🏴☠️ The Heist Blueprint 🏴☠️
We’re hitting US30 with multi-layer entries, scooping up the dip zones like professional vault breakers. The bull gang is in control — momentum, sentiment, and greed all lining up for a payday.
Rules of Engagement:
Use multiple buy limit layers — stack ‘em like gold bars.
Stick to longs only — don’t rob against the tide.
Place alerts at each limit level — no sleeping during the heist.
Use trailing SL to secure stolen profits while the robbery’s still in progress.
📊 Why Bullish?
US30 showing strong momentum fueled by market optimism, earnings strength, and liquidity flooding in. Macro vibes = bullish; sentiment = greedy. Bears? Scattered and broke.
⚠️ Risk & News Alert:
Avoid entry during high-volatility news drops — even thieves hate unpredictable explosions.
Manage positions like a pro — protect the stash.
💖 If this heist plan makes you richer or braver, hit that BOOST and join the Thief Trader Army. Every boost powers our next robbery.
🏆 We steal from the market, not from people.
See you at the vault door, Thief OGs. 🏴☠️💰🚀

US30 - Bullish Path Toward 48,000The market remains strongly bullish with no clear signs of correction, even in lower timeframes.
Active targets are 46,550, 47,300 (key level), and 47,690, with the next major target at 48,000.
Beyond this, 48,920 has also been identified as a potential extension.
While higher targets exist, they belong to a larger fractal and are not yet confirmed.
The deepest possible correction could reach the 45,300 area, which may provide a good long opportunity.
Short positions are not recommended due to high risk and strong buying pressure.

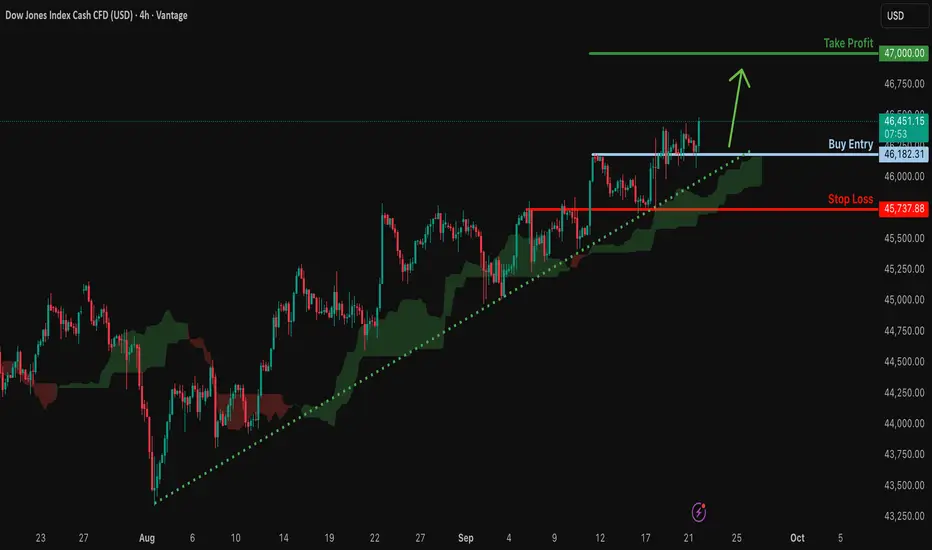
Bulllish continuation?Dow Jones (DJ30) has bounced off the support level which acts as a pullback support and could potentially rise from this level to our take profit.
Entry: 46,182.31
Why we like it:
There is a pullback support.
Stop loss: 45,737.88
Why we like it:
There is an overlap support level.
Take profit: 47,000
Why we like it:
There is a swing high resistance level.
Enjoying your TradingView experience? Review us!
Please be advised that the information presented on TradingView is provided to Vantage (‘Vantage Global Limited’, ‘we’) by a third-party provider (‘Everest Fortune Group’). Please be reminded that you are solely responsible for the trading decisions on your account. There is a very high degree of risk involved in trading. Any information and/or content is intended entirely for research, educational and informational purposes only and does not constitute investment or consultation advice or investment strategy. The information is not tailored to the investment needs of any specific person and therefore does not involve a consideration of any of the investment objectives, financial situation or needs of any viewer that may receive it. Kindly also note that past performance is not a reliable indicator of future results. Actual results may differ materially from those anticipated in forward-looking or past performance statements. We assume no liability as to the accuracy or completeness of any of the information and/or content provided herein and the Company cannot be held responsible for any omission, mistake nor for any loss or damage including without limitation to any loss of profit which may arise from reliance on any information supplied by Everest Fortune Group.
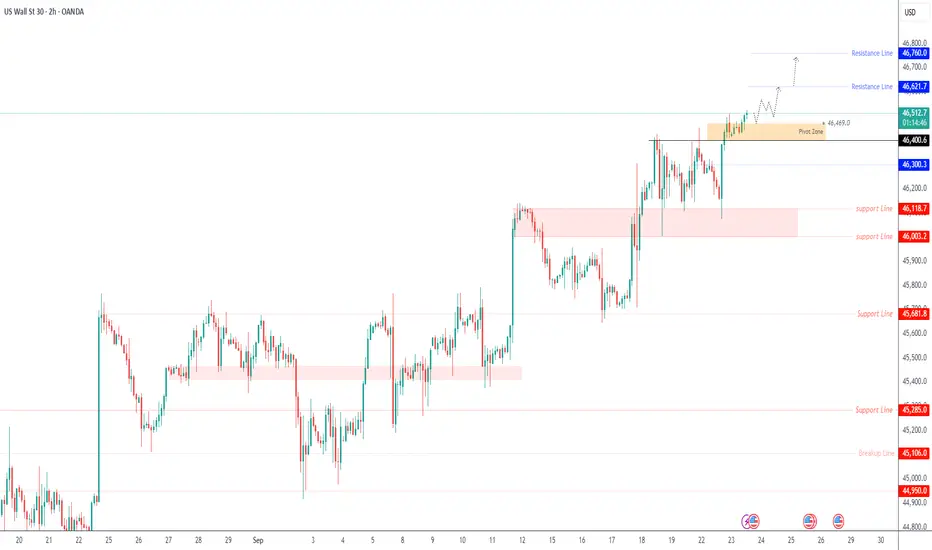
US30 – Fresh Record High with Bulls Targeting Higher LevelsUS30 – Overview
The Dow Jones Industrial Average recorded a new all-time high (ATH) at 46,520, extending its rally as markets continue to digest supportive macro drivers.
Optimism around Federal Reserve rate-cut expectations, along with strong corporate earnings and upbeat U.S. economic data, keeps investor sentiment constructive.
Focus now turns to upcoming Fed commentary and economic releases, which could provide the next catalyst for fresh highs or a short-term pullback.
Bullish Scenario
Price remains in a strong bullish trend as long as it trades above the 46,470 pivot zone.
Targets: 46,620 → 46,760.
A confirmed 1H close above 46,620 would signal continuation toward higher extensions if momentum strengthens further.
Bearish Scenario
To shift momentum lower, price would need to close at least a 1H candle below 46,400.
Targets: 46,300 → 46,120 on sustained selling pressure.
Further weakness could follow if Fed officials adopt a more hawkish tone or if key data surprises to the upside, reducing rate-cut bets.
Pivot: 46,470
Resistance: 46,620 – 46,760
Support: 46,400 – 46,300 – 46,120
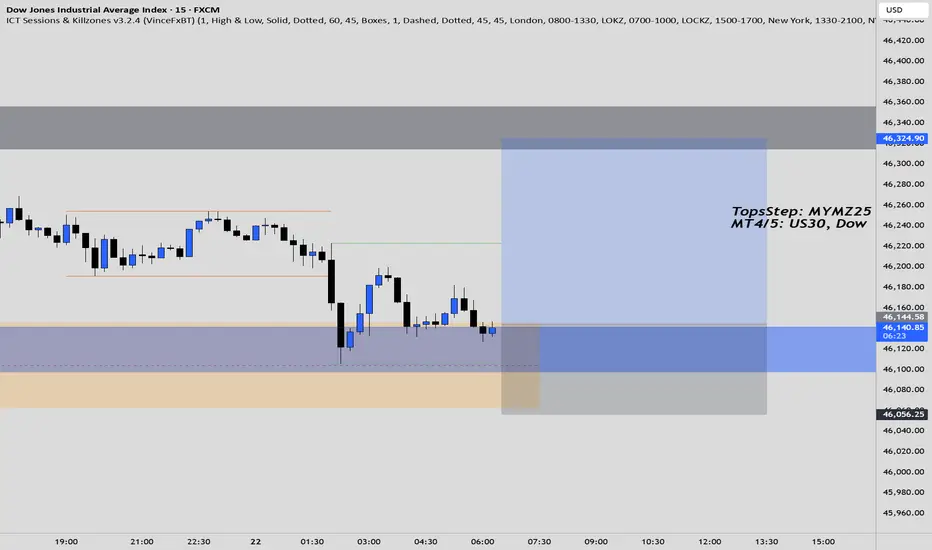
US30 - 2 Day Traders Edge📈Technical:
MARKET BIAS: Neutral-Bullish above PIVOT (holding above HVN level, testing resistance)
PIVOT ZONE: 46,205 (Current HVN magnet)
🥇 Traders Edge - Actionable & Tactical
TRADE SETUPS:
🟧 Risk Warning: Core PCE surprise = 200+ point moves
↕️ Bias Flip: Break below 46,100 (bearish) | above 46,450 (bullish)
🟢BULLISH Potential if PIVOT holds -
• Bounce from Pivot area 46300 | 46450
• Stop Loss: 46,050
🔴BEARISH Potential -
• Look for SHORT Entries: Rejections at 46300 and/or below PIVOT @ 46205
• Take Profit: 45900 | 45500 Extended Breakdown
• Stop Loss: Above 46300
🎯KEY LEVELS:
• Strong Resistance: 46,300 | 46,450 | 46,650
• Strong Support: 46,100 | 45,900 | 45,700 | 45,500
🎯PRICE TARGETS:
• Bullish Path: 46,300 → 46,450 → 46,650 (Extended breakout)
• Bearish Path: 46,100 → 45,900 → 45,500 (Extended breakdown)
🚨HIGH-IMPACT EVENTS (48H): (NY Time Zone)
• Sep 25 | 08:30 Core Durable Goods: -0.1% vs 1.1% → Manufacturing health
• Sep 25 | 08:30 GDP Q2 Final: 3.3% vs -0.5% → Growth = equity bullish
• Sep 26 | 08:30 Core PCE MoM: 0.2% vs 0.3% → RATE REPRICING RISK
• Sep 26 | 08:30 Personal Income: 0.3% vs 0.4% → Corporate earnings proxy
🛑 MASTER RISK EVENT
🟧Friday September 26 | 08:30 (NY Time Zone)
🟧 Core PCE Price Index (MoM) - Forecast: 0.2% vs Previous: 0.3%
🟧 Critical Impact: Fed's preferred inflation gauge determines rate path and USD strength
• Gold: Collapse risk if hot print
• Equities: Rate repricing volatility
• Sectors: Tech rotation sensitivity
⚠️ RISK MANAGEMENT PROTOCOL
• Reduce position sizes before Friday 08:30 EDT
• USD strength reversals impact Gold heavily
• Tech high beta to rate repricing
• Month-end flows amplify volatility
________________________________________
Analysis based on Session Volume POC clusters and HVN methodology
US30 LongElite Analysis
Discretionary Trade with Confirmations
Targeting Structural liquidity at the top
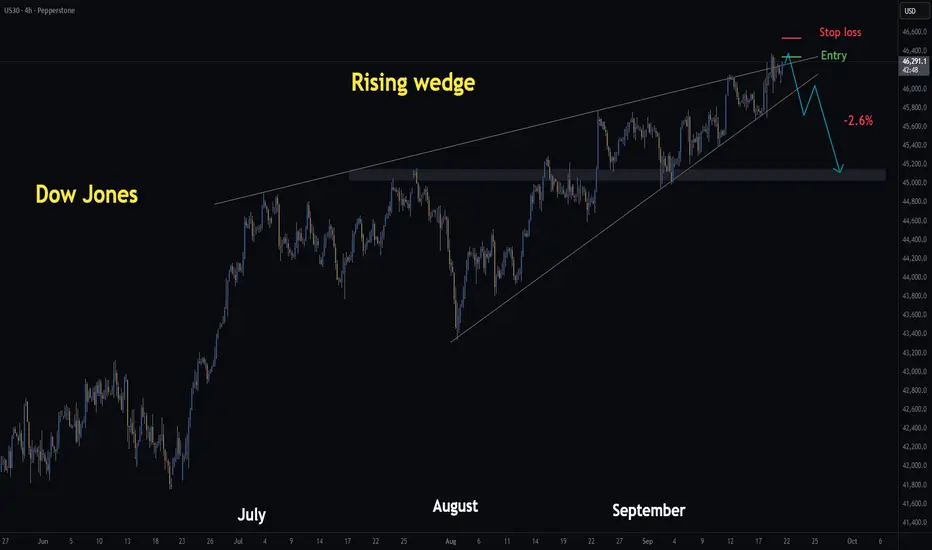
DowJones | H4 Rising Wedge | GTradingMethodHello Traders,
Yesterday I shared a short setup on the Dow Jones using the rising wedge pattern. I entered at 46,267 and exited with a small profit at 46,179. I exited because I did not like the reaction at that level and anticipating a better entry.
Today, I’m looking to re-enter if price reaches 46,343, which could form a potential double top on the chart.
🧐 Market Overview:
Rising wedges generally act as bearish reversal patterns, that said, the broader market remains bullish following the FOMC, so I’ll be risking less and proceeding with caution.
However, the VIX has been sitting near multi-month lows, which often precedes sharp moves. If volatility picks up post-FOMC, rising wedge patterns could act as early warning signs of a pullback.
So I am willing to risk a small amount and potentially be rewarded BIG!
📊 Trade Plan:
Risk/Reward: 6.7
Entry: 46,343
Stop Loss: 46,539
Take Profit 1 (50%): 45,000
Take Profit 2 (50%): 45,000
Also, if this plays out, I expect NAS and S&P to fall too which will likely drag crypto with it.
Thanks for checking out my post!
I would love to hear if you have any rising wedge trading tips? And if you are trading the Dow Jones or S&P today?
Please note: This is not financial advice. This content is to track my trading journey and for educational purposes only.
END OF AN ERA?"Grab this chart" and use weekly time frame. Give a comment what you think? Are we at an end of a raging bull run and the big reset is upon us?

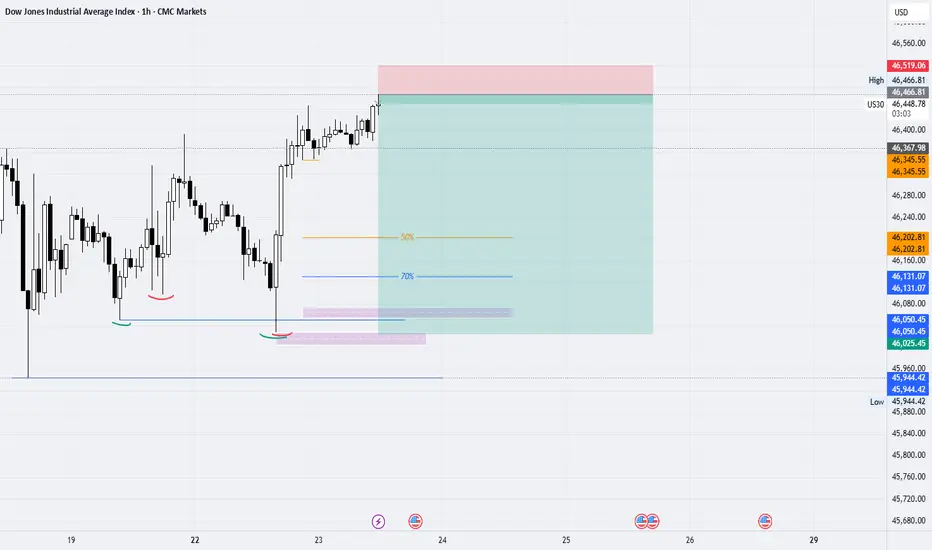
US30 H4 | Bearish drop offBased on the H4 chart analysis, we could see the price rise to the sell entry at 46,338.64, which is a pullback resistance that aligns with the 50% Fibonacci retracement and could drop from this level to the take profit.
Stop loss is at 46,676.09, which is a swing high resistance.
Take profit is at 45,762.38, which has been identified as an overlap support that lines up with the 50% Fibonacci retracement.
High Risk Investment Warning
Trading Forex/CFDs on margin carries a high level of risk and may not be suitable for all investors. Leverage can work against you.
Stratos Markets Limited (tradu.com ):
CFDs are complex instruments and come with a high risk of losing money rapidly due to leverage. 65% of retail investor accounts lose money when trading CFDs with this provider. You should consider whether you understand how CFDs work and whether you can afford to take the high risk of losing your money.
Stratos Europe Ltd (tradu.com ):
CFDs are complex instruments and come with a high risk of losing money rapidly due to leverage. 66% of retail investor accounts lose money when trading CFDs with this provider. You should consider whether you understand how CFDs work and whether you can afford to take the high risk of losing your money.
Stratos Global LLC (tradu.com ):
Losses can exceed deposits.
Please be advised that the information presented on TradingView is provided to Tradu (‘Company’, ‘we’) by a third-party provider (‘TFA Global Pte Ltd’). Please be reminded that you are solely responsible for the trading decisions on your account. There is a very high degree of risk involved in trading. Any information and/or content is intended entirely for research, educational and informational purposes only and does not constitute investment or consultation advice or investment strategy. The information is not tailored to the investment needs of any specific person and therefore does not involve a consideration of any of the investment objectives, financial situation or needs of any viewer that may receive it. Kindly also note that past performance is not a reliable indicator of future results. Actual results may differ materially from those anticipated in forward-looking or past performance statements. We assume no liability as to the accuracy or completeness of any of the information and/or content provided herein and the Company cannot be held responsible for any omission, mistake nor for any loss or damage including without limitation to any loss of profit which may arise from reliance on any information supplied by TFA Global Pte Ltd.
The speaker(s) is neither an employee, agent nor representative of Tradu and is therefore acting independently. The opinions given are their own, constitute general market commentary, and do not constitute the opinion or advice of Tradu or any form of personal or investment advice. Tradu neither endorses nor guarantees offerings of third-party speakers, nor is Tradu responsible for the content, veracity or opinions of third-party speakers, presenters or participants.

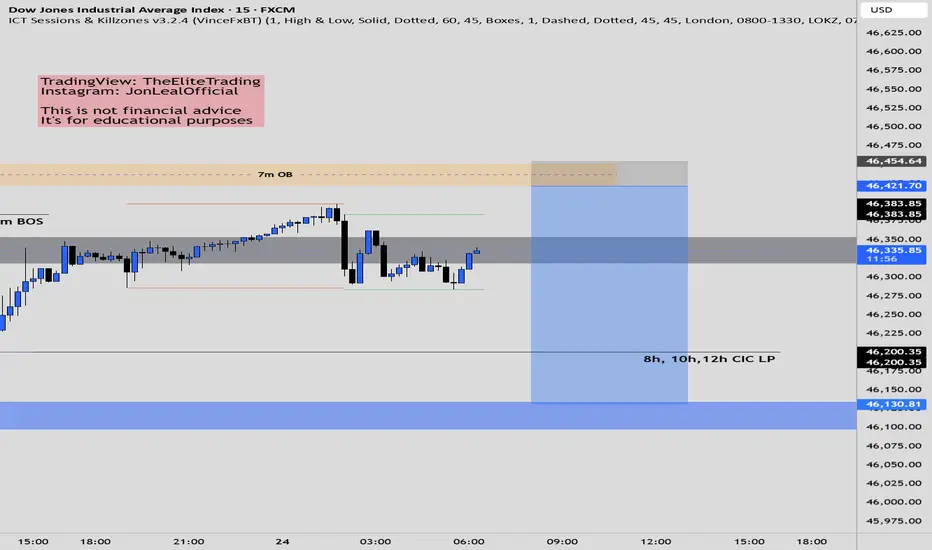
US30 ShortElite Analysis
Confirmations met, to make this A+ we need a 30m BOS
Targeting lower liquidity pools

Us30 Trade Set Up Sep 25 2025Price is now in a bearish trend making LH/LL and has broken PDL but is approaching a SSL so if price sweeps it, closes above and making internal structure creating 1m IFVG/CISD i will look for buys to the 1h FVG, and is it trades through the 1h FVG the end target will be 50% of the 4h FVG. But if prices respects the 1h FVG, I will look for bearish structure from there to continue lower
www.tradingview.com

US30 - Trading Edge TodayDear Friends in Trading,
🎯Trading Edge:
Following USTEC leadership but needs independent breakout above 46,450 for confirmation
Key Level: 46,450 (breakout confirmation)
Pivot: 46,200 – 46,350
Bias: Bullish above pivot
Bull target: 46,500 → 46,700
Bear target: 46,100 → 45,900
Correlation: +88% with USTEC (2–3-Hour lag), +48% with Gold
Risk Assets Alignment:
GOLD🔄USTEC🔄US30
✅Gold + USTEC + US30 all bullish above pivots = Fed dovish trade confirmed
✅Unusual Gold/equity positive correlation suggests monetary policy driving both higher
Assets Overbought:
🔴USTEC - 4HR Overbought Divergence Detected
I sincerely hope my point of view offers a valued insight.
Thank you for taking the time study my analysis.

Wall Street 30 Cash - Trading The Wedges Highest PointUS30 (Wall Street 30 Cash on the chart) is trading a Falling Wedge at it is highest point and could be due for a drop however the Falling Wedges at it's failure could trigger a new Bullish Trend for another $1K Rally while the 36500 Point still remains as strong resistance.
Bullish structure remains strong and though rejection from 46500 - 46800 could shot back to the level 46000.
Please add your ideas in the comment.
Thanks

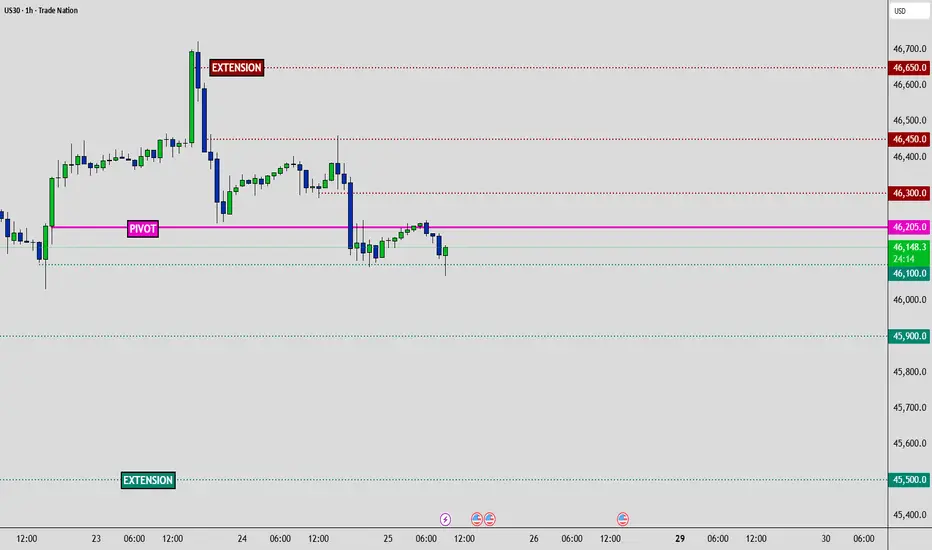
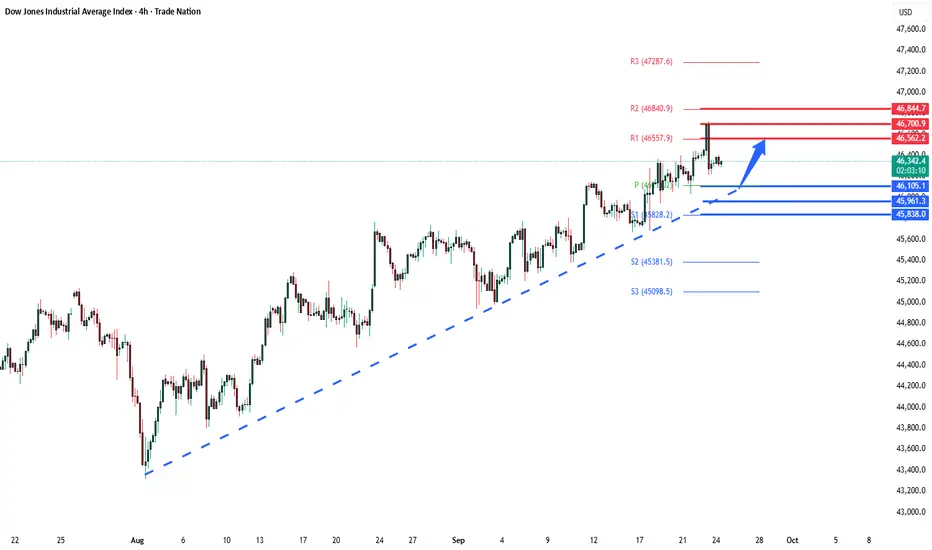
Dow overbought corrective pullback supported at 46100Key Support and Resistance Levels
Resistance Level 1: 46560
Resistance Level 2: 46700
Resistance Level 3: 46845
Support Level 1: 46100
Support Level 2: 45960
Support Level 3: 45840
This communication is for informational purposes only and should not be viewed as any form of recommendation as to a particular course of action or as investment advice. It is not intended as an offer or solicitation for the purchase or sale of any financial instrument or as an official confirmation of any transaction. Opinions, estimates and assumptions expressed herein are made as of the date of this communication and are subject to change without notice. This communication has been prepared based upon information, including market prices, data and other information, believed to be reliable; however, Trade Nation does not warrant its completeness or accuracy. All market prices and market data contained in or attached to this communication are indicative and subject to change without notice.
US30 ShortElite Strategy
Waiting price to come tap OB twice to confirm OB to TOB
Execute in smaller time frame
Targeting lower liquidity pools
Main target Structural liquidity
US30 - Short Setup – Rising Channel (4H)I'm currently eyeing a short opportunity on US30 (Dow Jones Industrial Average) based on the 4H timeframe.

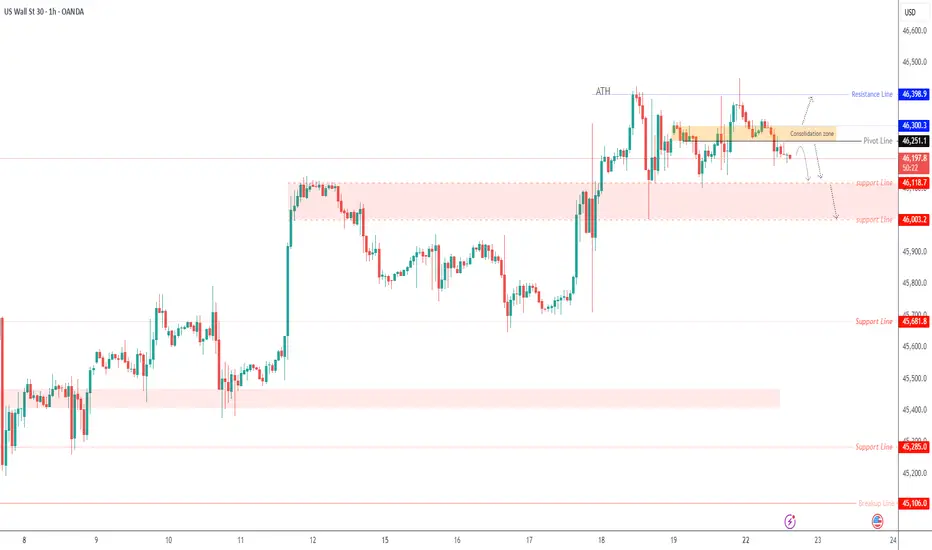
US30 – Key Pivot Zone Signals Next MoveUS30 – Overview
The Dow Jones remains under bearish momentum while trading below the 46,250 – 46,300 pivot zone, keeping pressure toward key supports.
📉 Bearish Scenario
Price targets a move toward 46,120 as long as it stays below 46,250 – 46,300.
🔻 A confirmed 1H close below 46,120 would strengthen the bearish trend, opening the path to 46,000.
📈 Bullish Scenario
If price pushes higher and achieves a 1H close above 46,300, bullish momentum would return, with upside targets at 46,400 and beyond.
Key Levels
Pivot: 46,250
Resistance: 46,300 – 46,400
Support: 46,120 – 46,000
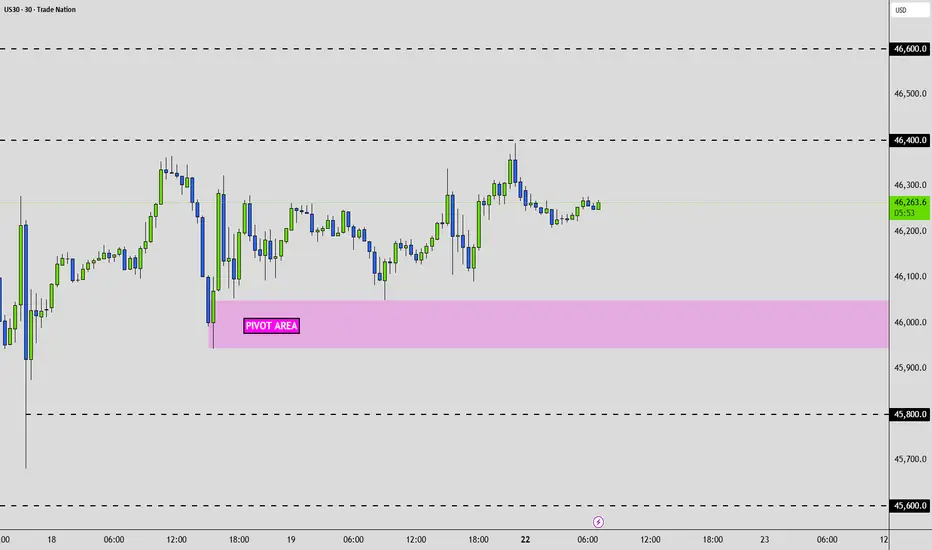
Dow Jones - US30: Trading Edge TodayDear Friends in Trading,
Experimental Test Phase Week:
Correlation Logic & Daily Efficiency - GOLD🔄NASDAQ🔄DOW JONES
🔎 Previous Week Observations -
Price built a volume base / cluster around 45,950 – 46,050 last week (multiple rotations here).
Breakout rallies on the 18th and 19th pushed price above 46,200, which is now acting as resistance/acceptance.
Current level (~46,273) is sitting right at this balance edge.
🎯US30 - 22Sept:
Pivot Area: 46,000 ± 50
Bias: Neutral-Bullish above pivot
Bull targets: 46,400 → 46,600
Bear targets: 45,800 → 45,600
👉 Gold and indices are inversely correlated intraday; if one pivots, the other confirms.
Dow showing slower but steady grind.
Needs >46,400 to confirm breakout continuation.
I sincerely hope my point of view offers a valued insight.
Thank you for taking the time study my analysis.
Us30 Trade Set Up Sep 23 2025Price swept PDH in London session and formed a SSL at Asia lows so if price sweeps it and closes above i will look for 1m IFVG and CISD to take higher but if price closes under i will look for sells to test 1h FVG

Short Position On Us30"Shorted Dow Jones ⚡ Risk managed. Once +100 pts hit, we go risk-free. Protect the bag, let the trade run. #TradingDiscipline #DowJones"