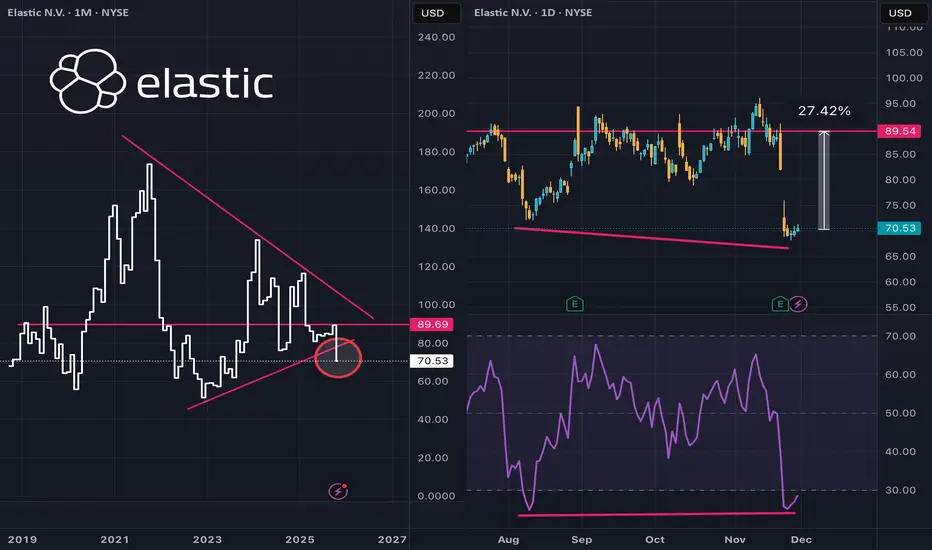
$ESTC creeping towards buy territoryEven after a couple earnings beats in a row NYSE:ESTC has slipped below the bottom edge of a large symmetrical triangle.
Drilling into a daily chart and squinting a bit, there's a mild bullish momentum divergence. Hard to say if the bottom is in just yet, but it does look like one to put on the watch list.
When NYSE:ESTC swings into an uptrend, which could be just months away, the upside potential could be substantial.
Trade ideas
ESTC Trade Analysis & Plan📊 ESTC Trade Analysis & Plan
Symbol: NYSE:ESTC (Elastic N.V.)
Current Price: $89.18
Bias: 🔥 Bullish (Short-to-Mid Term)
🔎 Technical Observations
Double Bottom Formation around the $74.60 level confirms a strong base with buyers defending the zone.
Fibonacci Levels: Price currently consolidating near equilibrium and attempting to reclaim the 0.618 retracement zone. Major upside extensions point toward $113–$118 before reaching the 1.618 Fib expansion.
Supply Zones marked between $95–$118 may act as resistance clusters; however, strong momentum could trigger a breakout.
Volume Analysis: Noticeable spikes on rallies suggest accumulation during dips.
📈 Predictive & Institutional Models
WaverVanir DSS Forecast:
15-Day: $90.09 (+1.0%)
30-Day: $91.29 (+2.4%)
Institutional Forecast (Stacked Ensemble):
Target Price: $96.87 (+8.6%)
Confidence Interval: $92.28–$102.65
Signal: STRONG BUY
Risk Metrics:
Max Drawdown: 36.4%
Sharpe Ratio: 0.59 (moderate risk-adjusted return)
Institutional Agreement: 9/9 bullish
🛠 Trade Plan
Entry Zone: $88.5–$90.0 (current consolidation zone)
Stop Loss: $82.75 (recent structural low, ~7% downside protection)
Target 1: $90.96 (short-term resistance)
Target 2: $96.87 (institutional forecast target, +8.6%)
Target 3: $113.00 (Fib 1.272 extension if breakout sustains)
Risk/Reward: ~1:2+
Position Size: 25% allocation recommended due to volatility
⚡️ Catalyst Watch
Technical Catalyst: Double bottom & Fib extensions aligning with predictive bullish models.
AI/Institutional Consensus: Strong Buy signal from institutional DSS with 95% confidence range supports the trade thesis.
Market Sentiment: All nine institutional models lean bullish → upside bias remains intact.
🚀 Conclusion
ESTC is showing a structural reversal pattern, supported by predictive DSS and institutional grade forecasting. As long as $82.75 holds, the path of least resistance is up. First targets are modest ($91–$97), but a clean breakout above $100 could open the door to triple-digit Fib extensions ($113–$118).
Trade smart, manage risk, and scale in/out.

ESTC - JULY 24 MATrend Sustainable MomentumMATrend Sustainable Momentum (Systematic) 🚀
This is a variant of the Unsustainable strategy. System identifies stocks (Tech sector) that follows the larger market regime's momentum of the day.

5/30/24 - $estc - difficult setup for longs-caution. out of pool5/30/24 - vrockstar - NYSE:ESTC - careful here. burning a post to warn that this 10x sales valuation but ~20% pa growth and no opex flex + a ton of stock comp obscuring true FCF generation are the factors that are getting murdered in this tape. the stock has been an unlikley winner since struggling v. the Q's for some time. the options chain is defn pricing in a lot of volatility and many are hedging quite expensive (for good reason in the 80s handle). don't think this is one that beats and rips much further than low 100s and downside is probably 2x the upside here.
caution.

ESTC - Corrective movement in the downtrendAlignment and partial compression of multitimeframe fibo clouds signal an increase in the probability of reaching the first target. The final target is a possible bonus with a risk-return ratio of 3. Risk management with realization of the first target and moving the stop loss is an indispensable part of this operation.

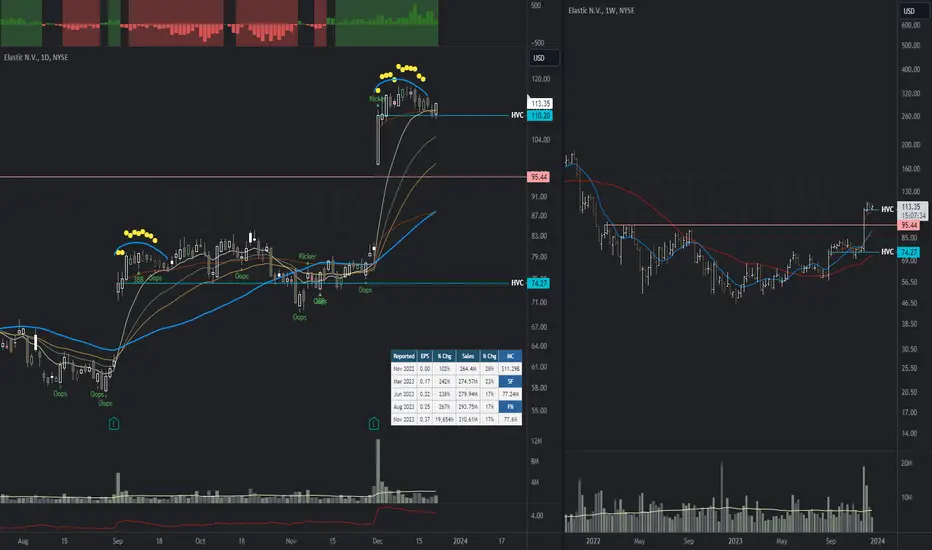
ESTC Pushing Resistance after PEGESTC making a nice run at the downward resistance on the daily. Printed a beautiful PEG after earnings in early December. Nice looking hammer candle during a weak tape suggests this should be a leader when markets bounce.

ESTC 12/21/23Acting very similarly to its previous earnings gap. Three day surge that stays overextended (4x+ ATR from the 10-day avg) for about two weeks, rolls over into 10ema & erVWAP. Expecting similar results or more serious follow-through?
Low volume holiday trading ahead.


$ESTC: Netherlands Data ManagementStrong momentum setup here with ESTC, going to be watching potential break outs next week

HEAD AND SHOULDERS PATTERN ON ESTCIdentification of a Head & Shoulders Pattern, Down Trendline and EMA 200 Tren Indicator on ESTC

ESTC HEAD AND SHOULDERS PATTERNIdentification of a Head & Shoulders pattern, downtrend line and EMA 200 trend indicator on ESTC

$ESTC Breakout Pullback SetupJust flipping through charts and came across $ESTC, really like how its setting up as a breakout pullback trade. Bounce of 50 MA with a quite inside day today.

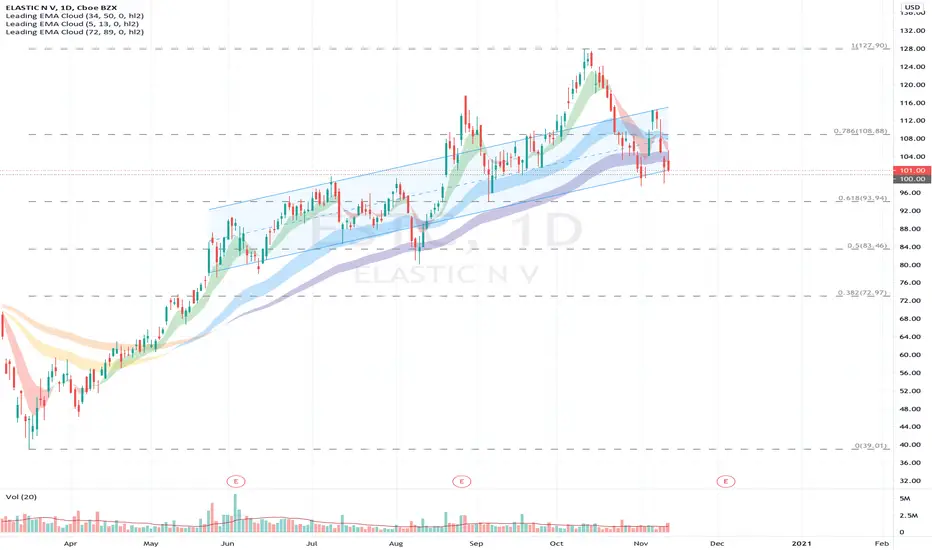
ESTC - Cup and Handle (8/16/2021)Larger cup and handle play for this tech name. Stock is currently still forming a handle with KMA catching up which is exactly what you want to see. This stock could continue to hold the handle until they report earnings which is what happened to a lot of the earnings reports recently.
A good R/R setup would be a pullback to the 23EMA with a 5% stop loss or a break past the current resistance at the $159.00 area.

ESTC - Breakout; Wait For PullbackElastic has broken out and looks to be an industry leader coming soon. Wait for the retest and a good buying opportunity may present itself around the $140 mark.


$ESTC - in earningsnear the 20 EMA, MACD is primed and stochastic is supportive
Following my prior prediction for pattern


Options long and shortGreat short candidate below 100 which is a big psych number as well as the neckline for this head and shoulders. If this level can hold it is in an uptrend that can continue.

ELASTIC N V now is in BUY Situation DailyHey guys, ELASTIC N V is in a bullish dynamic with an average sales volume and a doji which makes see a rejection of the buyers. On the TIMEFRAME 1Min a doji on the VWAP with a bounce and a big shadow bulls made. It goes in the direction of its previous higher on the TIMEFRAME 15 Min. Big possibility of reaching your next highest on the daily the next objective is on the next high. It can be achieved if the buyers make their returns.
Please LIKE & FOLLOW, thank you!

$ESTC Breakout of Pennant? I've been watching $ESTC for an entry on breakout of this pattern. If this can push above today's high, I'll be looking for an entry over $107.30 with a very tight stop below today's low. Target is back to previous high. All TBD. Ideas, not investing / trading advice.
