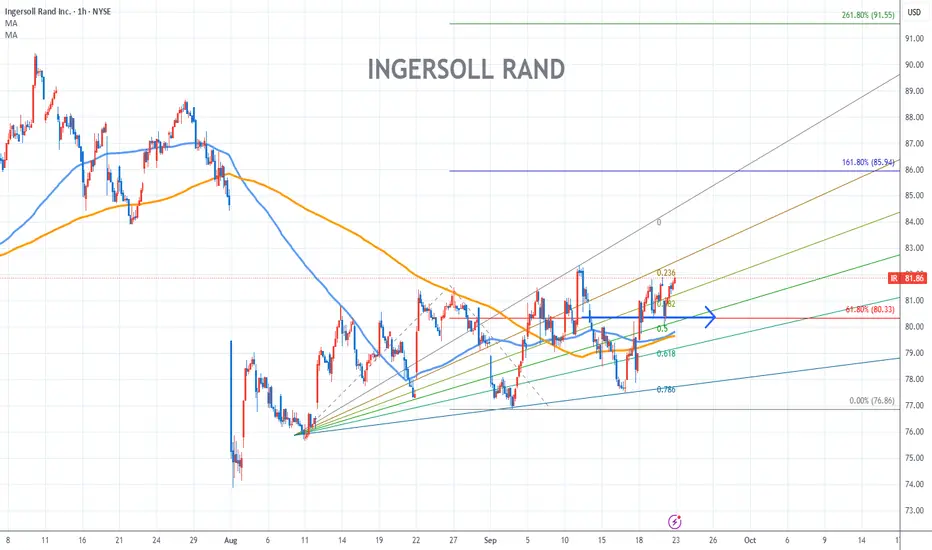
Ingersoll Rand Chart Fibonacci Analysis 092225Trading Idea
1) Find a FIBO slingshot
2) Check FIBO 61.80% level
3) Entry Point > 80/61.80%
Chart time frame:B
A) 15 min(1W-3M)
B) 1 hr(3M-6M)
C) 4 hr(6M-1year)
D) 1 day(1-3years)
Stock progress:B
A) Keep rising over 61.80% resistance
B) 61.80% resistance
C) 61.80% support
D) Hit the bottom
E) Hit the top
Stocks rise as they rise from support and fall from resistance. Our goal is to find a low support point and enter. It can be referred to as buying at the pullback point. The pullback point can be found with a Fibonacci extension of 61.80%. This is a step to find an entry-level position. 1) Find a triangle (Fibonacci Speed Fan Line) that connects the high (resistance) and low (support) points of the stock in progress, where it is continuously expressed as a Slingshot, 2) and create a Fibonacci extension level for the first rising wave from the start point of the slingshot pattern.
When the current price goes over the 61.80% level, that can be a good entry point, especially if the SMA 100 and 200 curves are gathered together at 61.80%, it is a very good entry point.
As a great help, TradingView provides these Fibonacci speed fan lines and extension levels with ease. So if you use the Fibonacci fan line, the extension level, and the SMA 100/200 curve well, you can find an entry point for the stock market. At least you have to enter at this low point to avoid trading failure, and if you are skilled at entering this low point, with the fibonacci6180 technique, your reading skill of to chart will be greatly improved.
If you want to do day trading, please set the time frame to 5 minutes or 15 minutes, and you will see many of the low points of rising stocks.
If you prefer long-term range trading, you can set the time frame to 1 hr or 1 day
Trade ideas
Ingersoll Rand: Potential Bear FlagIngersoll Rand has struggled all year, and some traders may expect further downside.
The first pattern on today’s chart is the series of higher lows since a negative gap on August 1. The industrial stock ended Tuesday below that rising line, which could be interpreted as a bear-flag breakdown.
Second is the July 20 weekly close of $80.39. IR rebounded to that level last month but failed to stay above it. That may suggest that old support has become new resistance. (Stochastics also fell from an overbought condition.)
Speaking of resistance, you also have the February 14 high of $89.22. Prices stalled at that level twice in July.
Next, the 50-day simple moving average (SMA) had a “death cross” below the 200-day SMA in February and has remained there since. Has the long-term trend turned negative?
Finally, the 8-day exponential moving average (EMA) is below the 21-day EMA. That may be consistent with short-term bearishness.
TradeStation has, for decades, advanced the trading industry, providing access to stocks, options and futures. If you're born to trade, we could be for you. See our Overview for more.
Past performance, whether actual or indicated by historical tests of strategies, is no guarantee of future performance or success. There is a possibility that you may sustain a loss equal to or greater than your entire investment regardless of which asset class you trade (equities, options or futures); therefore, you should not invest or risk money that you cannot afford to lose. Online trading is not suitable for all investors. View the document titled Characteristics and Risks of Standardized Options at www.TradeStation.com . Before trading any asset class, customers must read the relevant risk disclosure statements on www.TradeStation.com . System access and trade placement and execution may be delayed or fail due to market volatility and volume, quote delays, system and software errors, Internet traffic, outages and other factors.
Securities and futures trading is offered to self-directed customers by TradeStation Securities, Inc., a broker-dealer registered with the Securities and Exchange Commission and a futures commission merchant licensed with the Commodity Futures Trading Commission). TradeStation Securities is a member of the Financial Industry Regulatory Authority, the National Futures Association, and a number of exchanges.
TradeStation Securities, Inc. and TradeStation Technologies, Inc. are each wholly owned subsidiaries of TradeStation Group, Inc., both operating, and providing products and services, under the TradeStation brand and trademark. When applying for, or purchasing, accounts, subscriptions, products and services, it is important that you know which company you will be dealing with. Visit www.TradeStation.com for further important information explaining what this means.

3rd Wave About to Start in Ingersoll Rand (IR)Good looking Elliott Wave setup in NYSE:IR
Stock rose in clean 5 waves impulse wave followed by 3 waves down in ABC to almost exactly at 61.8% level around 75. If the wave C low 73.87 holds then we can expect another 5 wave rise in larger (3) or (C) on the upside. As per wave equality principle, we can expect it to be same in size as the previous 5-wave rise seen in the chart. That gives a potential target of 98.7 for current levels. 1.618 times of the move is at 114.04 which could be second (extended) target.
Note that invalidation level for this setup is wave C low at 73.87.


IR LongIR has put a reversal weekly candle. The ultimate support is at 80 area, but unless market weakens in general or earnings surprise to the downside, I consider the most recent drop from 105 to 90 was corrective abc following the bullish 5 waves impulse. If true, it represents more than 15% upside.

IR potential Buy setupReasons for bullish bias:
- Price gave range breakout
- Price broke ATH
- Overall a bullish trend
- No divergence
Here are the recommended trading levels:
Entry Level(CMP): 97.28
Stop Loss Level: 86.37
Take Profit Level 1: 106.74
Take Profit Level 2: Open

IR heads up at $95 then 100: at or near a topIR continues to print new All Time Highs.
We might get a pullback here or soon.
Lets see how it reacts at this resistance.
$ 94.84- 95.14 is the immediate resistance.
$ 99.90-100.35 will be obviously difficult.
$ 73.08- 73.38 the dream long term entry.
=======================================

Ingersoll Rand Bolsters Business Durability Ahead of EarningsIngersoll Rand Inc. (NYSE: NYSE:IR ), a renowned global provider of mission-critical flow creation and industrial solutions, has taken significant strides to fortify its business resilience through two strategic acquisitions: Controlled Fluidics and Ethafilter s.r.l. These acquisitions mark a pivotal moment in Ingersoll Rand's growth trajectory, solidifying its position in key markets and underlining its commitment to strategic expansion.
Controlled Fluidics, renowned for its expertise in thermoplastic bonding and custom plastic assembly products, brings a wealth of experience in serving diverse industries, including life sciences, medical, aerospace, and industrial applications. This acquisition aligns seamlessly with Ingersoll Rand's existing life sciences portfolio, opening doors to new revenue streams and enhancing market share in high-growth sectors. By integrating Controlled Fluidics into its Precision and Science Technologies (P&ST) segment, Ingersoll Rand aims to capitalize on synergies and drive sustainable growth in target markets.
Similarly, the acquisition of Ethafilter, an esteemed producer of filters and filter elements for the compressed air sector, presents exciting opportunities for Ingersoll Rand. With a focus on delivering innovative solutions and cutting-edge technology, Ethafilter's offerings perfectly complement Ingersoll Rand's industrial portfolio. By incorporating Ethafilter into its Industrial Technologies and Services (IT&S) segment, Ingersoll Rand anticipates expanding its product range, penetrating new markets, and bolstering aftermarket services.
Vicente Reynal, Chairman and CEO of Ingersoll Rand, expressed enthusiasm about the strategic acquisitions, stating, "The acquisitions of Controlled Fluidics and Ethafilter are the latest examples of our continued strategy to acquire adjacent technologies that will complement our core offerings and provide opportunities for growth." Reynal emphasized Ingersoll Rand's commitment to compounding growth through targeted acquisitions, ensuring the long-term durability and competitiveness of the business.
These acquisitions underscore Ingersoll Rand's proactive approach to capital allocation and its focus on achieving mid-teens return on invested capital (ROIC) within a reasonable timeframe. By strategically expanding its portfolio and strengthening its market presence, Ingersoll Rand positions itself for sustained success in the evolving industrial landscape.
As Ingersoll Rand ( NYSE:IR ) continues to pursue growth opportunities and enhance its capabilities, investors and stakeholders can look forward to a resilient and dynamic company poised for future success in delivering innovative solutions to global challenges.
Technical Outlook
Ingersoll Rand ( NYSE:IR ) is trading above the 200, 100, and 50-day Moving Averages (MA) respectively with a Relative Strength Index (RSI) of 54.89. indicating a moderate buying rate from the bulls.
The stock's 4-month price charts show an "inverted hammerhead" pattern indicating signs of a bullish takeover with the RSI attesting to the thesis.

Ingersoll Rand Bounces at Old HighIngersoll Rand has barely moved for about six weeks, and some traders may look for its uptrend to resume.
The first pattern on today’s chart is the February 16 high of $92.32, immediately after the last earnings report. The industrial stock remained below that level for more than month. It pushed higher for about two weeks before coming back to hold the same level. Has old resistance become new support?
Second, you have the 21-day exponential moving average (EMA). Notice how IR bounced at the 21-day EMA in early January and mid-March. It appeared to do the same thing last week.
Third, the 8-day EMA has remained above the 21-day EMA. That may reflect the presence of an uptrend.
Finally, a falling trendline started on March 25 but Friday’s close was above it. That may suggest a period of weakness is ending.
TradeStation has, for decades, advanced the trading industry, providing access to stocks, options and futures. See our Overview for more.
Past performance, whether actual or indicated by historical tests of strategies, is no guarantee of future performance or success. There is a possibility that you may sustain a loss equal to or greater than your entire investment regardless of which asset class you trade (equities, options or futures); therefore, you should not invest or risk money that you cannot afford to lose. Online trading is not suitable for all investors. View the document titled Characteristics and Risks of Standardized Options at www.TradeStation.com . Before trading any asset class, customers must read the relevant risk disclosure statements on www.TradeStation.com . System access and trade placement and execution may be delayed or fail due to market volatility and volume, quote delays, system and software errors, Internet traffic, outages and other factors.
Securities and futures trading is offered to self-directed customers by TradeStation Securities, Inc., a broker-dealer registered with the Securities and Exchange Commission and a futures commission merchant licensed with the Commodity Futures Trading Commission). TradeStation Securities is a member of the Financial Industry Regulatory Authority, the National Futures Association, and a number of exchanges.
TradeStation Securities, Inc. and TradeStation Technologies, Inc. are each wholly owned subsidiaries of TradeStation Group, Inc., both operating, and providing products and services, under the TradeStation brand and trademark. When applying for, or purchasing, accounts, subscriptions, products and services, it is important that you know which company you will be dealing with. Visit www.TradeStation.com for further important information explaining what this means.

IR Potential buy setupReasons for bullish bias:
- Simple DOW theory
- Safe entry will be above 84.44
Entry Level(Buy limit): 80.12
Stop Loss Level: 73.64
Take Profit Level 1: 86.6

Ingersoll Rand Inc WCA - Cup and HandleCompany: Ingersoll Rand Inc.
Ticker: IR
Exchange: NYSE
Sector: Industrials
Introduction:
In today's technical analysis, we turn our attention to Ingersoll Rand Inc. (IR), a key player in the Industrials sector, listed on the NYSE. The weekly chart is demonstrating a potential Cup and Handle formation, a well-known bullish reversal and continuation pattern. This pattern has developed over a period of 553 days, suggesting a possible breakout on the horizon.
Cup and Handle Pattern:
This Cup and Handle pattern is a bullish continuation pattern that occurs during an uptrend and represents a period of consolidation followed by a breakout. It is characterized by a "cup" formation, followed by a smaller consolidation period called the "handle."
Analysis:
Previously, IR's chart was showing a clear uptrend, indicated by the green dashed line. Now, we are witnessing a consolidation phase that appears to take the form of a Cup and Handle pattern.
The horizontal resistance is at $60.51, and the price is comfortably above the 200 EMA, signaling a bullish environment. A breakout above this resistance level could be a potential entry point for a long position.
However, this setup also presents a unique condition, a natural breakout filter, in the form of a secondary resistance level at $62.33. A convincing breakout would ideally surpass both these resistance levels.
The potential price target, if both resistance levels are broken, is set at $81.63, signifying an upside of approximately 35% from the breakout level.
Conclusion:
IR's weekly chart reveals an interesting setup with a potential Cup and Handle pattern. This could suggest a continuation of the previous bullish trend. This setup is currently a watchlist candidate and not a direct trading recommendation.
As always, this analysis should be used as part of your comprehensive market research and risk management strategy. Please remember, this is not financial advice and investing always involves risk.
If you found this analysis helpful, please consider liking, sharing, and following for more insights. Wishing you profitable trading!
Best regards,
Karim Subhieh

INGERSOLL RAND Stock Chart Fibonacci Analysis 042223Trading Idea
1) Find a FIBO slingshot
2) Check FIBO 61.80% level
3) Entry Point > 55.3/61.80%

$IR with a Bullish outlook following its earnings #Stocks The PEAD projected a Bullish outlook for $IR after a Negative over reaction following its earnings release placing the stock in drift C with an expected accuracy of 66.67%.

IR - Resistance Turned Support Up trend has been solidified with this clean resistance turned support
The support area is shown with the up arrow
Bars pattern placed is just to show my bullish expectations on this weekly chart

$IR with a Bearish outlook following its earnings #Stocks The PEAD projected a Bearish outlook for $IR after a Negative Under reaction following its earnings release placing the stock in drift D.

$IR: Is the ESG Era Upon Us?ESG (Environmental, Social and Governance) is a buzzword in the investment community that has begun to pick up steam. Will the dollar continue to appreciate giving a buffer for US spending bills and a liking for stocks with a lot of domestic potential? Time will tell. Good luck trader

$IR Nice Cheat Setup around its 50 MA$IR setting up a nice cheat around its 50 MA after breaking out in November on earnings. Held up well with volume pattern looking strong and showing signs of accumulation.

IR broke out of consolidation* Strong earnings quarter over quarter
* General up trending
* Trading at higher than average volume
* Potential to give +16% ROI
Trade Idea:
* If you're looking for a discount look for buying opportunities around $51.61
* This is trading at higher than average volume so there are chances that it may continue going up. If you're not so much of a discount person, getting in now would be ideal.

Ingersoll Rand Enhances Comprehensive Capital Allocation StrategIR: Ingersoll Rand Inc.
2021-09-01 16:30:00
Ingersoll Rand Enhances Comprehensive Capital Allocation Strategy Anchored by M&A; Plans to Initiate Dividend and Authorizes New Share Repurchase Program

IR BreakoutIR Breakout
6 Month Long Rectangle Pattern
Last Dip held by 200 DMA
Looking for a follow through now

Is Ingersoll Rand Breaking Out?Attention has focused on growth stocks for the last two months. Now could be the time to return to industrial names like Ingersoll Rand.
The manufacturing conglomerate has gone nowhere for over five months. However it made a series of higher lows since mid-June while holding below $49.50. The result is a bullish ascending triangle, which now appears to be breaking.
That zone has additional importance because it’s also the location of the 50-day simple moving average (SMA). Bollinger Bandwidth has been toward the narrower end of its range as well.
The news flow could be positive for IR because earnings, revenue and guidance beat estimates last week. Congress is also near passing an infrastructure bill, which would mostly favor industrials.
Speaking of industrials, a strange thing has been happening inside the sector: Some of the biggest names like United Parcel Service and Boeing have struggled for their own reasons. But many of the smaller names that track general economic activity – like Carrier, Otis and TE Connectivity – are jumping. IR fits more under that second group.
TradeStation is a pioneer in the trading industry, providing access to stocks, options, futures and cryptocurrencies. See our Overview for more.

$IR Inverse Head and ShouldersIngersoll-Rand is basing right below ATHs in an inverse head and shoulders base. A breakout will most likely send the stock into all time high territories.
Ingersoll-Rand Inc (IR)- MANUFACTURES, MARKETS, AND SERVICES FLOW CONTROL EQUIPMENT, VACUUM, INDUSTRIAL COMPRESSORS AND PUMPS.

$IR - day tradeAccording to my screener, and historical profiling, and tracking past 8 Friday's performance, and listening to people smarter than me....
This may make a move for ATH today. Thinking of grabbing early for the potential to run. I will watch the open to see how it shakes out. It has a bull pennant and other screeners have said now is the time.
