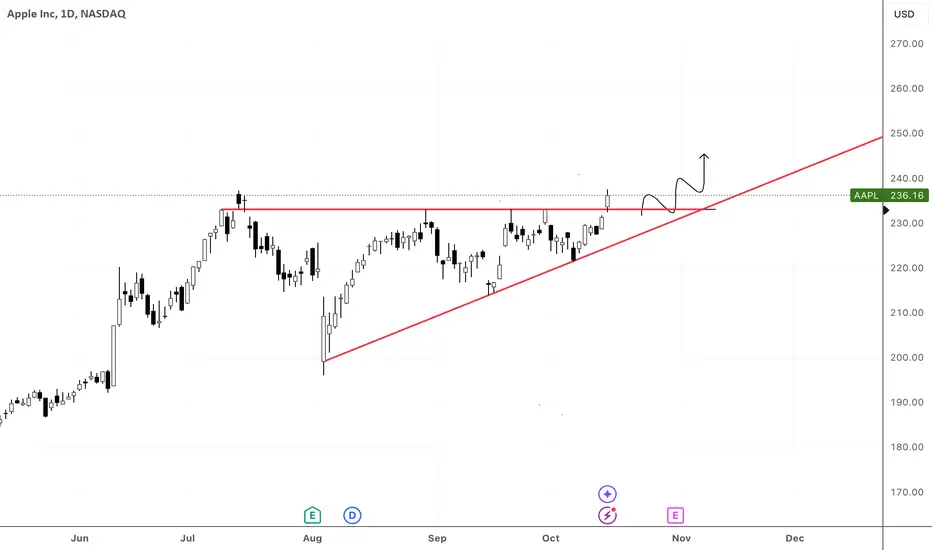
AAPL Ascending Triangle Hourly/Daily SetupAAPL Ascending Triangle Hourly/Daily Setup
Price Targets are:
- Break above 233
- 246
- 260
- Beyond
Trade ideas

Apple – Triangle Pattern with Breakout PotentialApple is currently forming a triangle pattern on the chart. If we break through the resistance, my next target is in the green zone, which I've identified as the next key level.
Strategy: I’m watching for a breakout from the triangle, and if it occurs, I’ll be targeting the green zone as the next potential profit area.

AAPL Long IdeaAAPL finally got the big triangle breakout I had been waiting for and rejected nicely off of ATH. Now I'm watching for another long opportunity if it can come back for a retest of the 232-233 area. Shorter term level, but I'd expect AAPL to get more continuation after the triangle breakout so looking for areas with support for a long. Would stop out if it falls below 232 and potentially look for a long on the retest of the triangle below.

What Is Money Flow In & Out of a Stock? And Why Should You Care?Professionals often speak of money flowing in or out of a stock, but how can that be if there is an equal number of buyers and sellers? It is because “Money Flow” comes from the balance of the lot sizes.
There are four possible positions in any one stock:
Buy
Buy to Cover
Sell
Sell Short
Each investor and trader in the stock has their own separate agenda. Each may come from a different Market Participant Group. There are now 9 Stock Market Participant Groups, starting from those who buy first, at the bottom of a new upward cycle:
The giant Buy Side Institutions who invest Mutual and Pension Funds and/or create ETFs and other kinds of stock market derivatives.
The Sell Side Institutions, aka the big banks and major market makers
Wealthy Individual Investors
Corporations
Institutional/ Pro Traders
High Frequency Traders (HFTs)
Small Funds
Individual Small-Lot Investors, Investment Groups and Individual Retail Traders
Odd-Lot Investors
Buyers are anticipating that the stock is going to move up. Their stock order types span the spectrum, for example: Market Orders, Limit Orders, Stop Orders. Buy to Cover Orders are placed by traders who sold short and are now taking profits.
Those who are selling the stock are anticipating that the stock is going to move down. In an uptrending stock, this is profit-taking near the top of the run. It can also be similar in a downtrending stock because the seller is afraid that the stock is going to move down more, and they have been holding through what they thought was a short retracement. Most of these stock order types will be “Sell at Market” (SAM). Sell Short Traders are anticipating that the stock is going to move down, and they can place a variety of orders just like the buyers.
Both Buyers and Sell Shorters are entering the trade, while Buy to Covers and Sellers are exiting the trade.
It is the mix of these different types of buying and selling coupled with the kind of investor or trader and the size of their share lots that causes money to flow in or out of a stock.
If the buyers are mostly large lots and the sellers are mostly small lots, who is in control? The buyers purchasing large lots . This is because, at some point, there will not be enough small-lot sellers, and those who are Selling Short will turn and start Buying to Cover, creating more of a shortage of sellers. Consequently, this will put more pressure on the buy side.
There are always latecomers to a stock run, and they are usually small-lot buyers. As the stock moves up in price, more of the small-lot buyers will step in, pushing the price up even further. Most small-lot buyers typically use a “Buy at Market” Order, which is the worst kind to use to control the entry price.
As the stock moves up further in price, the last of the Short Sellers will panic and Buy to Cover, causing the stock to gap up or jump even higher. This then triggers the large-lot buyers to start selling for profit. As profit-taking begins, the stock dips in price. This causes the odd-lot buyer, who is the last in the market participant cycle to buy, to rush into the stock and buy because they have been told to “Buy the Dip.” By now, the news media has been talking about this stock and its great run. Consequently, the odd-lot uninformed investor finds the dip irresistible and buys on pure emotion without any analysis of the stock. This causes the final gap up and exhaustion pattern.
Now, while all of those odd-lot latecomers are buying, who is selling to balance the equation? Market Makers are Selling Short and the Smart Money, who were the first to enter, are selling to take profits. Suddenly, the large lots are now shifting to the downside, and what happens? The control switches to the sellers who are moving larger lots. Now, money is flowing out of the stock, yet the price may go up briefly before a downtrend develops.
Large lots are usually wiser investors and traders who know more than the other investors and traders. So the giant Buy Side Institutions investing Mutual and Pension Funds, who have access to information often not yet available to Individual Investors and Retail Traders, are called the Smart Money.
It can be assumed that the smaller the lot size, the less the investor or trader knows and understands about the market. As smaller lots move in, a shift of power occurs due to the large lots moving to the sell side, and thus money shifts to flowing out of the stock.
As the stock collapses and reaches a price or equilibrium near a base or bottom, those smaller lots who held through the collapse reach an emotional point of extreme pain of loss and begin to sell in panic. In response, the Smart Money and Market Makers switch roles again, Buying to Cover their profitable shorts and buying to hold as the stock moves up again.
Summary:
Every time you take a position in a stock, there are also three other positions in that same stock. You need to be aware of each of these and make sure that you are with the right group. Most of the time, traders who are having problems with their trades are simply trading with the wrong group. It is important, then, to learn about today's stock market structure and what I call the "Cycle of Market Participants." When traders can trade with the flow of the Smart Money, they have a decided advantage.

The Apple Doesn't Fall From the Tree!!!! NASDAQ:AAPL is finally breaking out! We have broken above previous highs of $233.
Any retrace back to low $230's is a buy AS LONG AS we get a strong daily close above $233
AAPL: Momentum Brewing – What's Next?▋Observation & Meanings:
▪The downside breakout from the ranging zone failed, and the price even took out the high of the range, reversing into an uptrend, followed by minor congestion.
▪After reversing the trend, the bulls showed their further intent by breaking above the congestion high.
▋What to expect next?
▪The price has retested the high of the congestion zone, and this level should hold if the bulls intend to maintain momentum.
▋The big 3 zones:
▪The continuation zone:
▫ The next major resistance will be level X.
▫ Although the resistance is significant, this is the third attempt, and with plenty of fuel (position) accumulated below during this period, a breakout is likely.
▫ Additionally, an ascending triangle pattern has formed on the 4-hour chart, reinforcing the potential for an upward breakout.
▫ If the key resistance at X is broken, a short squeeze could occur as sellers are forced to cover their positions, driving the price to the next level.
▪The unclear zone:
▫ If the price falls back into the congestion zone, wait for clearer signals before making a move.
▪The defending zone:
▫ If the price breaks below the defending level, the low of the congestion, the trend will likely shift back to the downside.
▋Don’t predict the price, trade the price.
▋Note: These zones adjust in real time based on price movements and evolving market conditions.
▋Not Financial Advice
The information contained in this article is not intended as, and should not be understood as financial advice. You should take independent financial advice from a professional who is aware of the facts and circumstances of your individual situation.

AAPLTrigger for Calls is over 230.
Levels above are 233, 237.
Trade Idea: 232.5C Oct 25
**Earnings are on Thursday Oct 31.

Apple weakness into earningsAlthough Apple tends to exceed expectations on every earnings call, I believe this setup looks bearish. A standard wedge which is one of my most favored setups to evaluate. Steadily falling average volume with a low but not bottomed stochastic RSI. I did mark what I believe to be the general bottom on stochastic for Apple. The OBV has been tested many times, look for a break to the downside. I look for a price of 207$ or at least 214$.

AAPLContinuation of growth towards the 262.52 area and higher within wave C of 3 of the diagonal.
The growth will be canceled if the price consolidates below the accumulation zone of 210-214

AAPL Long*Ticker:** AAPL
**Trade Type:** long
**Entry Price:** 229.52
**Stop Loss:** 228.86
**Take Profit 1:** 226.04
**Take Profit 2:** N/A
**Risk/Reward Ratio:** 5.15
**Timeframe:** daily
**Monthly Status:** red inside bar
**Weekly Status:** green
**Daily Status:** green
**Hourly Status:** green

Can the MAGNIFICENT 7 outperform once more?We have seen the Magnificent 7 (Apple, Microsoft, Google, Amazon, Nvdia, Meta, Tesla) underperform historically but since the start of the year this hasn't been as strong as previously (roughly +35% for M7 against + 25% for Nasdaq). The former can be seen on the left chart while the latter on the right. This goes so far against the aggressive nature of the Magnificent 7 (M7), which have outperformed Nasdaq on all previous rallied by around +50%.
In fact the M7's first major rally (2016 - 2018) rose by +140% while NDX's by +97%. The second major rally (2019 - 2021) registered +315% for MA7 and 'just' +185% for NDX. If there is any progression between them, we can argue that the current rallies will be even stronger. Of course the sample isn't big enough for solid conclusions and multi-year rallies can't keep getting stronger on each Cycle for ever.
What is reasonable to count on however, is that as the Fed stepped in recently and gave the market the first Rate Cut in years, a new Cycle of cheap money to invest with has started and we can expect rallies of equal strength with the previous ones. For M7 (+315%) that's $440, so around +60% from the current levels, while for Nasdaq (+185%) that's 30000, so around +47% from the current levels. Not an incredible difference considering the risk that highly volatile stocks like the M7 bear. This could be a sign that the market is shifting to other stocks during this Cycle and the M7 potential may be fading.
In any event, do you think the Magnificent 7 will start to outperform Nasdaq again and if so is this worth the risk than investing your capital on the 100 companies of the index?
-------------------------------------------------------------------------------
** Please LIKE 👍, FOLLOW ✅, SHARE 🙌 and COMMENT ✍ if you enjoy this idea! Also share your ideas and charts in the comments section below! This is best way to keep it relevant, support us, keep the content here free and allow the idea to reach as many people as possible. **
-------------------------------------------------------------------------------
💸💸💸💸💸💸
👇 👇 👇 👇 👇 👇

$AAPL Identifying a Macro 5-Wave Structure In this updated chart, I’m highlighting what appears to be a macro 5-wave structure based on Elliott Wave Theory: Here’s the breakdown:
1. Wave 1 starts from a low point and pushes up strongly, initiating the trend.
2. Wave 2 corrects back but does not fully retrace Wave 1, maintaining the overall upward trend.
3. Wave 3 is a powerful impulsive wave that surpasses Wave 1’s high, as expected in Elliott Wave theory.
4. Wave 4 is a corrective phase, with a shallower retracement compared to Wave 2.
5. Wave 5 is currently unfolding, moving upward and potentially marking the final push in this trend before we enter a larger correction or a reversal.
The next step would be to watch for signs of an A-B-C corrective wave once Wave 5 is completed.
Thoughts?

$AAPL 230 retest and potential PULL BACKAbove 233.25 Apple will retest all time highs, if we fail to get above I expect a pull back for earnings then would be LONG.
TIP: use 24HR timeframe with extended hours instead of daily.

Trade Idea | AAPL Short Trade Idea:
Short Entry: 230.15
Stop Loss: 234.25
Why are we shorting this?
AAPL stock price is overvalued
META 's VR Headset ($299.99) is cheaper compared to AAPL Vision Pro ($3,499)
Latest Iphone model still waiting for AI
Apple Is No Longer in Talks to Join OpenAI Investment Round
Buffet trimmed down his stake already
Ask yourself, what's the next big thing of Apple?
I'll start covering at $218.
What do you think? ...

AAPL: Price to IncreaseAnother massive name in the ai and tech space, has always been a great value buy. Prices have been suppressed the past few months during our market correction. Currently, price action is at our long term support line; a dip below this level will be very unusual.

Reacting to Change Part 2: Evolution of TrendsAdapting to subtle changes within a trend is a key element of successful trading. It's not enough to recognise that a trend exists; to stay ahead, you need to understand how trends evolve.
From the initial surge to the steady grind, each phase of a trend carries its own characteristics—and knowing how to react to these transitions is what separates a prepared trader from one caught off guard.
The Anatomy of a Trend
In this section, we’ll explore the different types, phases, and characteristics of trends:
1. Initial Momentum Drive
The first leg of a new trend often follows a prolonged period of sideways consolidation, and this momentum-driven move is typically sparked by a fundamental catalyst. Characterised by a strong surge either higher or lower, this phase usually comes with significant volume and can even include price gaps. The energy in this phase is palpable; it's where the trend announces itself.
Apple (AAPL) Daily Candle Chart
Past performance is not a reliable indicator of future results
2. Standard Pullback, Trend, Pullback Trend
In the heart of a trend, the market often moves in a wave-like fashion: trend legs followed by pullbacks. These pullbacks are typically less volatile and weaker in momentum than the dominant trend legs, making them perfect opportunities for traders to enter in the direction of the trend. Whether you're looking at a bullish or bearish market, these pullback-and-trend cycles are the bread and butter of swing trading strategies.
Apple (AAPL) Daily Candle Chart
Past performance is not a reliable indicator of future results
3. Steady Slide Higher
A rarer but powerful trend type, the steady slide higher (or lower) features minimal pullbacks and a consistent, almost relentless direction. When a trend is in this phase, it signals sustained pressure from buyers or sellers, and it often grinds slowly but surely in one direction. This trend type is highly attractive to trend-followers, but it requires patience and conviction to hold through what may appear to be an over-stretched market.
Tesla (TSLA) Daily Candle Chart
Past performance is not a reliable indicator of future results
4. Exponential Blow-Off
This phase represents the trend on steroids. Expanding ranges, steepening price action, and rising volume all signal that the market has entered an aggressive, almost frantic, final phase. The exponential blow-off can be exhilarating to watch and trade but carries a warning: when this phase comes during an established trend, it's often a sign that the end is near. Traders should be cautious, as a reversal or prolonged consolidation may follow shortly after this euphoric push.
Tesla (TSLA) Daily Candle Chart
Past performance is not a reliable indicator of future results
Simple Tools to Identify Trend Phases
Reacting to these phases means recognising them as they unfold. Luckily, there are several simple tools traders can use to identify which part of the trend they're dealing with.
1. Trendline Fans
Trendlines are perhaps the cleanest and most effective tool for gauging trend strength with no lag. By mapping the swings with multiple trendlines, or trendline "fans," you can visually track momentum. A rising trendline fan—where each new trendline is steeper than the last—indicates increasing momentum, while a falling trendline fan suggests that momentum is starting to ebb. Trendline fans are particularly useful for identifying whether a trend is accelerating into an exponential blow-off phase or slowing down into a pullback phase.
2. Keltner Channels
Keltner Channels are another versatile tool for identifying different trend phases. These bands are plotted around a central moving average, with the distance between the bands determined by the volatility of the market. A price movement outside the Keltner Channels usually signals strong underlying momentum, often associated with the initial trend phase. A steady grind along the bands is characteristic of the "steady slide higher" trend type, while prolonged periods outside of the bands are usually indicative of the exponential blow-off phase. The midline of the Keltner Channels can also be used to gauge pullbacks and time entries during a trend.
3. Long-Term Moving Averages
Long-term moving averages like the 50-day and 200-day simple moving averages (SMA) are essential for gaining perspective on the overall health and strength of a trend. These moving averages act as a dynamic support or resistance level during trends, and their positioning relative to the price can offer clues about the trend's longevity.
4. Anchored Volume Weighted Average Price (VWAP)
The Anchored VWAP is a more sophisticated tool for assessing trend strength. VWAP represents the average price at which a market has traded, adjusted for volume, and anchoring the VWAP to the inception of a trend allows traders to see whether those who initiated the trend are still in control. If the price remains above the anchored VWAP in an uptrend, it suggests that buyers are still in control, whereas falling below could signal that sellers are beginning to take over.
Example: Brent Crude Daily Candle Chart
Let’s take a closer look at how these tools can be applied to understand an evolving trend in the oil market. Recently, oil experienced a strong rally, breaking through the first trendline and surpassing the 50-day moving average. While this initial momentum signals strength, the bigger picture still points to a bearish trend. We see that prices remain below the 200-day moving average, under a long-term descending trendline, and crucially, below the VWAP anchored to the April highs.
This combination of tools highlights the importance of maintaining a wider perspective. Even though there is short-term upward momentum, the prevailing longer-term trend suggests that sellers may still have the upper hand.
Past performance is not a reliable indicator of future results
Conclusion: Adapting to Trend Phases
Understanding and reacting to the different phases of a trend is crucial for any trader. From the initial surge of momentum to the steady grind or explosive blow-off, each phase requires a unique strategy and a deep understanding of market dynamics.
By using tools like trendline fans, Keltner Channels, moving averages, and Anchored VWAP, traders can stay on top of these phases and maximise their potential for success.
Stay flexible, stay alert, and always be prepared to evolve with the trend.
Disclaimer: This is for information and learning purposes only. The information provided does not constitute investment advice nor take into account the individual financial circumstances or objectives of any investor. Any information that may be provided relating to past performance is not a reliable indicator of future results or performance. Social media channels are not relevant for UK residents.
Spread bets and CFDs are complex instruments and come with a high risk of losing money rapidly due to leverage. 82.67% of retail investor accounts lose money when trading spread bets and CFDs with this provider. You should consider whether you understand how spread bets and CFDs work and whether you can afford to take the high risk of losing your money.
