Acuity Brands ($AYI) Set to Release Q4 Earnings TodayAcuity Brands, Inc. (NYSE: NYSE:AYI ), a leading provider of intelligent lighting and space solutions, is set to announce its fourth-quarter earnings report today, October 1st, 2024, before the market opens. Investors and traders are closely watching the company as it prepares to release its latest
Next report date
—
Report period
—
EPS estimate
—
Revenue estimate
—
12 EUR
339.48 M EUR
3.72 B EUR
30.53 M
About Acuity Inc.
Sector
Industry
CEO
Neil M. Ashe
Website
Headquarters
Atlanta
Founded
2001
ISIN
US00508Y1029
FIGI
BBG000F71CQ1
Acuity, Inc. is an industrial technology company, which engages in the provision of lighting and building management solutions and services. It operates through the Acuity Brands Lighting and Lighting Controls and Intelligent Spaces Group segments. The Acuity Brands Lighting segment focuses on product vitality, elevating service levels, using technology to improve and differentiate both products and how to operate the business, and drive productivity. The Intelligent Spaces Group segment includes spaces smarter, safer, and greener by connecting the edge to the cloud. ISG offers building management solutions and building management software. The company was founded in 2001 and is headquartered in Atlanta, GA.
Related stocks

AYI Acuity Brands Options Ahead of EarningsAnalyzing the options chain and the chart patterns of AYI Acuity Brands prior to the earnings report this week,
I would consider purchasing the 260usd strike price Puts with
an expiration date of 2024-10-18,
for a premium of approximately $8.75.
If these options prove to be profitable prior to the e

AYI,,, BreakoutUptrend
Price level at 244 was a s/r level and its been broken by a good bullish candle today. In my view, it is a good buying position in a strong uptrend. About 233 could be a sure SL for it and next targets at about 273 and 300 .

AYI Breaking through a Pivot from 2015AYI is currently breaking through a pivot that's been in place since 2015. Price currently above the major EMAs and has been riding the 20 EMA on the daily chart nicely. A follow through on this break could send price back up to test ATH at $280.

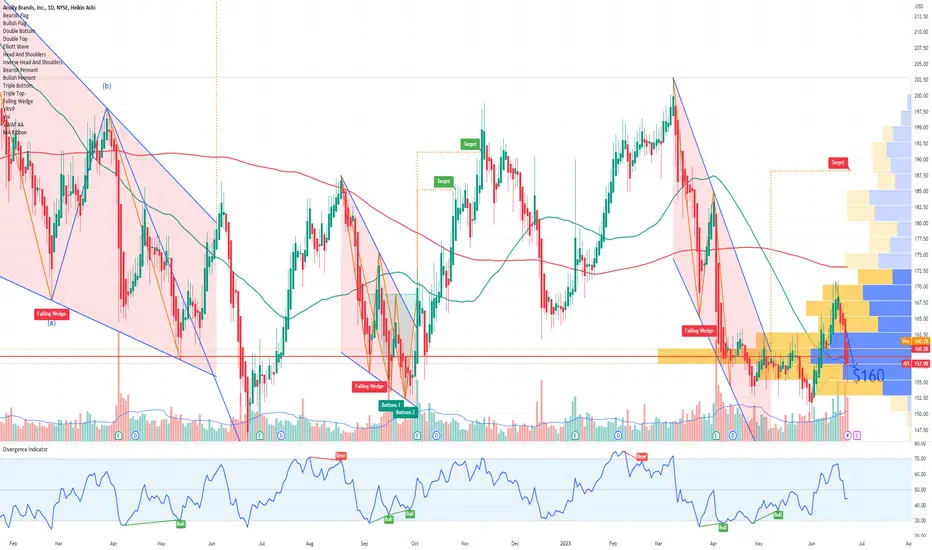
AYI Acuity Brands Options Ahead of EarningsAnalyzing the options chain of AYI Acuity Brands prior to the earnings report this week,
I would consider purchasing the 160usd strike price Puts with
an expiration date of 2023-7-21,
for a premium of approximately $6.35.
If these options prove to be profitable prior to the earnings release, I woul
AYI | Line DrawingInformation to have in mind:
I've graphed a few historic values that most analysts have in their notes.
Acuity Brands, Inc. reports their earnings 04/04/23 BMO: I'm anticipating the market will buy the surprise.
The %B is at a good value to "signal oversold".

AYI - Another Channel BreakoutPrice is now settling above the middle line of a strong channel.
I expect this to be a prompt reversal and price to rise above this up channel as it has in the past
The $400 psychological level looks nice right now following a breakout
Bullish

Acuity Brands Cup and Handle Pattern Acuity Brands, Inc (AYI) is an industrial technology company. They provide lighting and building management solutions in North America and internationally. The company was incorporated in 2001 and is headquartered in Atlanta, Georgia. AYI is a component of the S&P 400 Mid Cap Index
Market Cap: 5.9

Head and Shoulders Price is under the neckline.
Price is up a bit, not much, after very good earnings were released.
Neckline slopes up to the 2nd shoulder.
AYI has a history of earnings beat and I will one day go long again on this security. Just not now )o:
Price may climb up a bit more. Just never know.
No rec


See all ideas
Summarizing what the indicators are suggesting.
Neutral
SellBuy
Strong sellStrong buy
Strong sellSellNeutralBuyStrong buy
Neutral
SellBuy
Strong sellStrong buy
Strong sellSellNeutralBuyStrong buy
Neutral
SellBuy
Strong sellStrong buy
Strong sellSellNeutralBuyStrong buy
An aggregate view of professional's ratings.
Neutral
SellBuy
Strong sellStrong buy
Strong sellSellNeutralBuyStrong buy
Neutral
SellBuy
Strong sellStrong buy
Strong sellSellNeutralBuyStrong buy
Neutral
SellBuy
Strong sellStrong buy
Strong sellSellNeutralBuyStrong buy
Displays a symbol's price movements over previous years to identify recurring trends.
A
AYI5070576
ACUITY BRANDS LIGHTING, INC. 2.15% 15-DEC-2030Yield to maturity
4.30%
Maturity date
Dec 15, 2030
See all AQ8 bonds
SDVY
First Trust SMID Cap Rising Dividend Achievers ETF Trust UnitWeight
0.54%
Market value
47.90 M
USD
Explore more ETFs
Frequently Asked Questions
Depending on the exchange, the stock ticker may vary. For instance, on FWB exchange Acuity Inc. stocks are traded under the ticker AQ8.
We've gathered analysts' opinions on Acuity Inc. future price: according to them, AQ8 price has a max estimate of 371.27 EUR and a min estimate of 303.84 EUR. Watch AQ8 chart and read a more detailed Acuity Inc. stock forecast: see what analysts think of Acuity Inc. and suggest that you do with its stocks.
Yes, you can track Acuity Inc. financials in yearly and quarterly reports right on TradingView.
Acuity Inc. is going to release the next earnings report on Jan 14, 2026. Keep track of upcoming events with our Earnings Calendar.
AQ8 earnings for the last quarter are 4.45 EUR per share, whereas the estimation was 4.14 EUR resulting in a 7.58% surprise. The estimated earnings for the next quarter are 3.98 EUR per share. See more details about Acuity Inc. earnings.
Acuity Inc. revenue for the last quarter amounts to 1.03 B EUR, despite the estimated figure of 1.05 B EUR. In the next quarter, revenue is expected to reach 979.43 M EUR.
AQ8 net income for the last quarter is 97.58 M EUR, while the quarter before that showed 86.73 M EUR of net income which accounts for 12.51% change. Track more Acuity Inc. financial stats to get the full picture.
Yes, AQ8 dividends are paid quarterly. The last dividend per share was 0.15 EUR. As of today, Dividend Yield (TTM)% is 0.18%. Tracking Acuity Inc. dividends might help you take more informed decisions.
Acuity Inc. dividend yield was 0.20% in 2025, and payout ratio reached 5.27%. The year before the numbers were 0.23% and 4.32% correspondingly. See high-dividend stocks and find more opportunities for your portfolio.
EBITDA measures a company's operating performance, its growth signifies an improvement in the efficiency of a company. Acuity Inc. EBITDA is 636.25 M EUR, and current EBITDA margin is 16.72%. See more stats in Acuity Inc. financial statements.
Like other stocks, AQ8 shares are traded on stock exchanges, e.g. Nasdaq, Nyse, Euronext, and the easiest way to buy them is through an online stock broker. To do this, you need to open an account and follow a broker's procedures, then start trading. You can trade Acuity Inc. stock right from TradingView charts — choose your broker and connect to your account.