JP MORGAN eyes a potential correction to $210 at least.JP Morgan Chase (JPM) has been trading within a Channel Up since the 2009 bottom of the Housing Crisis. Throughout its course, it has posted 5 strong Bullish Legs, with the current one being the strongest (+221% so far). The result of its strength is the price being exactly at the top (Higher Highs trend-line) of the Channel.
With the 1M RSI extremely overbought and on its highest level since February 2018, the pattern may have reached its upper limit and could be calling for a technical correction. This correction should be in the form of a long-term Bear Cycle (Bearish Leg). Out of the 4 previous Bearish Legs, 3 pulled-back to their 0.618 Fibonacci retracement levels, while 1 to its 0.382 (Fib). That was the only one that found Support on the 1W MA50 (blue trend-line), while the most recent two bottomed on the 1M MA100 (green trend-line).
Note also that 3 of those corrections dropped by around the same %, with the 'weakest' being -41.90% (also the most recent in 2022).
As a result, if JPM has indeed priced its new Top (Channel Up Higher High) currently, a minimum correction to the 0.382 Fib would target $210, while a -41.90% (also minimum) drop would test $190. The latter would also potentially made an ideal contact with the 1M MA100. A 0.618 Fib correction would be at $158, but also below the Channel Up, unless executed very violently, which makes it a less realistic scenario.
---
** Please LIKE 👍, FOLLOW ✅, SHARE 🙌 and COMMENT ✍ if you enjoy this idea! Also share your ideas and charts in the comments section below! This is best way to keep it relevant, support us, keep the content here free and allow the idea to reach as many people as possible. **
---
💸💸💸💸💸💸
👇 👇 👇 👇 👇 👇
Trade ideas

JPMorgan( $JPM) Gains on New Paid Fintech Data DealsJPMorgan Chase & Co. (JPM) has reached a series of landmark agreements requiring fintech companies to pay for access to customer bank-account data, marking a major shift in how financial data is shared across the U.S. banking ecosystem.
For years, data aggregators such as Plaid, Yodlee, Morningstar, and Akoya accessed JPMorgan customer data for free, enabling popular fintech apps to offer budgeting tools, payments, and portfolio tracking. Banks have long argued this model was unfair and risky, raising concerns over data privacy, security, and uncompensated use of bank infrastructure.
JPMorgan spokesperson Drew Pusateri confirmed the new paid arrangements, calling them a step toward a safer and more sustainable open-banking framework. The deals were finalized after weeks of negotiation, with JPMorgan reportedly settling for lower fees than initially proposed. In return, aggregators secured concessions on how data requests are processed and stored.
These agreements come as the CFPB’s updated “open banking” rule continues to reshape the data-sharing landscape. Introduced last year, the rule allows consumers to move financial data freely at no cost, sparking pushback from banks but support from fintechs and crypto-adjacent firms. After industry pressure, regulators began revising the rule earlier this year.
For JPMorgan, the new paid model could generate a fresh revenue stream while tightening oversight on third-party data access. It also positions the bank strategically as demand grows for secure data connectivity across fintech platforms.
Technical Outlook: JPM Eyes Bounce Toward $350
JPM has pulled back from recent highs and is now approaching a major support zone around $280, which previously acted as a breakout level. If the stock retests this area and holds, the structure favors a strong upside continuation.
A rebound from support could send JPM back toward $330 and $350, aligning with the stock external bullish trend.

What a level for JPM- can it bounce from here?I've been waiting for the financials to come in hard like this for a while. Will we have a recession or not is the headline question pushing the markets down. But in reality, before making new highs the markets always pullback. Until they dont, but that would be just one time. is it this time or not is not for me to decide. I just do what i was taught to do- buy pullbacks or short the rallies...

Top 3 Lessons From Trading Since 2017In life you have to know the following:
Learn to keep secrets.
This is very hard especially if you are a leader
i see many many influences make this mistake
Even i myself i have made
this mistake so many times.
Some topics are just to sensitive to share.
Its a sad reality that some people
don't want to know the truth
even if the truth is going to help them.
If you have a business
learn to give your employees more details
The more details you give employees
the more they can help you out.
This also applies to leadership positions.
If you are leader of a group
you have to try your best to give more
details.
Now this does not mean give them
all the details at once
it just means learn to understand
if they did not understand the first time
they did the task you
asked them to do.Be patient with
your employees they are not
perfect give them
time to digest information.
This wont be easy because some employees
dont follow instructions.
Learn to respect monetary limits.
In as much as you want to show off
like every person i know.
You have to hold back and learn to reserve your capital
This is a very powerful lesson that
you can apply
to your trading knowledge as well.
Capital reserving is part of risk management
Look at the MACD indicator on the daily chart
the histogram is Dark green
this is the highest probability of trading that you
could wish for.Of course seeing
such a trade doesn't mean you will
always find good trades
The MACD Histogram is
my favourite indicator
learn more about it
Rocket boost this content to learn more.
Trade safe.
Disclaimer: Trading is risky learn risk management and profit
taking strategies.
Please use a simulation trading account
before oyu trade with real money.

The #1 Reason For The Butter Knife Strategy.Its been a while since i used the fibnoccai
indicator.
Even as I place this indicator into action
I kept doubting my analysis.
But because I have been trading using the simulation
trading account for a long time.
I can still remember the trades that went well
and the ones that didn't.
Using the Fibonacci is a crazy
way of seeing the markets
but once you master it.
It will reveal so much more about
the markets that you didn't know
about.
I call this the "butter knife strategy."
because once the price crosses that
fibonacci line
Then you know something is
melting in the background.
So I shifted the chart to the 4hour
then I checked the trend
using the rocket booster strategy
It was like I was riding a bicycle and
working with my experience
and instincts.
Trading is a rollercoaster and you
need someone who really understands
what they are doing.
I have really put my life on the line
to learn this stuff, believing
that one day it will deliver me
maybe I was right, maybe I was wrong.
but I will always take profit
and take trades.
Courage is acting in the face of fear
not without it.
Remember that.
Rocket boost this content to learn more.
Disclaimer: Trading is risky
Please use a simulation trading account
Before you trade with real money.

JPM - Potential move to ATH and beyond=======
Volume
=======
- neutral
==========
Price Action
==========
- Uptrend line intact
- Supported at $290 region
=================
Technical Indicators
=================
- Ichimoku
>>> price above cloud
>>> Green kumo contracting slightly
>>> Tenken - Above clouds
>>> Kijun - Above clouds
>>> Chiku - Above clouds & pointing up
=========
Oscillators
=========
- MACD turning bullish
- DMI turning bullish
- StochRSI, turning bullish, crossed and entered band
=========
Conclusion
=========
- short to long term breakout swing
- price may reverse at current level, to enter spot or wait for pullback at entry 2.
- Entry and exits depends on your time horizon and risk management.
=========
Positions
=========
Entry 1 - $300
Entry 2 - $295
Stop - $288
Exit 1 - $307
Exit 2 - $317
Exit 3 - $333
Exit 4 - $345
Exit 5 - $360

The Fed Eases Its Stress Tests,Giving WallStreet Some BreathThe Fed Eases Its Stress Tests, Giving Wall Street Some Breathing Room
By Ion Jauregui – Analyst at ActivTrades
The U.S. Federal Reserve (Fed) has announced a major reform to its banking stress tests — the resilience checks that, since the 2008 financial crisis, have served as the key barometer of the U.S. financial system’s stability.
The new regulation aims to make the exams more transparent and predictable, a change that many on Wall Street view as a regulatory relief. For the first time, the Fed will publish the internal models used in these tests and open a public consultation period to receive feedback from financial institutions before implementation.
The move has been welcomed by the Bank Policy Institute and the American Bankers Association, two of the sector’s main lobbying groups, which had even filed a lawsuit against the central bank over the lack of clarity in its models. With this reform, the legal action has been suspended, and industry representatives have hailed the decision as “a positive step for economic growth.”
However, not everyone within the Fed shares the optimism. Governor Michael Barr, who oversees supervision, warned that the new policy “could weaken the effectiveness of the tests,” allowing banks to adjust their balance sheets to pass adverse scenarios without truly strengthening their solvency.
JPMorgan Chase, the Main Beneficiary
The largest U.S. bank, JPMorgan Chase, could emerge as one of the biggest winners under this new framework. With assets exceeding $4.5 trillion and steady profits driven by its investment banking and trading divisions, the institution led by Jamie Dimon has demonstrated strength well above the sector average.
With the early release of the stress test models, JPMorgan will be able to optimize its capital more efficiently and adjust its dividend and share buyback strategy without the risk of regulatory surprises. In its latest quarterly results, the bank already announced an 8% increase in its buyback program and an improvement in its CET1 capital ratio, reinforcing its leadership position.
Still, some analysts warn that overly relaxed testing could weaken financial safety buffers at a time when corporate credit and public debt are rising sharply.
Technical Analysis (Ticker AT: JPM)
JPMorgan Chase & Co. shares closed on Friday at $300.44, posting a positive session after rebounding from a support area that coincides with the consolidation range established at the end of the previous semester.
Since late June, the stock has traded within a lateral range between this year’s all-time highs ($316.47) and the initial upward impulse zone near $278.95, with a point of control (highest traded volume level) around $290.03.
In the short term, the price needs to break above the 50- and 100-period moving averages to confirm a new bullish leg and resume its move toward new highs, setting a technical target around $350 per share.
If the $278.95 support fails to hold, a pullback toward the previous area around $266.93 could follow. The RSI stands at 47.75%, within the neutral zone, reflecting balanced buying and selling pressure. Meanwhile, the MACD remains in negative territory, though its histogram shows signs of recovery — a potential early indication of an upward crossover.
Finally, the ActivTrades US Market Pulse indicates a neutral risk environment, suggesting that the market has yet to define a clear short-term direction.
The Debate Is On: More Transparency or More Risk?
One thing is certain — with this reform, the Fed has opened a new chapter in the relationship between regulators and banks, one that Wall Street is watching with evident satisfaction.
*******************************************************************************************
The information provided does not constitute investment research. The material has not been prepared in accordance with the legal requirements designed to promote the independence of investment research and such should be considered a marketing communication.
All information has been prepared by ActivTrades ("AT"). The information does not contain a record of AT's prices, or an offer of or solicitation for a transaction in any financial instrument. No representation or warranty is given as to the accuracy or completeness of this information.
Any material provided does not have regard to the specific investment objective and financial situation of any person who may receive it. Past performance and forecasting are not a synonym of a reliable indicator of future performance. AT provides an execution-only service. Consequently, any person acting on the information provided does so at their own risk. Political risk is unpredictable. Central bank actions can vary. Platform tools do not guarantee success.

JPMorgan Chase — rebound after earnings?After posting stronger-than-expected Q3 results ($5.07 EPS vs $4.37 YoY), NYSE:JPM is holding the lower boundary of its ascending channel near $303.
Technical setup:
Support: $300 – 303 (channel bottom + psychological level)
Target: $311 – 312 (+ ≈ 3%)
MACD is turning upward — early sign of a potential bullish reversal
Price action shows strong demand recovery right after the earnings dip
If momentum holds, the next short-term leg could retest the mid-channel zone (~$312) before any pause.

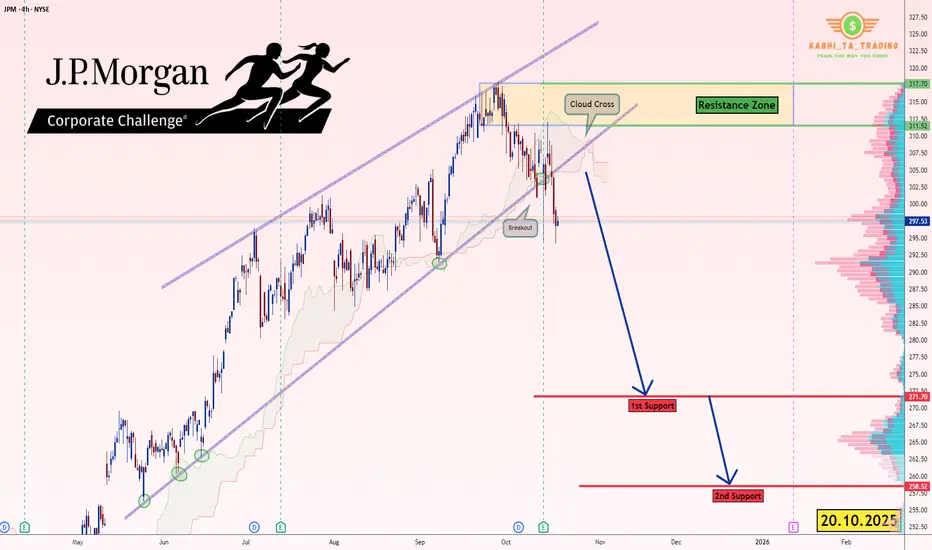
JP Morgan (JPM) - H4 - Breakout Pattern (20.10.2025)📊 Setup Overview:
J.P. Morgan ( NYSE:JPM ), presenting a bearish outlook based on the price action.
📈 Trade Plan:
Bias: Bearish below $310
1st Target: $272 ✅
2nd Target: $258.52 🎯
Resistance Zone: $311 – $318
🧩 Technical Confluence:
1.Price Breaks the Wedge Pattern.
2.Trendline break confirming reversal
3.Ichimoku Cloud crossover indicating bearish momentum
🏦 Key Fundamentals & Recent Performance
1.JPM reported third-quarter 2025 adjusted revenue of ~$47.12 billion, topping estimates.
2.Net interest income (NII) rose only ~2% YoY in Q3 to $24.1 billion, and the bank raised its 2025 NII outlook to ~$95.8 billion.
3.JPM itself flags major risks: ongoing geopolitical uncertainty, elevated asset valuations, potential credit stress and slower growth.
#JPM #JPMStock #NASDAQ #USStocks #TechnicalAnalysis #wedgePattern #BearishSetup #PriceAction #EarningsWatch #StockMarket #SwingTrading #TradingView #Ichimoku #CloudCrossover #ChartsDontLie #Kabhi_TA_Trading
⚠️ Disclaimer:
This analysis is for educational purposes only and not investment advice. Always perform your own due diligence and manage risk appropriately before taking any position.
💬 Support the Analysis:
If this chart helped you — LIKE 👍, COMMENT 💬 your thoughts, and FOLLOW ✅ for more daily stock & forex chart breakdowns from Kabhi_TA_Trading!
JPM is on the radarThe JP Morgan stock is testing the dynamic support area, moving inside of the 14-day swing from the peak of 29-th of September, 2025. The downside move may reverse off the support zone, as the swing is already mature, and according to statistical studies, directional moves rarely last for more than 16 days for this instrument.
If volatility in the market would bounce back and the relief in rethorics from Donald Trump will improve the sentiment, markets may exhale this week, with a focus on the financial sector, and strong names such as JP Morgan.
The expected target area may be around $309-310.
Don't forget - this is just the idea, always do your own research and never forget to manage your risk!

JPM watch $310-315: Major Resistance at ATH could give a DIPJPM has been flying high amongst the big banks.
Just hit a major resistance zone $310.91-315.24
Looking for a DIP, perhaps to green zone below.
.
Previous Analysis that caught a PERFECT DIP buy:
Hit BOOST and FOLLOW for more such PRECISE and TIMELY charts.
=========================================================
.

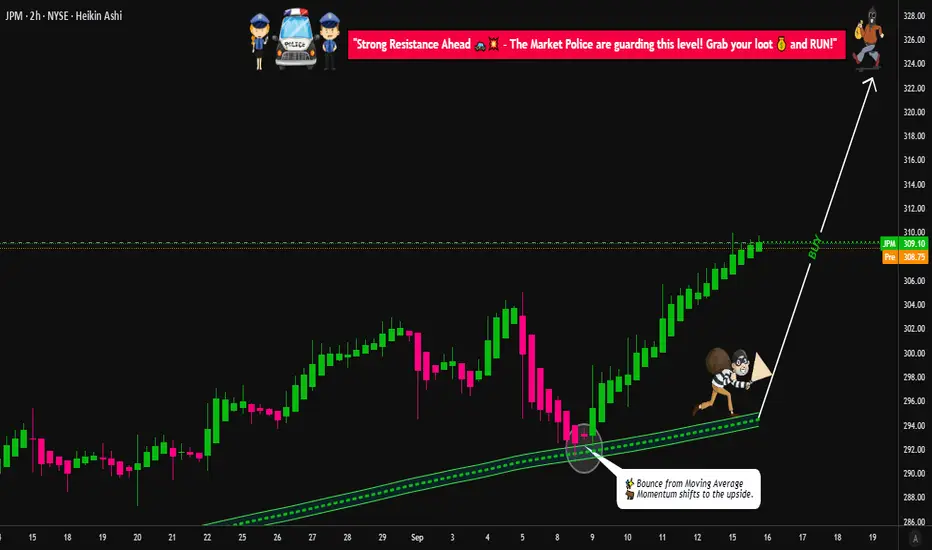
JPM Swing Plan → Layered Entries & Profit Targets Mapped😂 JPMorgan Chase (JPM) Swing/Day Trade: The Great Heist Blueprint 🤑💰
🚀 Asset: JPMorgan Chase & Co. ( NYSE:JPM )🎯 Market Profit Realization Plan: Swing/Day Trade📈 Outlook: Bullish vibes confirmed! 💪
📜 The Setup: Why JPM is Ready to Pop! 🎉
Bullish Confirmation: The chart is screaming BULLISH! 📈 A clean pullback to the moving average shows institutional big dogs 🐶 holding strong. This isn’t just a random pump — it’s a calculated move!
Market Context: JPM’s price action shows resilience, with buyers stepping in at key levels. The moving average is acting like a trusty springboard for the next leg up. 🏀
🕵️♂️ The Thief Strategy: Layered Entries for Max Gains! 🏦
Dear Ladies & Gentlemen, Thief OGs 😎, here’s how we pull off this heist with style:
Entry Plan: Use a layering strategy with multiple limit orders to stack your position like a pro. 🧱
Suggested buy limit layers: $302, $304, $306, $308, $310.
Pro Tip: Feel free to add more layers based on your risk appetite and account size! More layers = more flexibility. 🥞
New traders? You can enter at any price level within this range — the trend is your friend! 🤝
Why Layering?: This strategy lets you scale into the trade, reducing risk while catching the move. It’s like sneaking into the vault with multiple keys! 🔑
🛑 Stop Loss: Protect Your Loot! 💼
Thief SL: Set your stop loss at $298, just below the breakout level to dodge any fakeouts. 🕳️
Note: Dear Thief OGs, this SL is a suggestion. Adjust it based on your strategy and risk tolerance. You’re the mastermind of your own heist! 🧠
Risk Management: Never risk more than you’re willing to lose. Protect your hard-earned cash! 💸
🎯 Target: Cash Out Before the Trap! 🏃♂️
Profit Target: Aim for $325, where we expect strong resistance and potential overbought conditions. 📉
Why $325?: Historical resistance + overbought signals = a classic trap zone. Cash out your profits before the market pulls a fast one! 🪤
Note: Dear Thief OGs, this TP is a guideline. Take profits at your own discretion — secure the bag when you feel it’s right! 💰
🔗 Related Pairs to Watch (with $ Correlations) 👀
Keep an eye on these financial sector buddies to gauge market sentiment:
NYSE:BAC (Bank of America): Moves in tandem with JPM as a fellow banking giant. If BAC is pumping, it’s a good sign for JPM! 📈
Correlation: High positive correlation (~0.8). Strong financial sector momentum often lifts both.
NYSE:WFC (Wells Fargo): Another banking heavyweight. Watch for similar price action to confirm sector strength. 🏦
Correlation: Moderate positive correlation (~0.7). WFC’s moves can signal broader banking trends.
AMEX:XLF (Financial Select Sector SPDR Fund): Tracks the financial sector as a whole. If XLF is bullish, it’s a tailwind for JPM! 🌬️
Correlation: Strong positive correlation (~0.85). XLF’s direction often sets the tone for JPM’s price action.
Key Point: Monitor these pairs for confirmation of JPM’s bullish move. If they’re lagging, proceed with caution — the heist might need a backup plan! 🕵️♀️
✨ If you find value in my analysis, a 👍 and 🚀 boost is much appreciated — it helps me share more setups with the community!
#TradingView #JPM #StockMarket #SwingTrading #DayTrading #TechnicalAnalysis #ThiefStrategy #Bullish
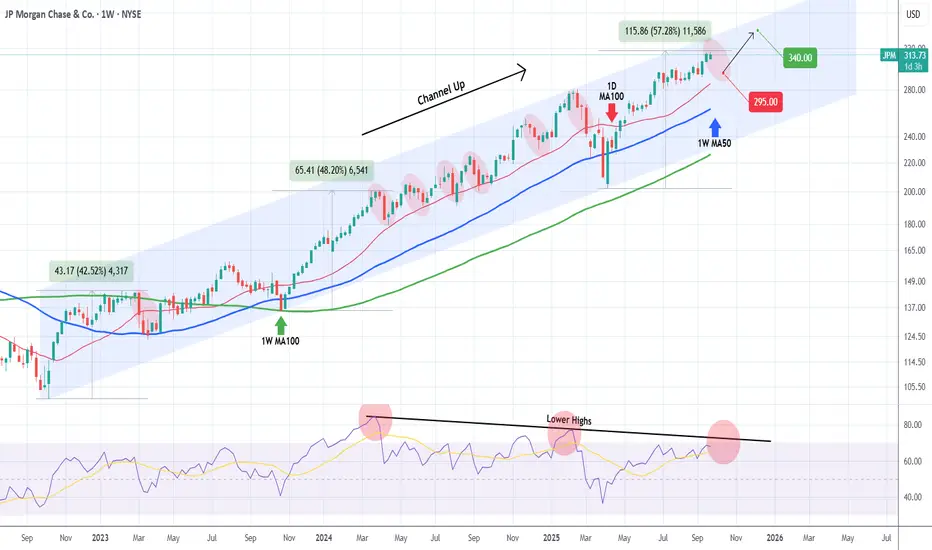
JP MORGAN In need of a relief correction.Last time we took a look at JP Morgan Chase (JPM) was 5 months ago (April 28, see chart below), issuing a strong long-term buy signal, which 2 weeks ago hit our $310 Target:
This time, having already completed a +57.28% rise from the April 07 bottom (Higher Low for the 3-year Channel Up), we expect a medium-term pull-back towards its 1D MA100 (red trend-line), which has systematically been its most common buy entry. The 1W MA50 (blue trend-line) - 1W MA100 (green trend-line) Zone has been the ultimate buy range but since March 2023 has only emerged 3 times.
As a result, given the trajectory of the 1D MA100, we expect the stock to pull-back to $295.00 and if it holds, rebound for an end-of-year rally to $340.00.
-------------------------------------------------------------------------------
** Please LIKE 👍, FOLLOW ✅, SHARE 🙌 and COMMENT ✍ if you enjoy this idea! Also share your ideas and charts in the comments section below! This is best way to keep it relevant, support us, keep the content here free and allow the idea to reach as many people as possible. **
-------------------------------------------------------------------------------
💸💸💸💸💸💸
👇 👇 👇 👇 👇 👇
JPM + $500B Capital Forecast + Banks to Profit from Tar NYSE:JPM , 4H chart
ALVO13 Insight: A strong mix of technical structure and positive fundamentals.Technical Setup (Elliott Waves):
The chart suggests a potential start of wave (5) after a completed correction (4).
Stochastic is in the oversold zone, and $280 support is holding — a key signal for a possible reversal.
Key Levels:
• Support: $280.00–280.47
• Resistance: $295.73–298.02
• Target (Wave 5): $315.67
Fundamental Factors:
JPMorgan forecasts up to $500B in new equity inflows from retail and institutional investors during H2 2025. This could lift the market, especially financials.
Banks are likely to benefit from upcoming trade tariffs — via increased demand for hedging, transaction fees, and advisory services.
PM remains one of the most solid U.S. banks, with strong dividend policies and excellent return on equity (ROE).
ALVO13 Trade Idea:
• Entry: $282–286 (confirmation-based)
• Stop-loss: below $280
• Take-profit: $315+
• Risk/Reward: 3:1
Break below $280 invalidates the bullish wave 5 scenario.

BULLISH JPMJPM has broken out of an ascending triangle, signalling bullish momentum. The rally is supported by strong financial performance, including growth in investment banking fees, and positive analyst sentiment, suggesting further gains

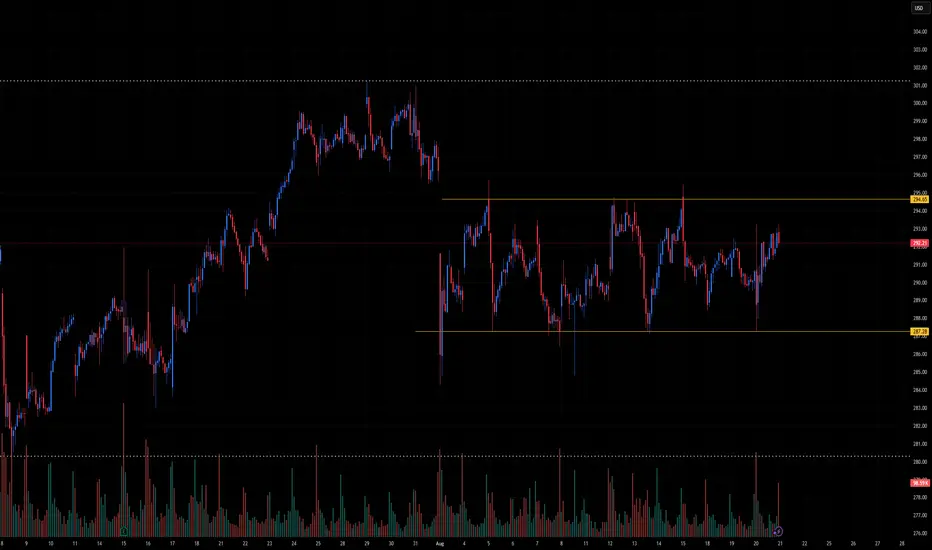
JPM Technical Outlook – Range-Bound Between Support & Resistance🏦 JPM Technical Outlook – Range-Bound Between Support & Resistance
Ticker: JPM (JPMorgan Chase & Co.)
Timeframe: 30-minute candles
🔍 Current Setup
JPM has been trading inside a horizontal range for several weeks, with price repeatedly rejecting both resistance and support.
Range Resistance: ~295.00
Range Support: ~287.20
Current price: ~292.20, sitting near the mid-range.
This structure signals consolidation after prior gains, with traders waiting for a breakout to set the next directional move.
📊 Breakout Levels
🚀 Upside (Bullish Scenario)
Trigger: Break and close above 295.00.
Intermediate Targets:
298.00–300.00 → Round-number psychological resistance.
302.00 → Prior high.
Measured Move Target: ~303–305 (range height projection).
🔻 Downside (Bearish Scenario)
Trigger: Break and close below 287.20.
Intermediate Supports:
285.00 → Minor support.
281.50–282.00 → Previous demand zone.
Measured Move Target: ~279.00 (range height projection).
📈 Volume Analysis
Volume has been declining during the chop, consistent with range-bound trading.
Expect volume expansion on breakout, confirming the move’s legitimacy.
⚖️ Probability Bias
JPM remains neutral until it leaves the 287–295 range.
A break above 295 would favor bulls, targeting 300+.
A drop below 287 would favor bears, aiming for 282 → 279.
✅ Takeaway
JPM is stuck in a tight consolidation range:
Bullish Break > 295: Targets 298 → 300 → 303–305
Bearish Break < 287: Targets 285 → 282 → 279
Until then, expect continued sideways chop between the range boundaries.
$JPM price targetNYSE:JPM price target nearly 19% upside.
(JPMorgan Chase & Co. is an American multinational finance corporation headquartered in New York City and incorporated in Delaware. It is the largest bank in the United States, and the world's largest bank by market capitalization as of 2024.)


#JPM - Aug 2025Date: 16-08-2025
JPM - Current Price: 291.46
Pivot Point: 291 Support: 286 Resistance: 297
Upside Targets:
--------------------------------
| Target | Price |
---------------------------------
| 🎯 Target 1 | 303 |
| 🎯 Target 2 | 308 |
| 🎯 Target 3 | 315 |
| 🎯 Target 4 | 321 |
Downside Targets:
-------------------------------- -
| Target | Price |
----------------------------------
| 🎯 Target 1 | 280 |
| 🎯 Target 2 | 275 |
| 🎯 Target 3 | 268 |
| 🎯 Target 4 | 262 |
#TradingView #Nifty #BankNifty #DJI #NDQ #SENSEX #DAX #USOIL #GOLD #SILVER
#BHEL #HUDCO #LT #LTF #ABB #DIXON #SIEMENS #BALKRISIND #MRF #DIVISLAB
#MARUTI #HAL #SHREECEM #JSWSTEEL #MPHASIS #NATIONALUM #BALRAMCHIN #TRIVENI
#USDINR #EURUSD #USDJPY #NIFTY_MID_SELECT #CNXFINANCE
#SOLANA #ETHEREUM #BTCUSD #MATICUSDT #XRPUSDT
#Crypto #Bitcoin #BTC #CryptoTA #TradingView #PivotPoints #SupportResistance

JPM LongJPM is now net long on the regression break.
I am going to take this trade with a EA with limited risk.

JPMorgan Chase (NYSE) (W) - Quiet Base, Bullish BiasPrice / Momentum : Weekly close $296.24 (+1.98%) — holding just above the prior breakout area. Market structure = higher highs / higher lows since the spring low.
Volume : Weekly volume has eased after the earlier surge (no fresh big-volume breakout). That shows consolidation/rotation rather than distribution — a neutral-to-bullish picture that needs a renewed volume pickup to validate acceleration.
Structure / Pattern : Rounded bottom leading into a breakout and now a tight range/consolidation above the breakout zone — healthy price action after an impulse move. The red curved line (smoothing/short MA) is supporting price.
Key levels:
Support / invalidation: $279 (range low / stop area).
Immediate resistance / near trigger: ~$300–$305.
Progressive targets on extension: $312 → $328 → $345 → $361 (chart projections).
Bias & Trade idea: Bias bullish while > $279. A tactical long can be considered on a clean hold above $279 or on a breakout with volume above ~$300–305. Use $275–$279 as a protective stop; scale targets at the levels above.
⚠️ Disclaimer : This chart is for educational purposes only.
Regulatory Note : We are an independent development team. Our services are not registered or licensed by any regulatory body in India, the U.S., the U.K., or any global financial authority. Please consult a licensed advisor before making trading decisions.

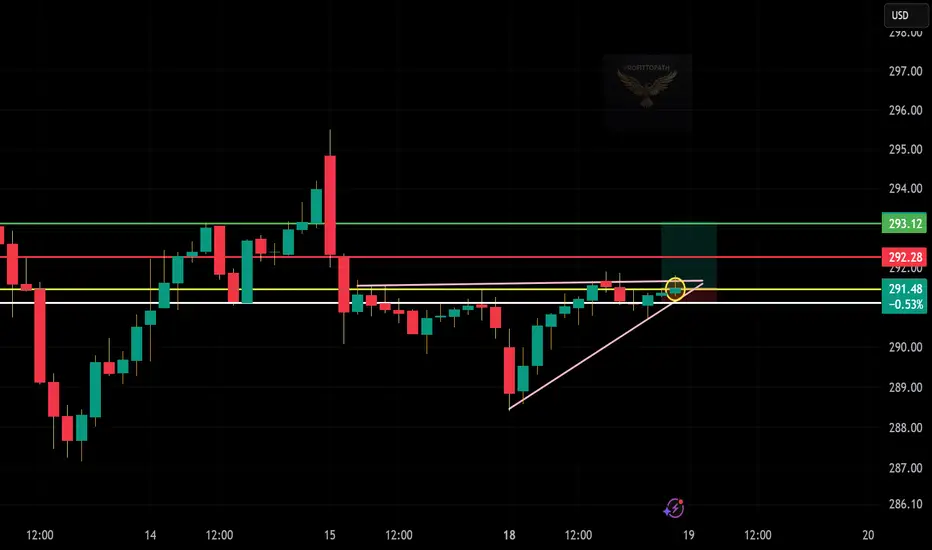
JPM Technical Outlook (30m Chart)📈
🔹 Current Price: $291.48
📉 Support Zone: $291.00 – $291.50
📊 Resistance Levels:
🔺 $292.28 (key breakout)
🎯 $293.12 (target)
📝 Trade Setup
✅ Entry: Near $291.50 (breakout)
🛑 Stop-loss: Below $291.00
🎯 Target: $293.12
⚖️ Risk/Reward: ~1:2 (strong setup)
🔎 Takeaway
🟢 Bullish bias above trendline – breakout could fuel upside.
🔴 Bearish risk if $291 fails → could drop toward $289.50.
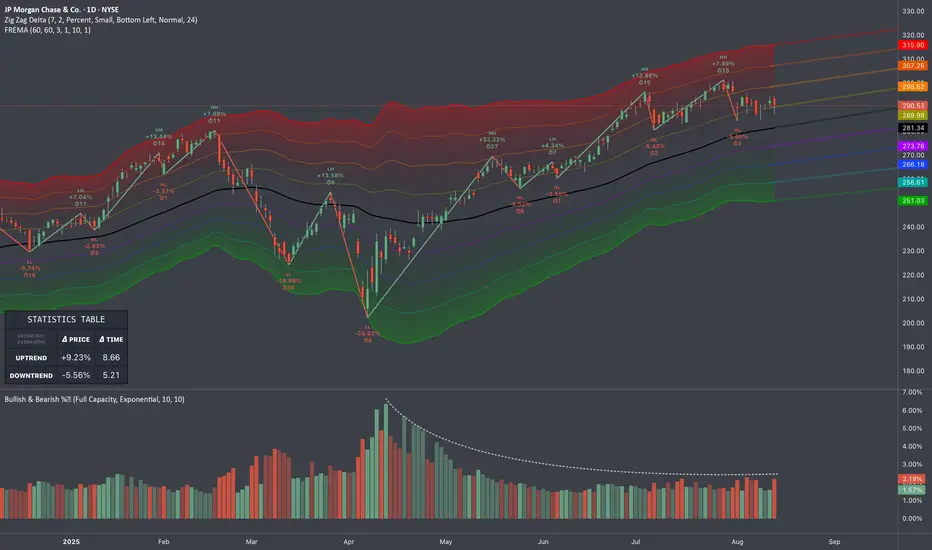
JPM: Mean Reversion (FREMA)🏛️ Research Notes
Already looks mature to me
Conditional averaging of percentage change shows weakening bullish momentum
Testing FREMA as an indicator for mean reversion, where I will look for deviations from the average and anticipate a price movement back towards that mean. The bands were extended to cover the a distorted outcome.