$CMCSA - Comcast Currently Trading at a Decade LowComcast investors have taken a beating over the last decade. At the moment the stock appears significantly undervalued compared to both its historical averages and industry peers.
Currently trading around 4.5× earnings and 4× EV/EBITDA, Comcast’s valuation is less than half of typical media and telecom sector multiples, which generally range between 7×–10× EV/EBITDA and 12×–16× P/E. This compression suggests the market is overly discounting risks such as cord-cutting, streaming competition, and slowing cable growth. However, Comcast’s fundamentals remain solid — it continues to generate robust free cash flow, supports approximately a 5% dividend yield, and has diversified revenue streams across broadband, media, streaming, and theme parks.
Several discounted cash flow (DCF) analyses place Comcast’s intrinsic value between $60–$70 per share, implying 100–140% upside from its current price near $27. A safer bet would be around the $35-$40 range.
In short, Comcast’s current market price reflects excessive pessimism, offering a wide margin of safety for patient investors.
Disclaimer:
I do not provide personal investment advice and I am not a qualified licensed investment advisor. I am an amateur investor.
All information found here, including any ideas, opinions, views, predictions, forecasts, commentaries, suggestions, or stock picks, expressed or implied herein, are for informational, entertainment or educational purposes only and should not be construed as personal investment advice. While the information provided is believed to be accurate, it may include errors or inaccuracies. I will not and cannot be held liable for any actions you take as a result of anything you read here.
Conduct your own due diligence, or consult a licensed financial advisor or broker before making any and all investment decisions. Any investments, trades, speculations, or decisions made on the basis of any information found on here, expressed or implied herein, are committed at your own risk, financial or otherwise.
Feel free to give us a follow and shoot us a like for more analysis updates
Comcast Corporation Class A
No trades
Trade ideas
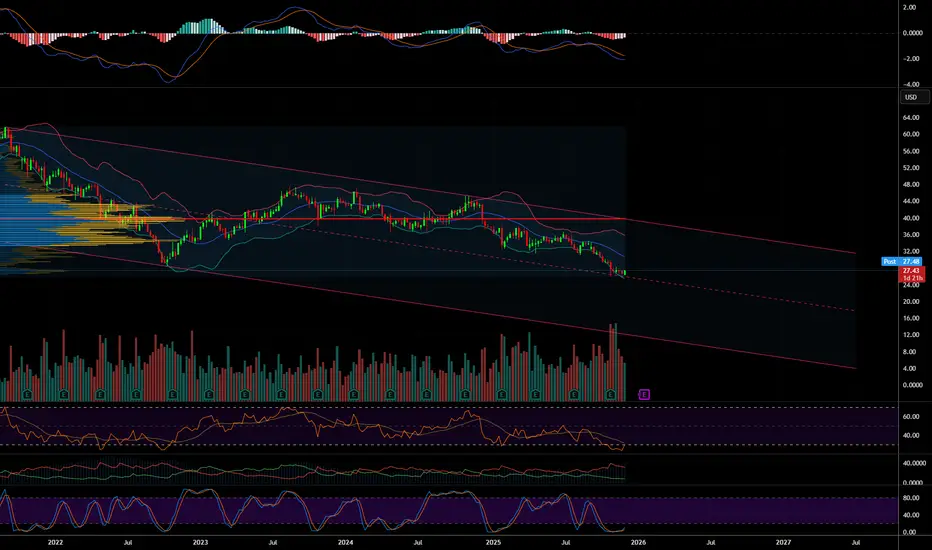
CMCSA still bearish...CMCSA formed a bearish pendant pattern in the D time frame, if it can break out of this trend, we might see a good run to the upside. Rejected a couple of times on the 28 line!

Comcast Wave Analysis – 8 December 2025
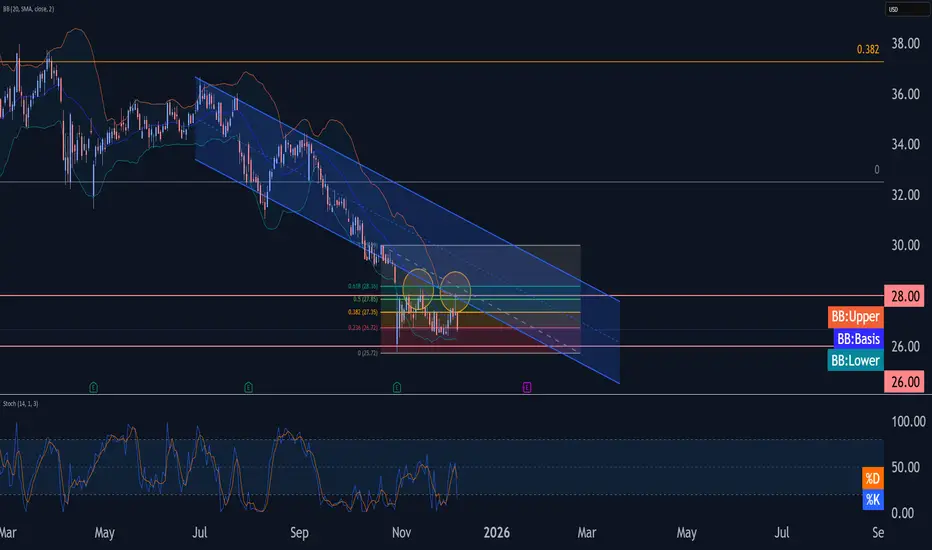
- Comcast reversed from key resistance level 28.00
- Likely to fall to support level 26.00
Comcast recently reversed from the resistance zone between the key resistance level 28.00 (which has been reversing the price from November), lower trendline of the down channel from July and the upper daily Bollinger Band.
The downward reversal from this resistance zone created the daily Shooting Star which stopped the previous short-term correction wave ii.
Given the overriding daily downtrend, Comcast can be expected to fall further to the next support level 26.00 (which stopped earlier waves iii and i).
Long Comcast CMCSATrading Fam,
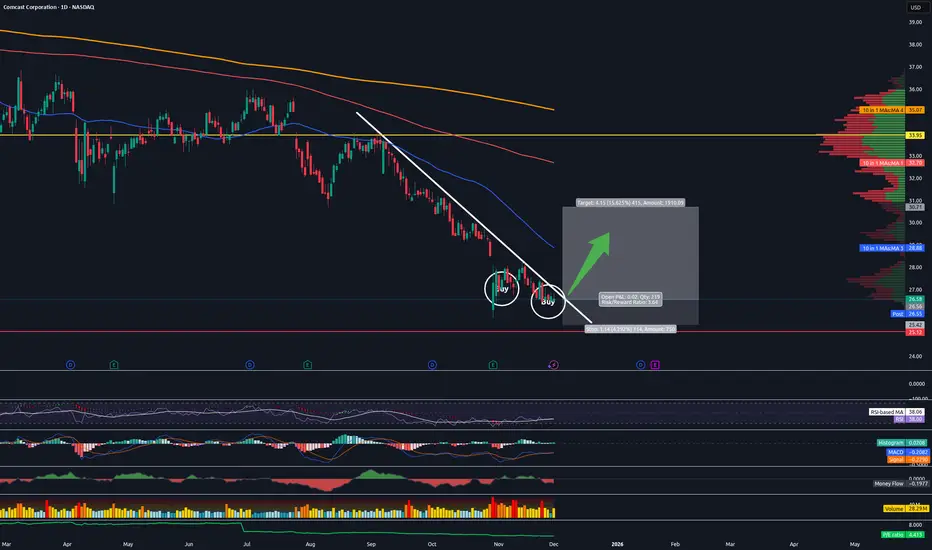
Not getting many long signals from my indicator these days. When I do, I pay attention. In this case, I've received two long signals on the same stock. Though, I am currently only short (and in the profit on both: TSLA and PLTR), I've decided to enter here long on Comcast. My indicator rarely fails me when it signals on these high MC/high vol. stocks. So, I will listen.
On the technical side, I am seeing a nice trendline, which, if my indicator is correct, we will break to the upside on soon. Should at least fill that recent gap down and hit the 50 SMA fairly quickly. It may be worth taking some profit at that point and raising stops to break even. I expect we'll hit our heads on that 50 SMA and draw back for a day or two at least while we wrestle around with it for a little. And then, should we break to the upside, we'll move quick. My final target may even be set too low at this point. I am trading cautiously. But we could tag the underside of that 200 SMA in red before buying subsides to some degree. I'll probably leave a little on the table for this scenario while trailing my stops up as I grab profit.
Conservative target is around $30 with a SL at around $25.50 for a 2:1 rrr. Setting a final target of that 200 SMA would increase your rrr to 5:1 with a potential profit of 23%.
✌️Stew
CMCSA has broken the heads and shouldersCMCSA has broken down from the head and shoulders pattern. This is a bearish technical sign. This chart pattern is quite large and suggests significant weakness ahead.

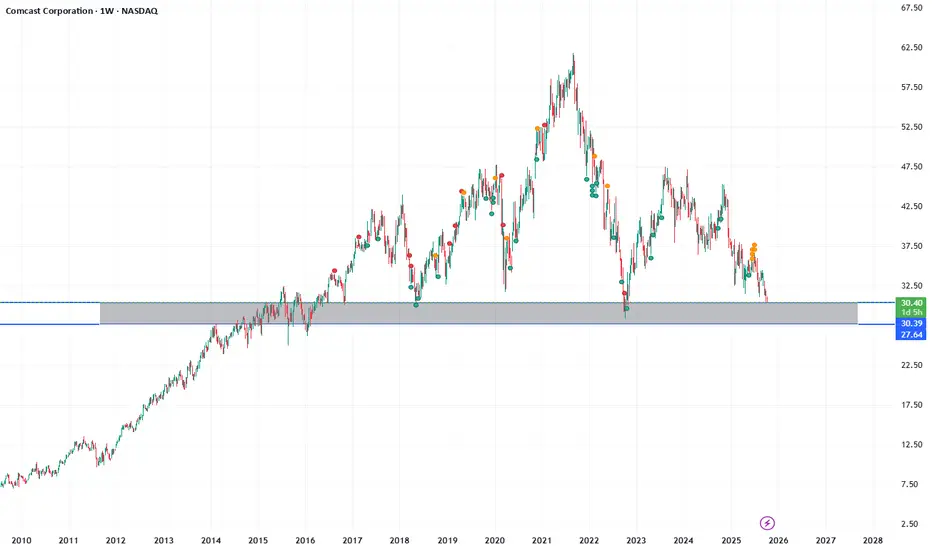
CMCSA multi year low and good supportI think with current valuation CMCSA looks very cheap and after founding solid support should show real performance
HOLD Long term
good dividend
i am not financial advisor
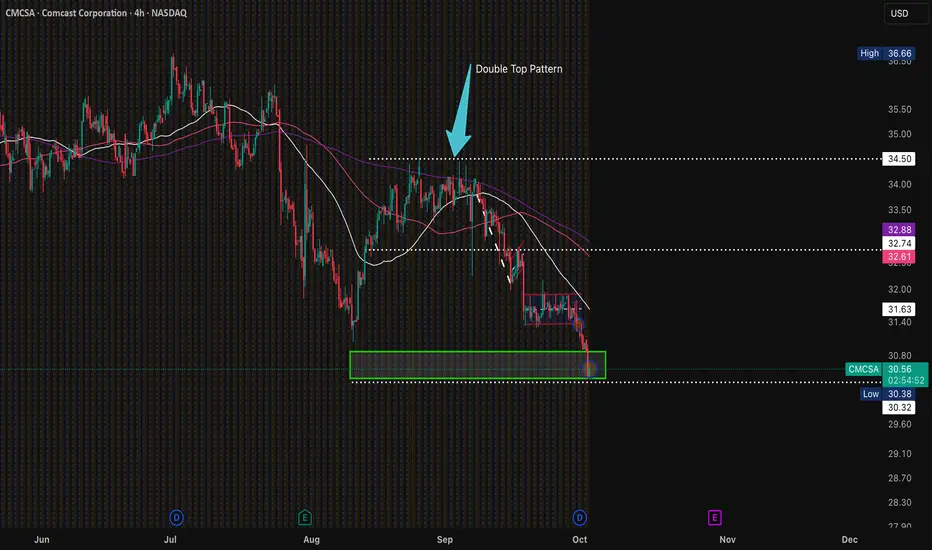
Update on $CMCSA Head & Shoulders on Monthly confirmedThe double top on the 4hr chart helped play out the head and shoulders pattern on the monthly chart. This gives bearish sentiment with the neckline quite obvious here...

$CMCSA looks to make a rebound As we enter the 4Q it is looking as though buyers interest may start picking up soon. Double top pattern is completing. Coupled with Comcast's undervalued metrics (low P/E and favorable value scores cited by analysts) and a solid dividend yield, this technical failure to decline can set the stage for a sustained rebound, as renewed buying interest drives the stock out of its recent downtrend.
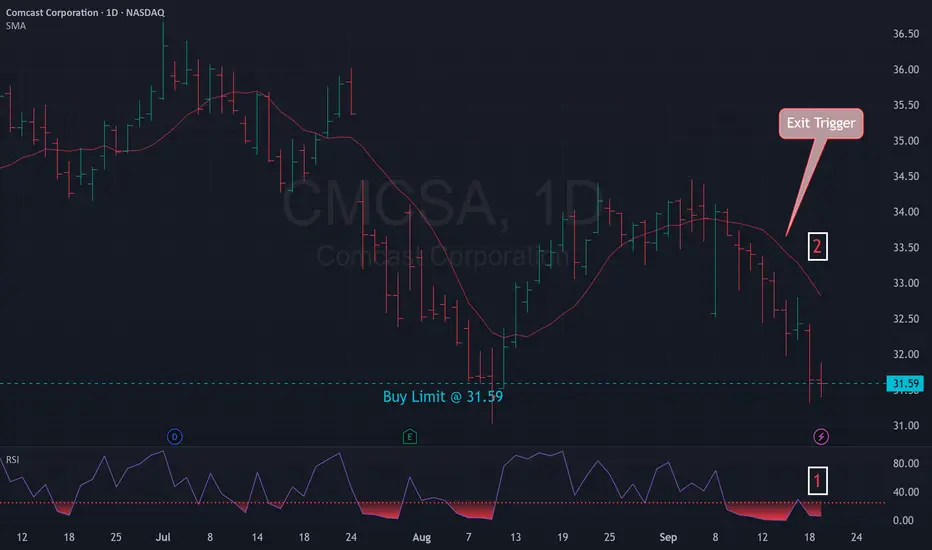
Mean Reversion Setup: CMCSA1. RSI in oversold region
2. Price likely to rebound back the the mean
Trade Rules:
Entry Trigger - RSI has cross below oversold region, enter limit buy at close price
Exit Trigger - Close at market when close price cross above exit trigger (Red Line)
Comcast will go lower the next few years. Sell now and Buy laterComcast has a huge! I mean huge fib level to test on the high time frame charts. This level will act as a magnet lower. We will have up and downs until we get this low (if we do). If it gets this low, It is a huge buy for me. I will need to wait a very long time though, because this is going to take a while to drop this low if it ever does. I love making these charts way in advance.
I always get messages from mods to explain my trades. I often cant. It comes from almost 10 years of looking at charts. I know trend, levels and my proprietary fib pulls. My record shows for itself. I don't believe anyone should ever copy trade me. All my trades are long term holds and heat is expected in the near term.

Comcast Wave Analysis – 19 August 2025- Comcast reversed from support zone
- Likely to rise to resistance level 35.35
Comcast recently reversed up from the support zone located between the support level 31.40 (former low of wave (A) from April) and the lower daily Bollinger Band.
The upward reversal from this support zone started the active impulse wave C of the intermediate wave (B) from April.
Comcast can be expected to rise to the next resistance level 35.35 (target price for the completion of the active impulse wave i).

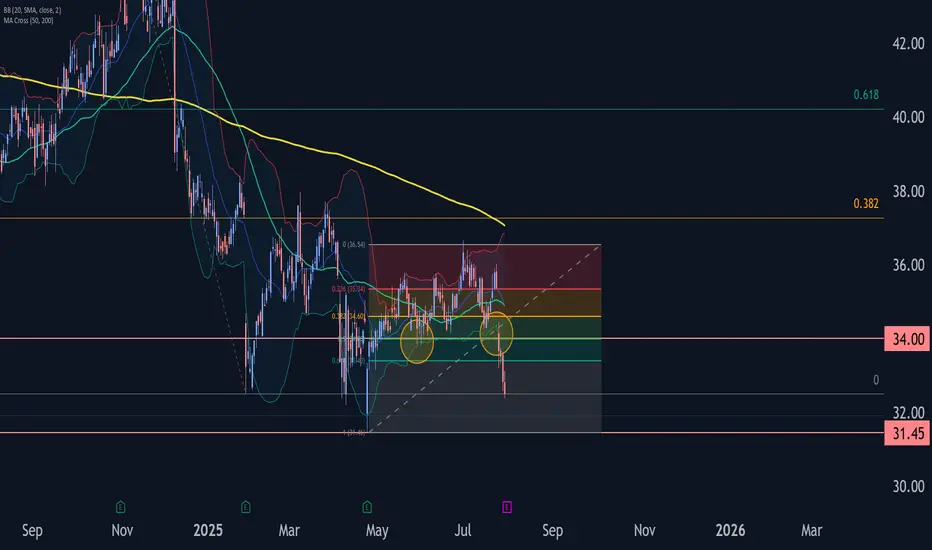
Comcast Wave Analysis – 30 July 2025- Comcast broke the support zone
- Likely fall to support level 31.45
Comcast recently broke the support zone located between the support level 34.00 (which has been reversing the price from the start of May) and the 50% Fibonacci correction of the upward wave A from April.
The breakout of this support zone accelerated the active impulse wave c, which belongs to wave B from June.
Given the clear daily downtrend, Comcast can be expected to fall further to the next support level 31.45 (former multi-month low from April).
BUY NOW!! Best time in 10 yearsComm Services and Real Estate have the cheapest Shiller PEs right now in the whole market. CMCSA has a Shiller PE of 10.28 according to GuruFocus, almost at its lowest in 10 years, potentially indicating that this is one of the best times to buy, but lets look at some other factors as well.
The FWD GAAP PE is 9.29, approx 38% below the sector and CMCSA's own 5 year average.
Comcast has underperformed over the last year, but it also has increased revenue, profit, and net income YoY 6 out of the previous 10 years, soon to be 7, or 3 years consecutive, so I'm not that worried about the growth aspect.
IRT Tech Analysis, SP is currently sitting above major support going back to 2016. Looking at the weekly chart and RSI, you can see that SP just hit the oversold boundary at 30. You can see what happened the last 3 times the SP reached this level. On average, the SP increased by 64% by the 1 year mark over the last 3 times.
Using DCF based EPS w/o NRI and a discount rate of 11%, Comcast is fairly valued at $70, implying a 51% margin of safety (yum) based on high predictability (most important factor for DCF modeling IMO)
DCF based on FCF implies a 27% margin of safety and adjusted for dividend, 49%.

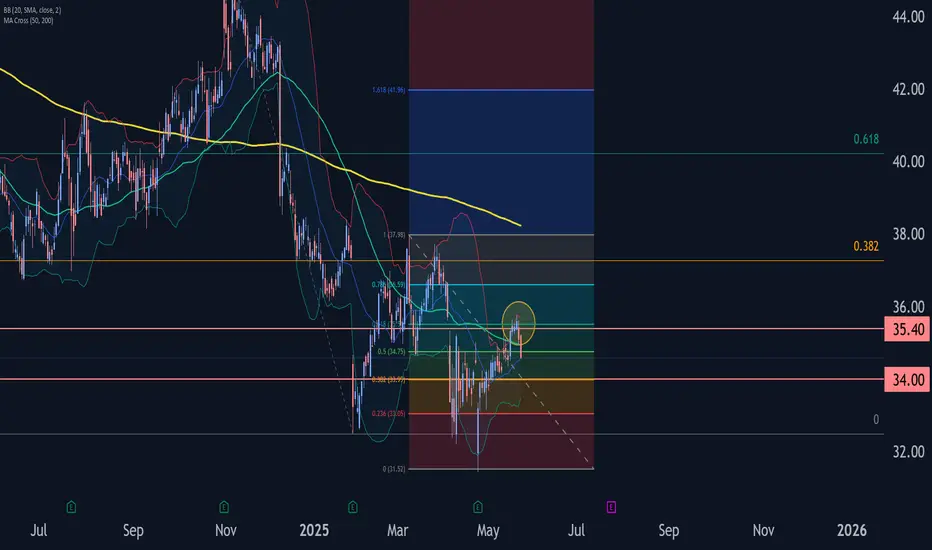
Comcast Wave Analysis – 22 May 2025
- Comcast reversed from resistance area
- Likely to fall to support level 34.00
Comcast recently reversed down from the resistance area between the resistance level 35.40, upper daily Bollinger Band and the 61.8% Fibonacci correction of the downward impulse from November.
The downward reversal from the resistance zone started the active impulse wave 3, which today broke the daily up channel from April.
Given the clear daily downtrend, Comcast can be expected to fall to the next support level 34.00 (low of the previous minor correction (b)).
Comcast Stock Chart Fibonacci Analysis 052025Trading Idea
1) Find a FIBO slingshot
2) Check FIBO 61.80% level
3) Entry Point > 3/61.80%
Chart time frame:D
A) 15 min(1W-3M)
B) 1 hr(3M-6M)
C) 4 hr(6M-1year)
D) 1 day(1-3years)
Stock progress:A
A) Keep rising over 61.80% resistance
B) 61.80% resistance
C) 61.80% support
D) Hit the bottom
E) Hit the top
Stocks rise as they rise from support and fall from resistance. Our goal is to find a low support point and enter. It can be referred to as buying at the pullback point. The pullback point can be found with a Fibonacci extension of 61.80%. This is a step to find entry level. 1) Find a triangle (Fibonacci Speed Fan Line) that connects the high (resistance) and low (support) points of the stock in progress, where it is continuously expressed as a Slingshot, 2) and create a Fibonacci extension level for the first rising wave from the start point of slingshot pattern.
When the current price goes over 61.80% level , that can be a good entry point, especially if the SMA 100 and 200 curves are gathered together at 61.80%, it is a very good entry point.
As a great help, tradingview provides these Fibonacci speed fan lines and extension levels with ease. So if you use the Fibonacci fan line, the extension level, and the SMA 100/200 curve well, you can find an entry point for the stock market. At least you have to enter at this low point to avoid trading failure, and if you are skilled at entering this low point, with fibonacci6180 technique, your reading skill to chart will be greatly improved.
If you want to do day trading, please set the time frame to 5 minutes or 15 minutes, and you will see many of the low point of rising stocks.
If want to prefer long term range trading, you can set the time frame to 1 hr or 1 day.

CMCSA Comcast Corporation Options Ahead of EarningsAnalyzing the options chain and the chart patterns of CMCSA Comcast Corporation prior to the earnings report this week,
I would consider purchasing the 37.5usd strike price Calls with
an expiration date of 2025-9-19,
for a premium of approximately $1.35.
If these options prove to be profitable prior to the earnings release, I would sell at least half of them.

Comcast Wave Analysis – 26 February 2025
- Comcast reversed from the resistance level 36.40
- Likely to fall support level 34.00
Comcast recently reversed down from the resistance area between the resistance level 36.40 (former strong support from January) and the 38.2% Fibonacci correction of the downward impulse 1 from November.
The downward reversal from the resistance level 36.40 started wave b of the active minor ABC correction 2 from the end of January.
Given the clear daily downtrend, Comcast is likely to fall further toward the next support level 34.00, the target price for the completion of the active wave b.

Bullish for Comcast. CMCSAWe finished a downward 5 wave Elliott impulse, with reversal being proven as far as we are concerned. The indicators are generally bullish, bullish divergent in tandem and pivoted. Good luck and manage your risk!
CMCSA : Going long for about 0.625% of the net capitalTechnical Overview :
Took a position for about 0.625% of the net capital from the lower trendline of the parallel channel. The price did form a gap down and hence I waited for a consolidation pattern to be formed before being involved in the scrip.
Will be targeting the higher trendline of the parallel channel which is about 35% move from the average entry price.
Fundamental Overview :
In the fourth quarter ending December 31, 2024, Comcast reported a 2% increase in revenue, totaling $31.92 billion, and an adjusted earnings per share of $0.96. The Connectivity & Platforms segment saw a 5% revenue growth to $11.5 billion. However, the company experienced a loss of 139,000 broadband subscribers, exceeding the anticipated loss of 100,000.
Analysts have suggested that Comcast could unlock significant value by restructuring, potentially splitting into three separate public companies. This move is projected to increase Comcast’s stock value by 57%. The conglomerate structure has been cited as a factor leading to market discounts due to concerns over capital returns and leadership alignment.
📢📢📢
If my perspective changes or if I gather additional fundamental data that influences my views, I will provide updates accordingly.
Thank you for following along with this journey, and I remain committed to sharing insights and updates as my trading strategy evolves. As always, please feel free to reach out with any questions or comments.
Other posts related to this particular position and scrip, if any, will be attached underneath. Do check those out too.
Disclaimer: The analysis shared here is for informational purposes only and should not be considered as financial advice. Trading in all markets carries inherent risks, and past performance is not indicative of future results. It’s essential to conduct your own research and assess your risk tolerance before making any investment decisions. The views expressed in this analysis are solely mine. It’s important to note that I am not a SEBI registered analyst, so the analysis provided does not constitute formal investment advice under SEBI regulations.

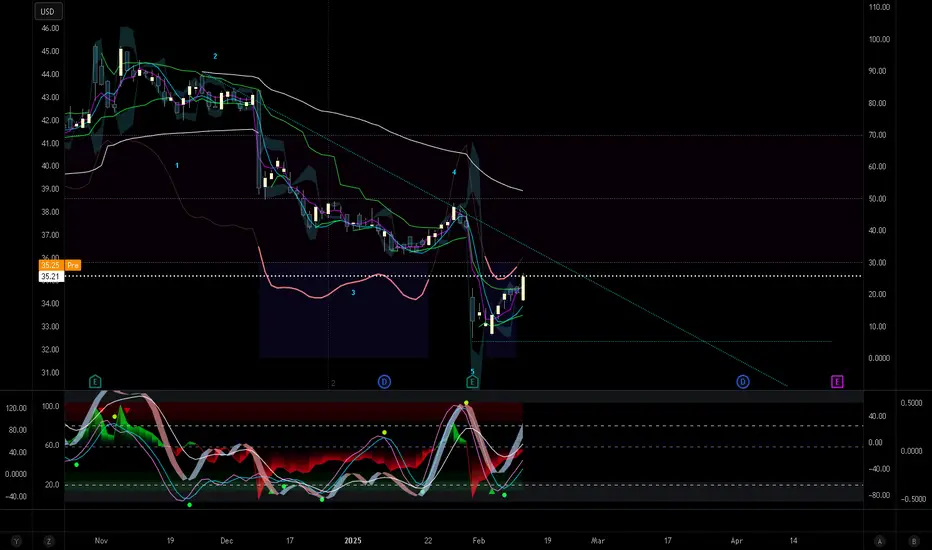
Comcast Wave Analysis – 5 February 2025
- Comcast reversed from key support level 32.50
- Likely to rise to resistance level 35.00
Comcast recently reversed up from key support level 32.50, which stopped the previous sharp downward impulse wave at the end of December.
The support level 32.50was further strengthened by the lower daily Bollinger Band and by the support trendline of the daily down channel from November.
Given the oversold daily RSI indicator, Comcast can be expected to rise to the next resistance level 35.00.

CMCSA Comcast Corporation Options Ahead of EarningsAfter CMCSA reached the previous price target:
Now analyzing the options chain and the chart patterns of CMCSA Comcast Corporation prior to the earnings report this week,
I would consider purchasing the 40usd strike price Calls with
an expiration date of 2025-6-20,
for a premium of approximately $1.86.
If these options prove to be profitable prior to the earnings release, I would sell at least half of them.

Comcast Web CastA web of potential zones of influence and 3 curves that might act as support and/or resistance. Looking for consolidations at the elements, breaks, and perhaps one important inflection point at one of them.
The main scenario follows the path of the rectangles, but hopefully they are designed well enough so that if the path of the stock price deviates into anything else, we might see a pivot or other developments (: bounce) at the most important of them all which can be either of them depending on the evolutions.

