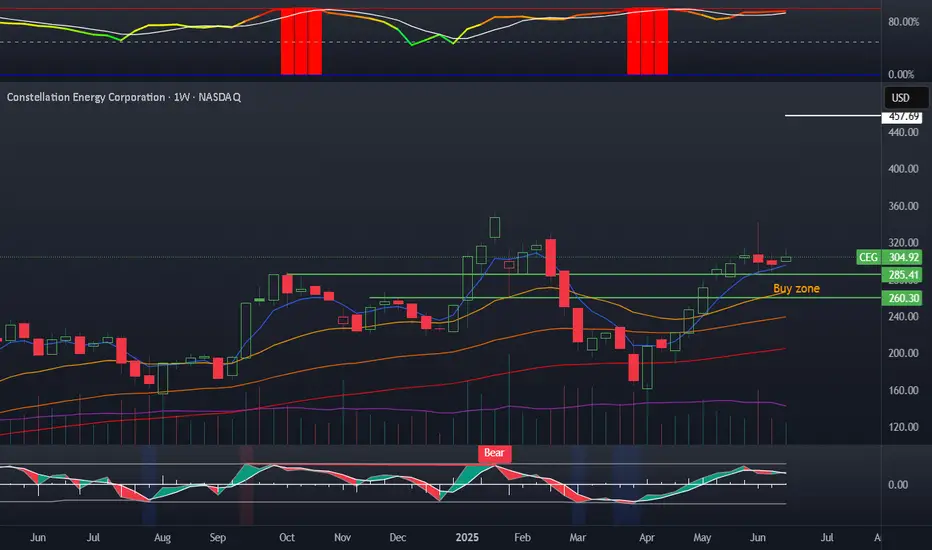
Comeback for Constellation Energy?Constellation Energy has been powering down for the last month, but now some traders may think the electricity stock is ready for a comeback.
The first pattern on today’s chart is the weekly close of $297.49 on May 23. CEG tested and held that zone several times in early June. Prices returned to that level last week and are now bouncing. That may suggest old support remains in effect.
Second, the 100-day simple moving average is rising through the same area on the chart. That may confirm a longer-term uptrend.
Third, stochastics are turning up from an oversold condition.
Next, CEG has pushed back against a falling trendline and the 21-day exponential moving average. That could reflect more bullishness in the short term.
Finally, investors may refocus on big-picture points. First, there are hopes of rate cuts after producer price inflation was lower than expected. Second is the ongoing AI buildout (with all the associated demand for electricity) following Oracle’s NYSE:ORCL strong guidance last night.
TradeStation has, for decades, advanced the trading industry, providing access to stocks, options and futures. If you're born to trade, we could be for you. See our Overview for more.
Past performance, whether actual or indicated by historical tests of strategies, is no guarantee of future performance or success. There is a possibility that you may sustain a loss equal to or greater than your entire investment regardless of which asset class you trade (equities, options or futures); therefore, you should not invest or risk money that you cannot afford to lose. Online trading is not suitable for all investors. View the document titled Characteristics and Risks of Standardized Options at www.TradeStation.com . Before trading any asset class, customers must read the relevant risk disclosure statements on www.TradeStation.com . System access and trade placement and execution may be delayed or fail due to market volatility and volume, quote delays, system and software errors, Internet traffic, outages and other factors.
Securities and futures trading is offered to self-directed customers by TradeStation Securities, Inc., a broker-dealer registered with the Securities and Exchange Commission and a futures commission merchant licensed with the Commodity Futures Trading Commission). TradeStation Securities is a member of the Financial Industry Regulatory Authority, the National Futures Association, and a number of exchanges.
TradeStation Securities, Inc. and TradeStation Technologies, Inc. are each wholly owned subsidiaries of TradeStation Group, Inc., both operating, and providing products and services, under the TradeStation brand and trademark. When applying for, or purchasing, accounts, subscriptions, products and services, it is important that you know which company you will be dealing with. Visit www.TradeStation.com for further important information explaining what this means.
E7S trade ideas

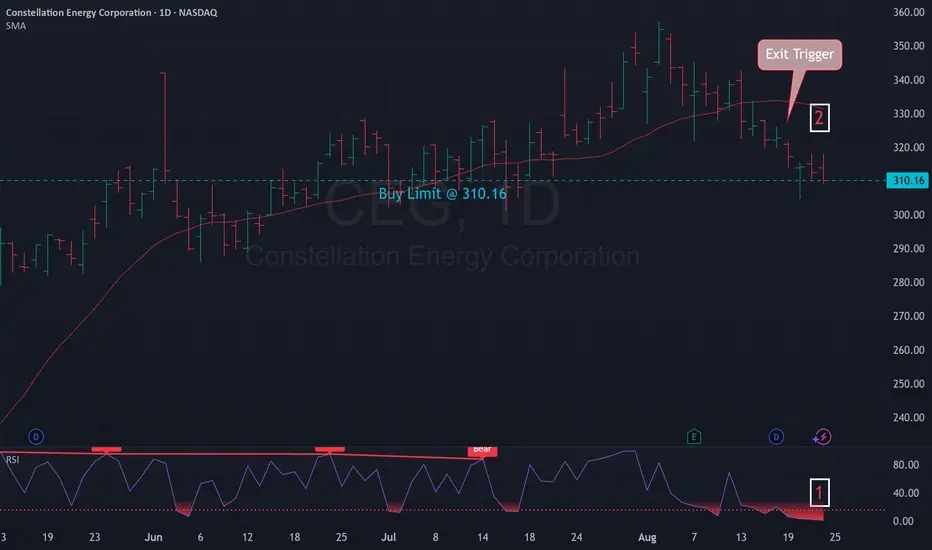
Mean Reversion Setup: CEG1. RSI in oversold region
2. Price likely to rebound back the the mean
Trade Rules:
Entry Trigger - RSI has cross below oversold region, enter limit buy at close price
Exit Trigger - Close at market when close price cross above exit trigger (Red Line)
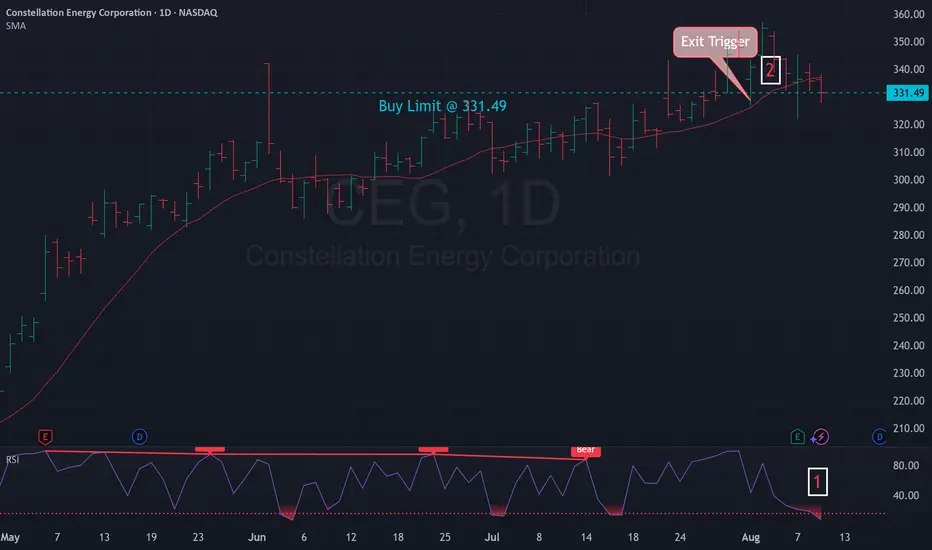
Mean Reversion Setup: CEG1. RSI in oversold region
2. Price likely to rebound back the the mean
Trade Rules:
Entry Trigger - RSI has cross below oversold region, enter limit buy at close price
Exit Trigger - Close at market when close price cross above exit trigger (Red Line)
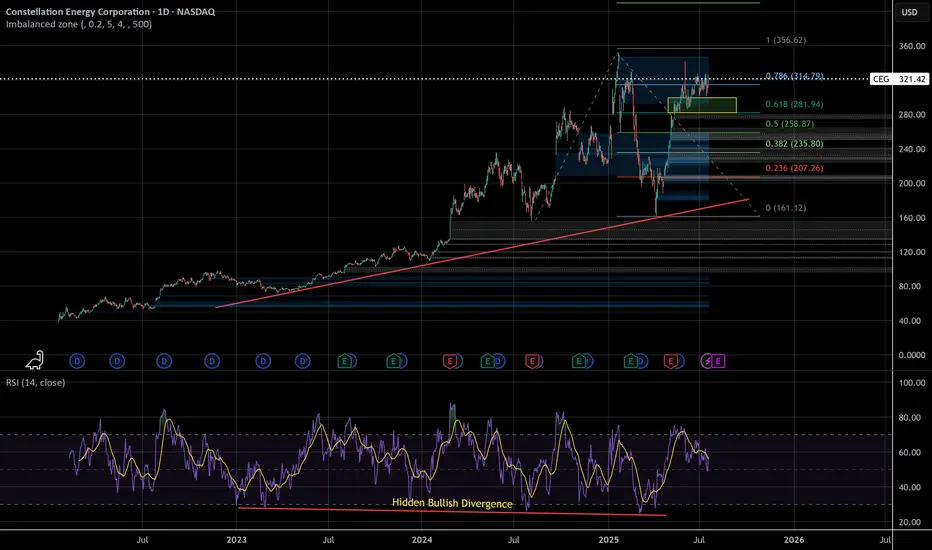
Great looking setupI see no bearish divergence, with hidden bullish divergence forming. Waiting for a dip below the current support for a buy, this looks great to me personally.
This also fits in with the general narrative of nuclear power being on the rise, it's about time.
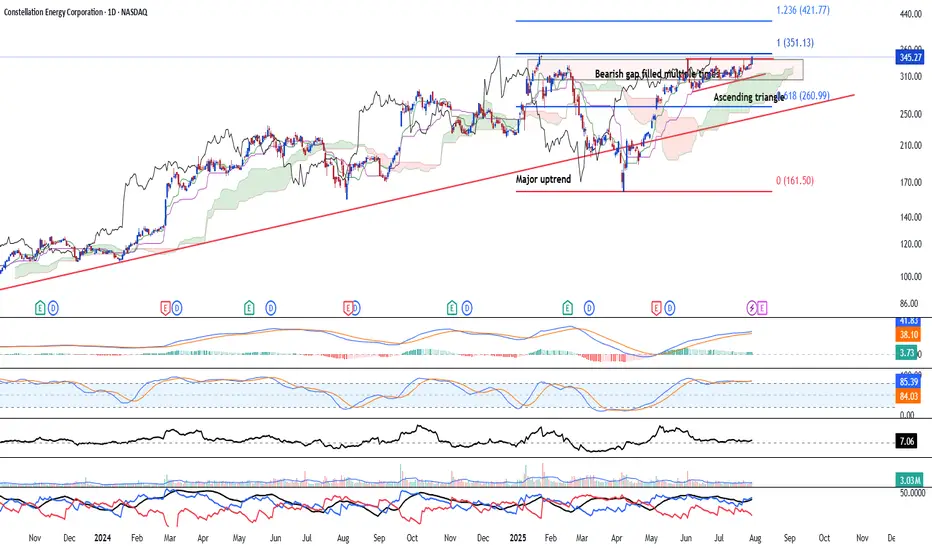
Upside break likelyNASDAQ:CEG Constellation Energy Corp (US: CEG) is likely to break above after the bearish gap has been filled multiple times and closes higher. Ascending triangle formation is likely to see bullish continuation to the upside and major uptrend remain intact since its inception. Volume remain healthy.
Long-term MACD shows steady state of bullish momentum.
Despite showing overbought by our mid-term stochastic oscillator, the stock has yet to see adverse correction and bullish pressure remain healthy.
23-period ROC declines but maintain a positive value and Directional movement index shows strong bullish strength.
Strategy
Buy spot @ 345.27 . Buy limit @ 311.65 in the event of a correction..
1st Target is at 420.00 (Est 1 month)
2nd Target is at 780.00 (6 months and beyond)
CEG on the watch listI have been following CEG for a while and am looking to obtain more energy expansion in my portfolio. I would LOVE to buy this stock closer to 275, but this might now happen. There have been weekly wicks into the top of the buy zone, so far I have missed the opportunity as I am in other plays. We note a ranging stochastic, and very elevated volatility. This is because energy growth stocks are associated with Ai expansion. CEG recently partnered with microsoft to restart the 3 mile island nuclear plant but with upgraded technology and safety features. The market might still be soured on nuclear, but it remains a very effective energy source.
Looking for another buy in the region of high 100It seems that the OB oscillator and the fast climb up may need a slight retracement for continuation. Possible W formation watching as the long-term for a swing is bullish.

CEG eyes on $224: Golden Genesis that could mark bottom CEG is trying to recover along with the nuclear sector in general.
Currently orbiting a well established Golden Genesis fib at $224.06
Look for a clean bounce off this fib to continue the recovery climb.
==========================================================
.

Constellation Energy Back Up to $350CEG is on major support and *likely* to rise back up to $350 and above. That would be the next major support if it gets above.
Good luck!

Constellation of opportunitiesIt is clear that five impulse is in the past and now it is a correction. This idea is to ride wave C of the correction.

Get ready to double your honeyAll right, getting ready for 2x 3x my money !!! Luv this dip and the swings. Bubble begins now !!

Here’s the updated version with your additions: --- SpeculatiHere’s the updated version with your additions:
---
Speculative Madness: The Market’s Bubble Stocks
Some stocks aren't just overvalued—they're in full speculative bubble mode. Fundamentals? Irrelevant. When euphoria takes over, rationality disappears.
Here’s my list of bubble stocks that scream unsustainable pricing:
SBUX, T, PLTR, BMY, PYPL, NFLX, GS, ISRG, ARM, C, SHOP, BSX, SPOT, UBS, IBKR, RELX, CEG, CRWD, MSTR, MMM, DASH, COF...
And let’s not forget the obvious: TSLA, META, AMZN, AVGO, GOOGL, JPM, MA, V, WMT.
Honestly, the entire banking sector, brokers, and tech are in bubble territory.
What the hell is going on with this market? Why are algos just buying, buying, buying, squeezing all the shorts?! Unbelievable.
The dump will be insannnnnnnne!!! 🚨

CEG PUT ON WATCHLISTThis Weekly FORECAST
Opportunity for CEG. This setup is my trading idea/plan, if you want to follow: trade at your own risk (TAYOR).
Risk Factors:
1. Market conditions, unexpected news, or external events could impact the trade.
2. Always use risk management strategies to protect your capital.


GAP Fill at 208 otherwise buying pressureThe 100 and 200 are very close, with buying indicators evident, not convinced about reversal, but they are coming close for the short term, observing the gap as close as it is.

223 still a key area if your talking short term and bearishThis is an area that has swung sideways a few times before the initial breakout and then a retrace and continuation for the short-term bearish.

Trading JournalSee the notes in charts,
Bought initially, sold 1/2 for profit, let the other half run.
Unfortunately earnings were around the corner and did not realize.
Sold for a loss first candle at the gap down

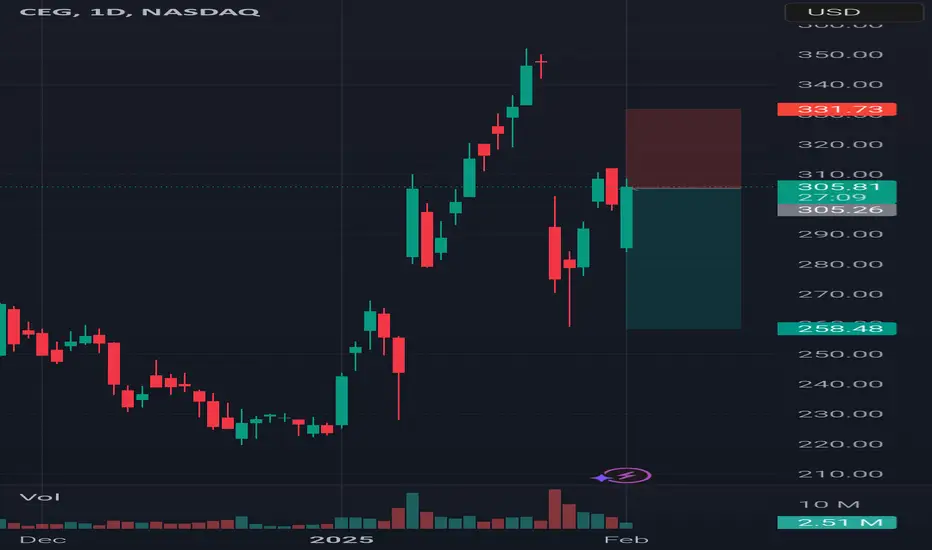
Constellation about to see Stars! 45%+ UpsideChart #1/ 40: NASDAQ:CEG 🔋
-Need Bull Flag Breakout at $268
-Need H5 Indicator to flip to Green with breakout
-Volume Shelf Launch to ATH's
🎯 $289
📏 $388
⏳ Feb2025
NFA

$CEG is gearing up for a breakout. 45% Move InboundChart #1/ 40: NASDAQ:CEG 🔋
-Need Bull Flag Breakout at $268
-Need H5 Indicator to flip to Green with breakout
-Volume Shelf Launch to ATH's
🎯 $289
📏 $388
⏳ Feb2025
NFA

BASED ON THESE INDICATORS BACK TO 280It seems like very bullish territory as far as the price movement is concerned. Breaking into stair steps and flag pattern crossover, MACD is starting to use a tad more green in the histogram, and making another move up seems inevitable.

Hits the volume box does it decline and head back low 200sThe stochastic is the only bullish indicator for me right now. Other than that, it's hanging from a thread and needs a good catalyst. Earnings weren't, but they have been consistently running this past week. However, due to the positioning, we can use the high V box as the resistance mark unless it breaks and forms a new pattern.

CEG Long (Stop Limit)Asset Class: Stocks
Income Type: Daily
Symbol: CEG
Trade Type: Long
Trends:
Short Term: Down
Long Term: Up
Set-Up Parameters:
Entry: 237.90 (at the Breakout)
Stop: 223.79
TP 223.79 (3:1)
Trade idea:
A price pin into a daily Fair Value Gap , Buying the Stop as the price pullback and the SL at the last swing low. The trade setup also use the Elliot wave analysis, where the price is likely to form wave 5 next. The setup has a 3:1 RRR. The RSI is oversold on the 4H , and heading up.
!!Be aware of pending Economic Reports. If price is within 20 pips of proximal value at time of major impact report, then Confirmation entry.
Trade management:
-Split the TP to 3 orders at each TP
-when price hits 1:1 , consider moving stop to entry in case of pullback. So your trade is risk free.
-After TP2 hit, you might consider canceling the TP3 and trail the SL to maximize your profit.
**Disclaimer**:
The trading strategies, ideas, and information shared are for educational and informational purposes only. They do not constitute financial advice or a recommendation to buy or sell any securities, currencies, or financial instruments. You should do your own research or consult with a licensed financial advisor before making any trading decisions. The author assumes no responsibility for any losses incurred from following these trading ideas.
