Chart Industries (GTLS) AnalysisCompany Overview:
Chart Industries NYSE:GTLS is a leading manufacturer of cryogenic equipment, offering solutions vital for the storage, distribution, and processing of clean energy resources like LNG, hydrogen, and oxygen. The company plays a pivotal role in supporting the global energy transitio
Next report date
—
Report period
—
EPS estimate
—
Revenue estimate
—
1.0 EUR
213.00 M EUR
4.02 B EUR
44.62 M
About Chart Industries, Inc.
Sector
Industry
CEO
Jillian C. Evanko
Website
Headquarters
The Woodlands
Founded
1992
ISIN
US16115Q4073
Chart Industries, Inc. engages in the manufacturing of engineered equipment for the industrial gas, energy, and biomedical industries. It operates through the following business segments: Cryo Tank Solutions, Heat Transfer Systems, Specialty Products and Repair and Service & Leasing. The Cryo Tank Solutions segment supplies bulk, microbulk, and mobile equipment used in the storage, distribution, vaporization, and application of industrial gases. The Heat Transfer Systems segment supplies mission engineered equipment and systems used in the separation, liquefaction, and purification of hydrocarbon and industrial gases. The Specialty Products segment supplies products used in specialty market applications including hydrogen, HLNG vehicle tanks, food and beverage, space exploration, lasers, cannabis, and water treatment. The Repair, Service, and leasing segment includes repair and service centers globally, which provide installation, service, repair, maintenance, and refurbishment of cryogenic products, as well as global equipment leasing solutions. The company was founded in 1992 and is headquartered in The Woodlands, TX.
Related stocks

GTLS Losing SteamNYSE:GTLS has a nice upward trend but, it's beginning to lose some of that steam. The bears have taken the Day and the Weekly charts but not the Month or the Quarter yet.
Looking at the pattern with the bearish 222 soldiers in place and knowing that stocks like to retrace pervious support and res

GTLS: Watching Diversified IndustrialsThe Diversified Industrials Industry is expected to have good growth this year. GTLS is in that industry.
The stock is developing a bottom with intermittent institutional accumulation at a strong support level from 2022.
Percentage of Shares Held by Institutions is very high.
When the bottom


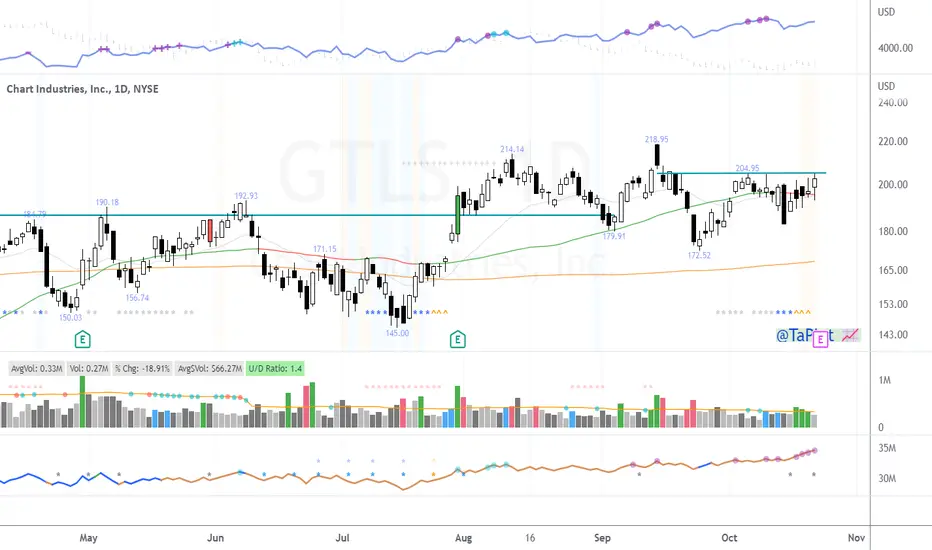
Chart Industries USA Sun Storm Investment Trading Desk & NexGen Wealth Management Service Present's: SSITD & NexGen Portfolio of the Week Series
Focus: Worldwide
By Sun Storm Investment Research & NexGen Wealth Management Service
A Profit & Solutions Strategy & Research
Trading | Investment | Stocks | ETF | Mutua

GTLS BreakoutGTLS breaking out of 6 Month Long Base
Price above 200 DMA
Excellent run-up to the breakout

inflection point for $GTLS?This morning took a small position in $GTLS after it run up at the open and went back down immediately to some mid support level.
Entered the trade at around 154-155.
It might have been premature, since the company is moving sideway and staying inside the channel, both on the top and bottom. But

GTLS LONGGTLS has been moving in an upward channel, recently came back to test the support level of the trendline. Looks to be bouncing off and moving back towards the upper end of the channel. Looking to scale out partial position at recent highs, then moving SL to BE and letting the shares move as much as

See all ideas
Displays a symbol's price movements over previous years to identify recurring trends.
GTLS5512830
Chart Industries, Inc. 9.5% 01-JAN-2031Yield to maturity
7.85%
Maturity date
Jan 1, 2031
GTLS5512828
Chart Industries, Inc. 7.5% 01-JAN-2030Yield to maturity
6.29%
Maturity date
Jan 1, 2030
See all I3N0 bonds
XPF
iShares S&P/TSX North American Preferred Stock Index ETF (CAD-Hedged) Trust UnitsWeight
0.23%
Market value
394.67 K
USD
Explore more ETFs
Frequently Asked Questions
Depending on the exchange, the stock ticker may vary. For instance, on FWB exchange Chart Industries, Inc. Shs Depository Shs Repr 1/20th Pfd Shs Series B stocks are traded under the ticker I3N0.
I3N0 reached its all-time high on Jan 20, 2025 with the price of 78.5 EUR, and its all-time low was 43.0 EUR and was reached on Jan 29, 2024. View more price dynamics on I3N0 chart.
See other stocks reaching their highest and lowest prices.
See other stocks reaching their highest and lowest prices.
Yes, you can track Chart Industries, Inc. Shs Depository Shs Repr 1/20th Pfd Shs Series B financials in yearly and quarterly reports right on TradingView.
Chart Industries, Inc. Shs Depository Shs Repr 1/20th Pfd Shs Series B is going to release the next earnings report on Feb 27, 2026. Keep track of upcoming events with our Earnings Calendar.
I3N0 earnings for the last quarter are 2.37 EUR per share, whereas the estimation was 2.58 EUR resulting in a −8.29% surprise. The estimated earnings for the next quarter are 2.99 EUR per share. See more details about Chart Industries, Inc. Shs Depository Shs Repr 1/20th Pfd Shs Series B earnings.
Chart Industries, Inc. Shs Depository Shs Repr 1/20th Pfd Shs Series B revenue for the last quarter amounts to 937.93 M EUR, despite the estimated figure of 1.01 B EUR. In the next quarter, revenue is expected to reach 1.06 B EUR.
I3N0 net income for the last quarter is −118.03 M EUR, while the quarter before that showed 64.60 M EUR of net income which accounts for −282.70% change. Track more Chart Industries, Inc. Shs Depository Shs Repr 1/20th Pfd Shs Series B financial stats to get the full picture.
Yes, I3N0 dividends are paid quarterly. The last dividend per share was 0.73 EUR. As of today, Dividend Yield (TTM)% is 0.00%. Tracking Chart Industries, Inc. Shs Depository Shs Repr 1/20th Pfd Shs Series B dividends might help you take more informed decisions.
Chart Industries, Inc. Shs Depository Shs Repr 1/20th Pfd Shs Series B dividend yield was 0.00% in 2024, and payout ratio reached 0.00%. The year before the numbers were 0.00% and 0.00% correspondingly. See high-dividend stocks and find more opportunities for your portfolio.
As of Dec 8, 2025, the company has 11.93 K employees. See our rating of the largest employees — is Chart Industries, Inc. Shs Depository Shs Repr 1/20th Pfd Shs Series B on this list?
EBITDA measures a company's operating performance, its growth signifies an improvement in the efficiency of a company. Chart Industries, Inc. Shs Depository Shs Repr 1/20th Pfd Shs Series B EBITDA is 836.26 M EUR, and current EBITDA margin is 22.66%. See more stats in Chart Industries, Inc. Shs Depository Shs Repr 1/20th Pfd Shs Series B financial statements.
Like other stocks, I3N0 shares are traded on stock exchanges, e.g. Nasdaq, Nyse, Euronext, and the easiest way to buy them is through an online stock broker. To do this, you need to open an account and follow a broker's procedures, then start trading. You can trade Chart Industries, Inc. Shs Depository Shs Repr 1/20th Pfd Shs Series B stock right from TradingView charts — choose your broker and connect to your account.